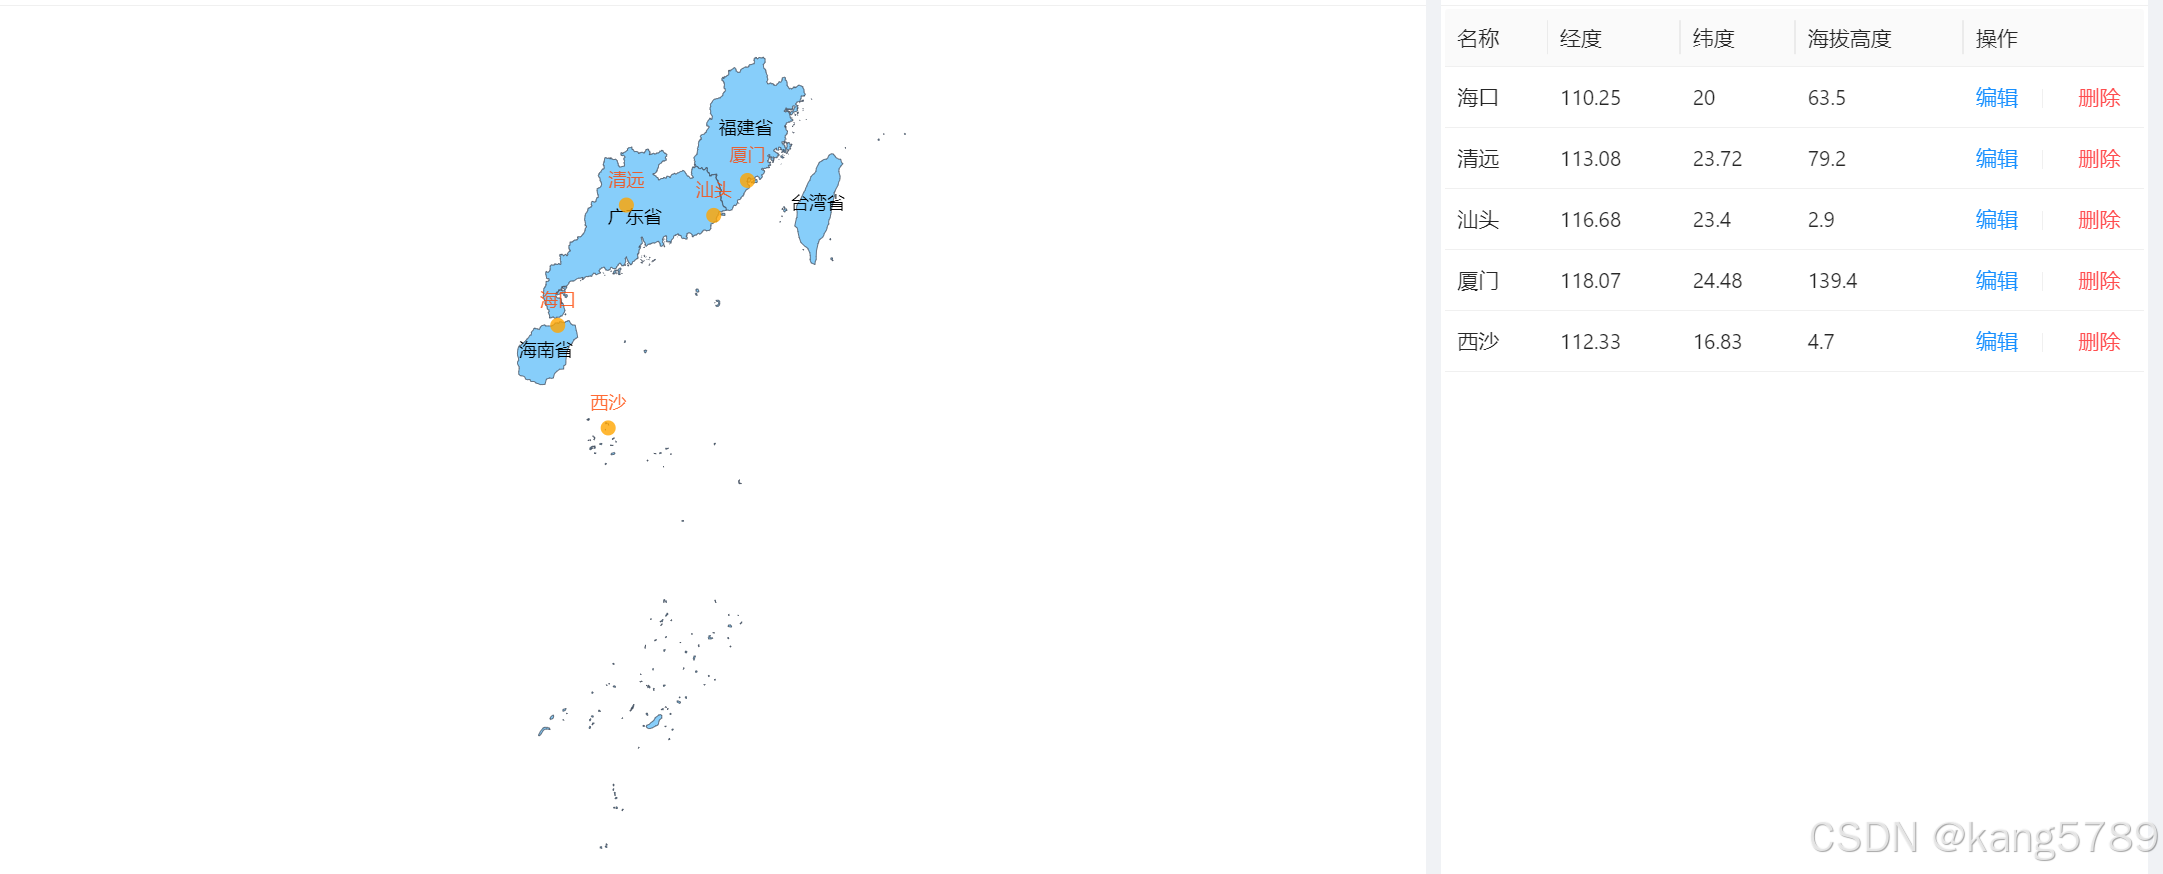
效果如下,加载了南海区域的地图,并标注几个气象站点;
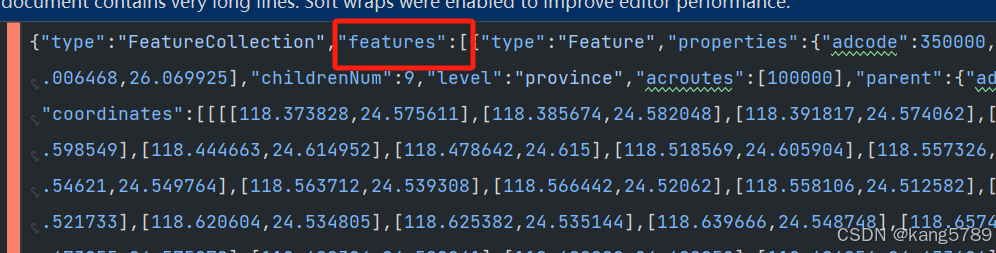
1、下载区域地图的json:datav.geoatlas地理小工具系列

新建nanhai.json,把下载的json数据放进来
说明:如果第二步不打勾,只显示省的名字,
如果打勾的话,会显示省下所有市的名字,看个人需求
如果要把多个省放在一起展示,则把多个json文件里的features数据合并即可
2、使用echarts展示地图
<!--地图-->
<div ref="chartref" class="chart"/>

<script setup>
import {ref, onmounted} from 'vue'
import * as echarts from 'echarts'
import nanhaijson from '@/assets/map/nanhai.json'

//地图json数据: https://datav.aliyun.com/portal/school/atlas/area_selector
const chartref = ref()
const formref = ref()
let mychart = null;
const stationdata = ref([])

//加载数据
onmounted(() => {
	//加载南海地图
	echarts.registermap('nanhai', nanhaijson)
	loaddata()
})


const loaddata = () => {
	xxapi.xxpage().then((data) => {
		if (data && data.total > 0) {
			stationdata.value = []
//拼接地图上需要标注的点
data.records.foreach((item) => {
				stationdata.value.push(
					{
						name: item.name,
						value: [item.longitude, item.latitude]
					}
				)
			})
		}
		loadchart()
	})

}

//加载图表
const loadchart = () => {
	// 如果实例已经存在,则先销毁再重新创建
	if (mychart != null && mychart.dispose) {
		mychart.dispose();
	}
	mychart = echarts.init(chartref.value)
	mychart.showloading({text: 'loading'})

	let option = {
		geo: {
			map: 'nanhai',
			zoom: 1.2,//缩放比例
			roam: true, // 是否允许缩放和平移
			itemstyle: {
				areacolor: 'lightskyblue',
				bordercolor: '#404a59'
			},
			label: {
				show: true
			},
		},
		//气象站点列表
		series: [{
			type: 'scatter',
			coordinatesystem: 'geo',
			data: stationdata.value,
			symbolsize: 10,
			label: {
				show: true,
				formatter: function (params) {
					return params.name; // 显示点的name
				},
				position: 'top', // 或其他位置
				color: '#ff4500' // 设置标签字体颜色为红色
			},
			itemstyle: {
				normal: {
					color: '#ffa500' // 设置为橘黄色
				}
			},
		}]
	}

	mychart.hideloading()
	mychart.setoption(option)
	// 自适应屏幕
	window.addeventlistener('resize', function () {
		mychart.resize()
	})
}

</script>

<style scoped>
.chart {
	height: 550px;
}

.detail-chart {
	height: 100%;
	overflow: auto;
}

</style>
ok,大功搞定!!!
到此这篇关于echarts加载区域地图并标注点的文章就介绍到这了,更多相关echarts加载区域地图标注点内容请搜索代码网以前的文章或继续浏览下面的相关文章希望大家以后多多支持代码网!


发表评论