react echarts 组件的封装
import react, { useeffect, useref } from 'react';
import { usesize, usedebounceeffect } from 'ahooks';
import loopshowtooltip from './echartstooltiploop';
import * as echarts from 'echarts';
const commonchart = props => {
    const { chartid, options, autotooltip } = props;
    const chartref = useref();
    const size = usesize(chartref);
    const loopref = useref();
    useeffect(() => {
        let chartdom;
        let mychart;
        if (loopref.current) {
            loopref.current?.clearloop();
            loopref.current = null;
        }
        settimeout(() => {
            if (loopref.current) {
                loopref.current?.clearloop();
                loopref.current = null;
            }
            if (chartref) {
                chartdom = chartref.current;
                mychart = echarts.init(chartdom);
                options && mychart.setoption(options);
                if (autotooltip) {
                    loopref.current = new loopshowtooltip(mychart, options, {});
                }
            }
        });
        window.onresize = () => {
            mychart.resize();
        };
        return () => {
            window.onresize = null;
            loopref?.current?.clearloop();
            loopref.current = null;
        };
    }, [chartid, options]);
    usedebounceeffect(() => {
        let mychart;
        let chartdom;
        if (chartref) {
            chartdom = chartref.current;
            mychart = echarts.init(chartdom);
            options && mychart.setoption(options);
            mychart.resize();
        }
        window.onresize = () => {
            mychart.resize();
        };
    }, [size], {
        wait: 100,
    });
    return <div ref={chartref} style={{ width: '100%', height: '100%' }}></div>;
};
export default commonchart;
使用案例
import react from "react";
import commonchart from './pages/commonchart/ui'
const demo = () => {
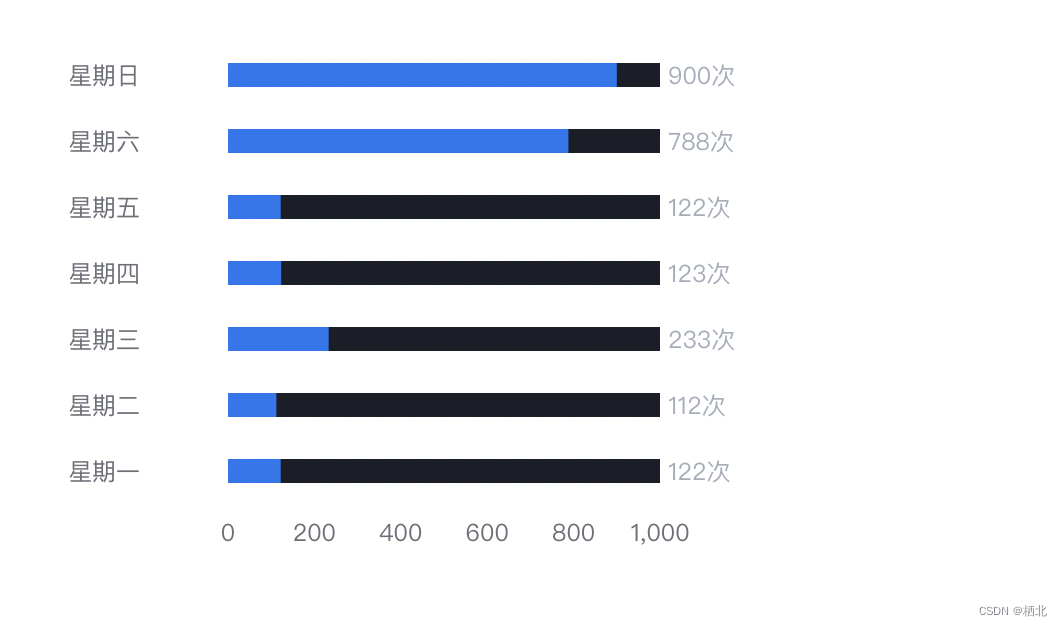
let echardata = [122,112,233,123,122,788,900];
let yaxisdata = ['星期一','星期二','星期三','星期四','星期五','星期六','星期日'];
const chartoptions = {
grid: {
top: '8%',
bottom: '15%',
left: '30%',
right: '16%',
// containlabel: true,
},
tooltip: {
trigger: 'item',
show: true,
backgroundcolor: '#3a3f4d',
borderwidth: 0,
textstyle: {
// 提示框浮层的文本样式。
color: '#b1b6c2',
fontstyle: 'normal',
fontweight: 'normal',
fontfamily: 'sans-serif',
fontsize: 14,
},
formatter: record => {
let result = `${record.name}:${record.value} 次`;
return result;
},
},
xaxis: {
type: 'value',
boundarygap: [0, 0.01],
splitline: {
show: false,
},
},
yaxis: {
type: 'category',
data: yaxisdata,
scale: true,
axistick: {
// x轴刻度线
show: false,
alignwithlabel: true,
},
axislabel: {
interval: 0,
width: 80,
overflow: 'truncate',
ellipsis: '...',
align: 'left',
margin: 80,
},
axisline: {
// 坐标轴
show: false,
},
},
series: [
{
name: '2011',
type: 'bar',
showbackground: true,
backgroundstyle: {
color: '#1a1e28',
},
barwidth: 12, // 柱图宽度
itemstyle: {
normal: {
// 柱状图上显示数量
label: {
show: true, // 是否显示
position: [220, 0], // 位置
formatter: '{@value}' + '次', // 内容
color: '#a5adba', // 文字颜色
},
color: '#2275f0', // 柱子颜色
},
},
data: echardata,
},
],
};
return (
<div style={{height:300, width: 400}}>
<commonchart options={chartoptions} />
</div>
);
};
export default demo;到此这篇关于react echarts 组件的封装的文章就介绍到这了,更多相关react echarts 组件封装内容请搜索代码网以前的文章或继续浏览下面的相关文章希望大家以后多多支持代码网!


发表评论