apache echarts echarts官网,可在“快速上手”处查看详细安装方法
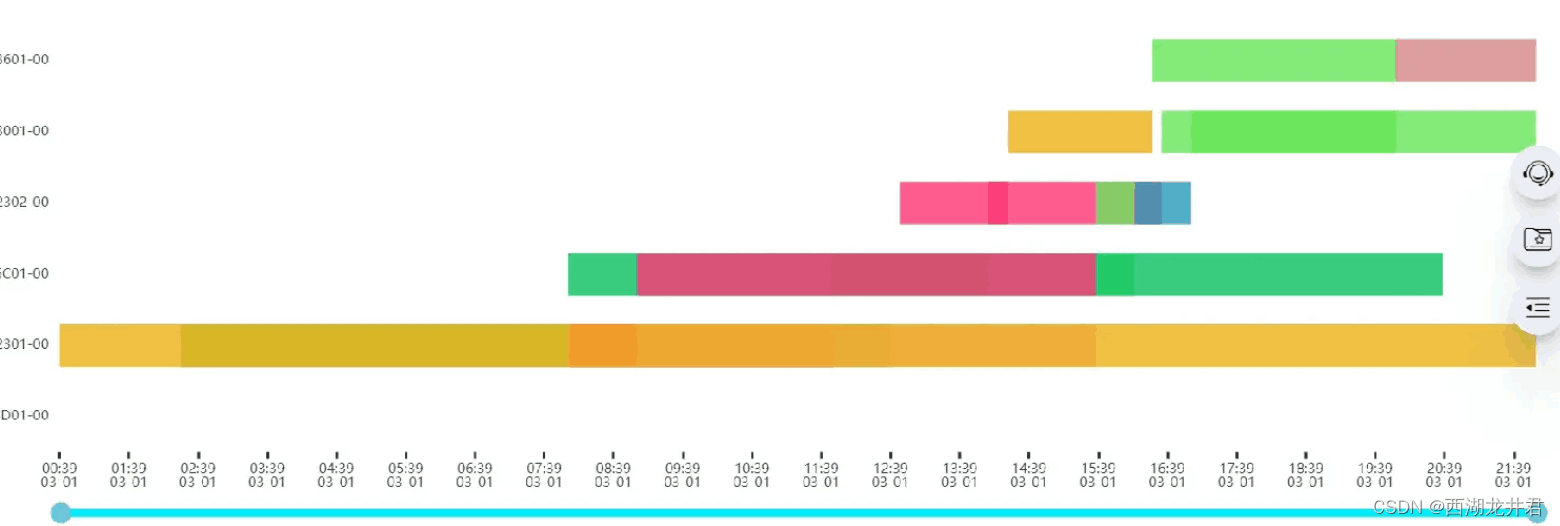
1.效果图
可鼠标滚轮图表和拉动下方蓝色的条条调节时间细节哦
(注:最后一个设备没有数据,所以不显示任何矩形)
2.代码
根据每个设备的不同的状态,和对应状态的持续时间渲染矩形
html部分
<div id="myechart" :style="{ float: 'left', width: '100%', height: '100%' }"></div>js部分
        // 甘特图 数据处理及挂载函数,可在获取到数据或者数据更新时调用
        drawechart() {
            // this.neweqp为数据集,从后端获取
            var data = this.neweqp
            // 设定状态对应显示的颜色
            var types = [
                { name: '辅料待料', color: '#07c160' },
                { name: '下游待料', color: '#269abc' },
                { name: '上游待料', color: '#edb217' },
                { name: '其他停机', color: '#f68ba7' },
                { name: '故障停机', color: '#ff3374' },
                { name: '运行', color: '#66e656' },
            ];
            var starttime;
            var datatemp = [];
            // 处理时间,x轴需要月、日、时、分
            for (let i = 0; i < data.length; i++) {
                starttime = new date(data[i].last_eqpt_update_time).gettime();
                var typeitem = types.filter(a => a.name == data[i].eqpt_state_dsc)[0];
                datatemp.push({
                    name: typeitem.name,
                    value: [
                        parseint(data[i].index),
                        new date(data[i].last_eqpt_update_time).gettime(),
                        new date(data[i].eqpt_update_time).gettime(),
                        //data[i].runtime_timestamp,
                        //data[i].end_time_timestamp,
                        data[i].index,
                        data[i].eqpt_dsc
                    ],
                    itemstyle: {
                        normal: {
                            color: typeitem.color
                        }
                    }
                });
            }
            // console.log("data:", data);
            // console.log('datatemp', datatemp);
            // 处理各种状态的起始和结束时间函数
            function renderitem(params, api) {
                var categoryindex = api.value(0);
                var start = api.coord([api.value(1), categoryindex]);
                var end = api.coord([api.value(2), categoryindex]);
                var height = api.size([0, 1])[1] * 0.6;
                var rectshape = echarts.graphic.cliprectbyrect(
                    {
                        x: start[0],
                        y: start[1] - height / 2,
                        width: end[0] - start[0],
                        height: height
                    },
                    {
                        x: params.coordsys.x,
                        y: params.coordsys.y,
                        width: params.coordsys.width,
                        height: params.coordsys.height
                    }
                );
                // 返回矩形对象
                return (
                    rectshape && {
                        type: 'rect',
                        transition: ['shape'],
                        shape: rectshape,
                        style: api.style()
                    }
                );
            }
            // 基于echarts的甘特图
            let myechart = this.$echarts.init(document.getelementbyid("myechart"))
            let myechart2 = {
                textstyle: {
                    color: '#333',
                    fontsize: '0.13rem'
                },
                grid: {
                    top: '5%',
                    left: '8%',
                    bottom: '16%',
                    width: '90%'
                },
                legend: {
                    show: true,
                    itemwidth: 10,
                    itemheight: 10,
                    textstyle: {
                        color: '#fff',
                        fontsize: '0.12rem'
                    },
                    data: types.map(function (type) {
                        return type.name;
                    }),
                },
                tooltip: {
                    show: true,
                    textstyle: {
                        fontsize: 10
                    },
                    axispointer: {
                        type: 'cross',
                        crossstyle: {
                            color: '#333'
                        }
                    },
                    formatter: function (params) {
                        return params.value[4] + '\t' + params.name + '\t' + params.marker + (new date(params.value[1])).gethours() + ':' + (new date(params.value[1])).getminutes() + '—' + (new date(params.value[2])).gethours() + ':' + (new date(params.value[2])).getminutes();
                    }
                },
                datazoom: [
                    {
                        type: 'inside',
                        filtermode: 'weakfilter'
                    },
                    {
                        type: "slider",
                        show: true,
                        height: "6",
                        bottom: "4%",
                        labelformatter: '',
                        backgroundcolor: "white",
                        brushselect: false,
                        minvaluespan: 3600 * 24 * 1000 * 7,
                        handleicon: 'path://path://m100, 100m -75, 0a75,75 0 1,0 150,0a75,75 0 1,0 -150,0',
                        handlesize: 15,
                        handlecolor: '#6bc5da',
                        start: 0,
                        end: 100,
                        handlestyle: {
                            bordercap: 'round',
                            color: "#fff",
                            shadowcolor: 'rgba(0, 0, 0, 0.5)',
                            shadowblur: 1
                        },
                        textstyle: {
                            color: "transparent"
                        },
                        bordercolor: 'transparent',
                        backgroundcolor: '#d7f4ff',
                        databackground: {
                            linestyle: {
                                width: 0
                            },
                            areastyle: {
                                color: 'transparent'
                            }
                        },
                        fillercolor: '#00ebff'
                    }
                ],
                xaxis: {
                    type: 'time',
                    //min: new date(starttime).sethours(7, 0, 0, 0),
                    //max: new date(new date(starttime).setdate(new date(starttime).getdate() + 1)).sethours(7, 0, 0, 0),
                    interval: 3600000,
                    scale: true,
                    axislabel: {
                        formatter: function (val) {
                            return new date(val).tolocaletimestring('en-us', { hour: '2-digit', minute: 'numeric', hour12: false });
                        }
                    },
                    splitline: {
                        show: false
                    },
                    axisline: {
                        show: false
                    },
                    axistick: {
                        show: true,
                        linestyle: {
                            color: '#333',
                            width: 2
                        }
                    },
                    axislabel: {
                        textstyle: {
                            color: '#333',
                            fontsize: '0.14rem'
                        },
                        show: true
                    }
                },
                yaxis: {
                    // y轴数据,这里是设备编号
                    data: this.eqptid,
                    scale: true,
                    splitline: { show: false },
                    axisline: {
                        show: false
                    },
                    axistick: {
                        show: false
                    },
                    axislabel: {
                        show: true,
                        textstyle: {
                            color: '#333',
                            fontsize: '0.12rem',
                            fontweight: 'bolder',
                        }
                    }
                },
                series: [
                    {
                        type: 'custom',
                        // 图表矩形数据
                        renderitem: renderitem,
                        itemstyle: {
                            opacity: 0.8
                        },
                        encode: {
                            x: [0, 1],
                            y: 0
                        },
                        data: datatemp,
                    }
                ]
            }
            myechart.setoption(myechart2)
        }
3.注意事项
甘特图图表可能会不显示,原因一般是在获取到数据之前图表就挂载上了,然后数据更新后并没有更新图表数据。这里本人的方法是在获取到数据的后面调用挂载图表的函数,当然这肯定不是最好的方法。
// 获取图表数据
getcharts().then((res)=>{
    ......
    ......
    // 判断获取到数据后调用处理数据及挂载图表的函数this.drawechart()
    if(res.length !== 0){
        this.drawechart()
    }
})
以上就是vue+echarts实现绘制多设备状态甘特图的详细内容,更多关于vue echarts甘特图的资料请关注代码网其它相关文章!


发表评论