前言
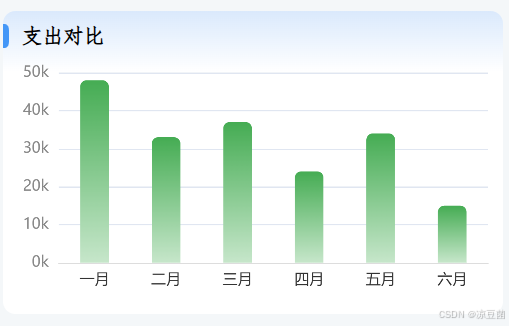
修改柱状图柱子背景色渐变和圆角,可通过修改series.itemstyle.normal.barborderradius属性实现圆角设置,series.itemstyle.normal.color:new echarts.graphic.lineargradient()来设置渐变色柱子。
效果图:
代码如下:
series: [{
    data: data,
    type: 'bar',
    barwidth: '40%',
    itemstyle: {
        normal: {
            //这里设置柱形图圆角 [左上角,右上角,右下角,左下角]
            barborderradius:[5, 5, 0, 0],
            color: new echarts.graphic.lineargradient(
                0, 1, 0, 0, [{//只要修改前四个参数就ok
                        offset: 0,
                        color: '#c6e6ca'
                    }, //柱图渐变色
                    {
                        offset: 1,
                        color: '#45ac53'
                    }
                ]
            ),
        },
    },
}]
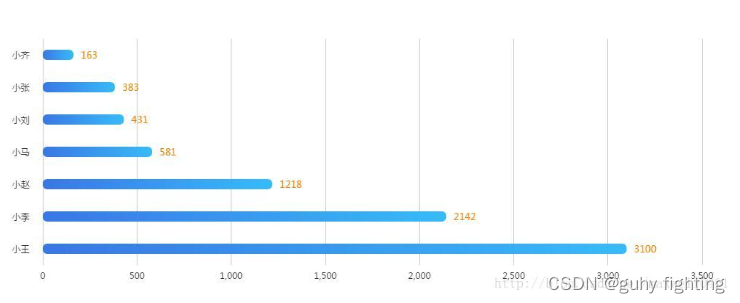
附:echarts绘制横向柱状图(圆角+渐变)
圆角配置
series: [
    {
        name: '数量',
        type: 'bar',
        data: bardata,
        barwidth: 14,
        itemstyle: {
            emphasis: {
                barborderradius: 7
            },
            normal: {
                barborderradius: 7
            }
        }
    }
]
渐变实现
设置itemstyle的color为new echarts.graphic.lineargradient()线性渐变即可. 这个api在官方文档里面都没找到, 经过测试前四个参数设置为0, 0, 1, 0可以从左到右渐变. 设置为0,0,0,1可以从上到下渐变. 第5个参数数组表示开始的颜色和结束的颜色.
itemstyle: {
    emphasis: {
        barborderradius: 7
    },
    normal: {
        barborderradius: 7,
        color: new echarts.graphic.lineargradient(
            0, 0, 1, 0,
            [
                {offset: 0, color: '#3977e6'},
                {offset: 1, color: '#37bbf8'}

            ]
        )
    }
}
完整代码如下
<!doctype html>
<html lang="en">
<head>
<meta charset="utf-8">
<meta http-equiv="x-ua-compatible" content="ie=edge">
<meta name="viewport" content="width=device-width, initial-scale=1.0">
<meta name="description" content="echarts">
<title>echarts绘制横向柱状图(圆角+渐变)</title>
<script src="https://cdn.bootcss.com/echarts/3.5.4/echarts.min.js"></script>
</head>
<body>
<div id="main" style="width: 1000px;height:400px;"></div>
<script type="text/javascript">
     var mychart = echarts.init(document.getelementbyid('main'));

    //初始化数据
    var category = ['小王', '小李', '小赵', '小马', '小刘', '小张', '小齐'];
    var bardata = [3100, 2142, 1218, 581, 431, 383, 163];

    var option = {
        tooltip: {
            trigger: 'axis',
            axispointer: {
                type: 'shadow'
            }
        },
        grid: {
            left: '3%',
            right: '4%',
            bottom: '3%',
            containlabel: true
        },
        xaxis: {
            type: 'value',
            axisline: {
                show: false
            },
            axistick: {
                show: false
            }
        },
        yaxis: {
            type: 'category',
            data: category,
            splitline: {show: false},
            axisline: {
                show: false
            },
            axistick: {
                show: false
            },
            offset: 10,
            nametextstyle: {
                fontsize: 15
            }
        },
        series: [
            {
                name: '数量',
                type: 'bar',
                data: bardata,
                barwidth: 14,
                bargap: 10,
                smooth: true,
                label: {
                    normal: {
                        show: true,
                        position: 'right',
                        offset: [5, -2],
                        textstyle: {
                            color: '#f68300',
                            fontsize: 13
                        }
                    }
                },
                itemstyle: {
                    emphasis: {
                        barborderradius: 7
                    },
                    normal: {
                        barborderradius: 7,
                        color: new echarts.graphic.lineargradient(
                            0, 0, 1, 0,
                            [
                                {offset: 0, color: '#3977e6'},
                                {offset: 1, color: '#37bbf8'}

                            ]
                        )
                    }
                }
            }
        ]
    };
    mychart.setoption(option);
</script>
</body>
</html>
总结
到此这篇关于echarts柱状图修改柱子颜色渐变及柱子圆角的文章就介绍到这了,更多相关echarts柱状图颜色渐变圆角内容请搜索代码网以前的文章或继续浏览下面的相关文章希望大家以后多多支持代码网!


发表评论