概要
使用openlayers实现轨迹运动
整体架构流程
使用postgres(postgis)数据库以及nodejs作为后台,vue和openlayers做前端,openlayers使用http请求通过nodejs从postgres数据库获取数据。
技术名词解释
postgis:postgis是postgres的一个扩展,提供空间对象的相关操作。
技术细节
nodejs直连数据库,openlayers使用http服务通过nodejs转为数据库的查询语句。
实现思路如下:每条数据表示一条船,每个船的轨迹关键点在数据库存为multipointm的geometry数据,其中m分量为时间戳,然后前端传入一个空间范围和时间戳,空间范围主要为了过滤范围外要素加速渲染,时间戳则用来查询所有船的轨迹点小于该时间戳的所有关键点,将其连成线,然后在时间戳所在的区间,使用线性插值插值出小船当前位置,线和插值出的点有相同的fid,在前端通过fid将线和插值点连接并显示,就是船的实时轨迹。
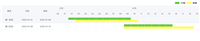
效果如下:

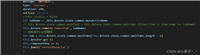
前端代码如下:
<template>
  <div id="map" class="map"></div>
</template>
<script>
import * as ol from 'ol';
import 'ol/ol.css';
import proj from 'ol/proj'
import { fromlonlat } from 'ol/proj';
import map from 'ol/map';
import view from 'ol/view';
import tilelayer from 'ol/layer/tile';
import xyz from 'ol/source/xyz';
import feature from 'ol/feature';
import point from 'ol/geom/point';
import vectorlayer from 'ol/layer/vector';
import vectorsource from 'ol/source/vector';
import { circle as circlestyle, fill, stroke, style } from 'ol/style';
import wkb from 'ol/format/wkb';
import icon from 'ol/style/icon';
import { transformextent } from 'ol/proj';
export default {
  name: 'openlayersmap',
  data() {
    return {
      map: null,
      pointlayer: null,
      linelayer: null,
      linesdata: [],
      pointsdata: [],
      iconimagepath: '../../board.png',
      lastpoint: {}
    };
  },
  mounted() {
    this.initializemap();
    this.timerange();
  },
  methods: {
    initializemap() {
      this.map = new map({
        target: 'map',
        layers: [
          new tilelayer({
            source: new xyz({
              url: 'https://{a-c}.tile.openstreetmap.org/{z}/{x}/{y}.png',
            }),
          }),
        ],
        view: new view({
          center: [0, 0],
          zoom: 2,
        }),
      });
      this.linelayer = new vectorlayer({
        source: new vectorsource(),
      });
      this.map.addlayer(this.linelayer);
      this.pointlayer = new vectorlayer({
        source: new vectorsource(),
        style: new style({
          image: new circlestyle({
            radius: 6,
            fill: new fill({ color: 'red' }),
            stroke: new stroke({ color: 'white', width: 2 }),
          }),
        }),
      });
      this.map.addlayer(this.pointlayer);
    },
    timerange() {
      fetch('http://localhost:4325/time-range')
        .then(response => response.json())
        .then(data => {
          const { mintime, maxtime } = data;
          console.log('time range:', mintime, maxtime);
          this.fetchdatainrange(mintime, maxtime);
        })
        .catch(error => console.error('error fetching time range:', error));
    },
    fetchdatainrange(starttime, endtime) {
      let currenttime = starttime;
      const timerid = setinterval(() => {
        if (currenttime >= endtime) {
          this.fetchdata(endtime);
          clearinterval(timerid); // stop the timer when currenttime >= endtime
          return;
        }
        this.fetchdata(currenttime);
        currenttime += 5; // increment currenttime
        //console.log('current time:', currenttime);
      }, 200);
    },
    fetchdata(currenttime) {
      // 获取地图视图
      const mapview = this.map.getview();
      // 获取地图视图的范围
      const extent = mapview.calculateextent(this.map.getsize());
      // 将范围转换为epsg:4326坐标系下的值
      const bbox = transformextent(extent, mapview.getprojection(), 'epsg:4326');
      promise.all([
        fetch(`http://localhost:4325/line-geometries?timestamp=${currenttime}&bbox=${bbox.join(',')}`).then(response => response.json()),
        fetch(`http://localhost:4325/points?timestamp=${currenttime}&bbox=${bbox.join(',')}`).then(response => response.json())
      ]).then(([linesdata, pointsdata]) => {
        this.linesdata = linesdata;
        this.pointsdata = pointsdata;
        this.processdata();
      }).catch(error => console.error('error fetching data:', error));
    },
    processdata() {
      const linesource = this.linelayer.getsource();
      const pointsource = this.pointlayer.getsource();
      const existinglinefeatureids = {};
      const existingpointfeatureids = {};
      // 处理线要素数据
      //console.log('this.linesdata', this.linesdata)
      this.linesdata.foreach(line => {
        const fid = line.fid;
        let feature = linesource.getfeaturebyid(fid);
        if (feature) {
          // 如果已存在具有相同 fid 的要素,则更新要素信息
          // 更新要素信息
          existinglinefeatureids[fid] = true;
        } else {
          // 否则创建新的要素并添加到图层中
          feature = new feature({
            // 设置要素信息
          });
          linesource.addfeature(feature);
          existinglinefeatureids[fid] = true;
        }
      });
      // 处理点要素数据
      this.pointsdata.foreach(point => {
        const fid = point.fid;
        let feature = pointsource.getfeaturebyid(fid);
        if (feature) {
          // 如果已存在具有相同 fid 的要素,则更新要素信息
          // 更新要素信息
          existingpointfeatureids[fid] = true;
        } else {
          // 否则创建新的要素并添加到图层中
          feature = new feature({
            // 设置要素信息
          });
          pointsource.addfeature(feature);
          existingpointfeatureids[fid] = true;
        }
      });
      // 移除地图上已存在但未在当前数据中出现的线要素
      linesource.getfeatures().foreach(feature => {
        const fid = feature.getid();
        if (!existinglinefeatureids[fid]) {
          linesource.removefeature(feature);
        }
      });
      // 移除地图上已存在但未在当前数据中出现的点要素
      pointsource.getfeatures().foreach(feature => {
        const fid = feature.getid();
        if (!existingpointfeatureids[fid]) {
          pointsource.removefeature(feature);
        }
      });
      // create a mapping of fid to points
      const pointsmap = {};
      this.pointsdata.foreach(point => {
        if (!pointsmap[point.fid]) {
          pointsmap[point.fid] = [];
        }
        pointsmap[point.fid].push(point);
      });
      // process lines and append points if they exist
      this.linesdata.foreach(line => {
        const format = new wkb();
        const feature = format.readfeature(line.line_geom, {
          dataprojection: 'epsg:4326',
          featureprojection: 'epsg:3857'
        });
        const geometry = feature.getgeometry();
        if (geometry.gettype() === 'linestring' && pointsmap[line.fid]) {
          const coordinates = geometry.getcoordinates();
          pointsmap[line.fid].foreach(point => {
            const coord = fromlonlat([point.interpolated_longitude, point.interpolated_latitude]);
            coordinates.push(coord);
          });
          geometry.setcoordinates(coordinates);
        }
        //feature.setid(line.fid);
        this.linelayer.getsource().addfeature(feature);
      });
      // log for debugging
      //console.log('processed lines:', this.linelayer.getsource().getfeatures());
      //console.log('processed points:', this.pointlayer.getsource().getfeatures());
      this.processpointlayer();
    },
    processpointlayer() {
      const templastpoint = {};
      const linefeatures = this.linelayer.getsource().getfeatures();
      linefeatures.foreach(linefeature => {
        const linegeometry = linefeature.getgeometry();
        const linecoordinates = linegeometry.getcoordinates();
        const numcoordinates = linecoordinates.length;
        //const fid = linefeature.getid();
        //console.log('fid', fid);
        if (numcoordinates === 1) {
          const defaultangle = 0;
          const lastpointcoords = linecoordinates[0];
          templastpoint[fid] = lastpointcoords;
          const pointfeature = new feature({
            geometry: new point(linecoordinates[0]),
          });
          //pointfeature.setid(fid);
          const iconstyle = this.createpointstyle(defaultangle);
          pointfeature.setstyle(iconstyle);
          this.pointlayer.getsource().addfeature(pointfeature);
        } else if (numcoordinates > 1) {
          const lastpointcoords = linecoordinates[numcoordinates - 1];
          //console.log('lastpointcoords', lastpointcoords);
          const penultimatepointcoords = linecoordinates[numcoordinates - 2];
          const dx = lastpointcoords[0] - penultimatepointcoords[0];
          const dy = lastpointcoords[1] - penultimatepointcoords[1];
          const angle = math.atan2(dy, dx);
          const pointfeature = new feature({
            geometry: new point(lastpointcoords),
          });
          //pointfeature.setid(fid);
          const iconstyle = this.createpointstyle(angle);
          pointfeature.setstyle(iconstyle);
          this.pointlayer.getsource().addfeature(pointfeature);
          //const templastpointcoords = this.lastpoint[fid];
          //console.log('templastpointcoords', templastpointcoords);
          //if (templastpointcoords) {
            //console.log('animate point', linefeature.getid(), this.lastpoint[linefeature.getid()], lastpointcoords);
            //this.animatepoint(pointfeature, templastpointcoords, lastpointcoords);
          //}
          //templastpoint[fid] = lastpointcoords;
        }
      });
      //this.lastpoint = templastpoint;
      //console.log('lastpoint', this.lastpoint);
      //console.log('templastpoint', templastpoint);
    },
    animatepoint(feature, startcoords, endcoords) {
      const duration = 800; // 动画持续时间,单位毫秒
      const start = performance.now();
    //console.log('startcoords', startcoords);
      const animate = (timestamp) => {
        const elapsed = timestamp - start;
        const progress = math.min(elapsed / duration, 1); // 进度百分比,范围从0到1
        // 线性插值计算当前位置
        const currentcoords = [
          startcoords[0] + (endcoords[0] - startcoords[0]) * progress,
          startcoords[1] + (endcoords[1] - startcoords[1]) * progress,
        ];
        feature.setgeometry(new point(currentcoords));
        if (progress < 1) {
          requestanimationframe(animate);
        }
      };
      requestanimationframe(animate);
    },
    createpointstyle(angle) {
      // 根据朝向创建点的样式
      return new style({
        image: new icon({
          src: require('@/assets/board.png'),
          scale: 0.1,
          rotation: -angle + (180 * math.pi / 180), // 设置点的朝向
          anchor: [0.5, 0.7], // 设置锚点位置
        }),
      });
    }
  },
};
</script>
<style scoped>
.map {
  width: 100%;
  height: 800px;
}
</style>
服务器代码如下:
1、数据库相关:
// database.js
const { client } = require('pg');
const axios = require('axios');
const fs = require('fs').promises;
const moment = require('moment-timezone');
// 配置数据库连接
const client = new client({
    user: 'postgres',
    host: 'loaclhost',
    database: 'postgres',
    password: 'root',
    port: 4321, // 默认postgresql端口
});
async function createtable() {
    const createtablequery = `
        create table if not exists track_board_test (
            fid bigint primary key,
            id varchar(255),
            name varchar(255),
            mmsi varchar(255),
            geom geometry(multipointm)
        );
        create index if not exists geom_index on track_board_test using gist (geom);
    `;
    try {
        await client.query(createtablequery);
        console.log('table created successfully');
    } catch (err) {
        console.error('error creating table:', err.stack);
    }
}
async function insertdatafromfile(filepath, ishttp) {
    try {
        let data;
        if (ishttp) {
            const response = await axios.get(filepath);
            data = response.data;
        } else {
            const rawdata = await fs.readfile(filepath);
            data = json.parse(rawdata);
        }
        for (const item of data.data) {
            const { id, mmsi, name, hisrecord } = item;
            let fid;
            if (id.startswith("radar")) {
                fid = parseint(id.substring("radar".length));
            } else {
                fid = parseint(id);
            }
            const points = hisrecord.map(record => {
                const utctime = moment.tz(record.updatetime, "asia/shanghai").utc().format('yyyy-mm-dd hh:mm:ss');
                return `st_setsrid(st_makepointm(${record.longitude}, ${record.latitude}, extract(epoch from timestamp '${utctime}')), 4326)`;
            }).join(', ');
            const geom = `st_collect(array[${points}])`;
            const query = `
                insert into track_board_test (id, name, mmsi, geom, fid)
                values ($1, $2, $3, ${geom}, $4)
                on conflict (fid) do update
                set id = excluded.id, name = excluded.name, mmsi = excluded.mmsi, geom = excluded.geom, fid = excluded.fid;
            `;
            await client.query(query, [id, name, mmsi, fid]);
        }
        console.log('数据插入成功');
    } catch (err) {
        console.error('插入数据时发生错误:', err);
    }
}
async function insertrandomdata() {
    const insertrandomdataquery = `
    do $$
    declare
        i int;
    begin
        for i in 10010000..10015000 loop
            execute format(
                'insert into track_board_test (id, geom, fid)
                values (%l,
                    (select st_collect(
                        array(
                            with recursive points as (
                                select
                                    random() * 360 - 180 as lon,
                                    random() * 180 - 90 as lat,
                                    cast(1716186468 + random() * 1000 as int) as m,
                                    1 as iteration,
                                    ceil(random() * 99 + 1) as max_iterations -- 随机生成1到100之间的点数
                                union all
                                select
                                    lon + (0.01 + random() * 0.09) * (case when random() < 0.5 then 1 else -1 end) as lon,
                                    lat + (0.01 + random() * 0.09) * (case when random() < 0.5 then 1 else -1 end) as lat,
                                    cast(m + random() * 400 as int) as m,
                                    iteration + 1,
                                    max_iterations
                                from points
                                where iteration < max_iterations
                            )
                            select st_setsrid(st_makepointm(lon, lat, m), 4326)
                            from points
                        )
                    )),
                    %l
                )
                on conflict (fid) do nothing',
                'radar_' || i,
                i
            );
        end loop;
    end $$;
    `;
    try {
        await client.query(insertrandomdataquery);
        console.log('random data insert successfully');
    } catch (err) {
        console.error('error inserting random data:', err.stack);
    }
}
async function getalldata() {
    try {
        const query = `
            select fid, id, name, mmsi, st_x(dp.geom) as lng, st_y(dp.geom) as lat, st_m(dp.geom) as time
            from track_board_test,
            lateral st_dumppoints(geom) as dp;
        `;
        const result = await client.query(query);
        return result.rows;
    } catch (err) {
        console.error('error fetching data:', err.stack);
        return [];
    }
}
async function gettimerange() {
    try {
        const query = `
            select
            max(max_time) as max_time,
            min(min_time) as min_time
        from (
            select
                (select max(st_m(dp.geom)) from lateral st_dumppoints(track_board_test.geom) as dp) as max_time,
                (select min(st_m(dp.geom)) from lateral st_dumppoints(track_board_test.geom) as dp) as min_time
            from
                track_board_test
        ) as subquery;
        `;
        const result = await client.query(query);
        const { max_time, min_time } = result.rows[0];
        return { mintime: min_time, maxtime: max_time };
    } catch (err) {
        console.error('error executing query', err.stack);
        throw err;
    }
}
async function getpointsbytimestamp(timestamp, bbox) {
    try {
        const query = `
        with extracted_points as (
            select
                tbt.fid,
                (dp).geom as point,
                st_m((dp).geom) as m_value
            from
                track_board_test tbt
                cross join lateral st_dumppoints(tbt.geom) as dp
            where
                st_intersects(tbt.geom, st_makeenvelope($1, $2, $3, $4, 4326)) -- add bbox filter
            order by fid
        ),
        min_max_times as (
            select
                fid,
                max(case when m_value <= $5 then m_value end) as min_time,
                min(case when m_value > $5 then m_value end) as max_time
            from
                extracted_points
            group by
                fid
        ),
        min_points as (
            select
                ep.fid,
                ep.m_value as min_time,
                ep.point as min_point
            from
                extracted_points ep
            join min_max_times mmt on ep.fid = mmt.fid and ep.m_value = mmt.min_time
        ),
        max_points as (
            select
                ep.fid,
                ep.m_value as max_time,
                ep.point as max_point
            from
                extracted_points ep
            join min_max_times mmt on ep.fid = mmt.fid and ep.m_value = mmt.max_time
        )
        select
            mmt.fid,
            st_x(st_lineinterpolatepoint(st_makeline(mp.min_point, mx.max_point), ($5 - mmt.min_time) / (mmt.max_time - mmt.min_time))) as interpolated_longitude,
            st_y(st_lineinterpolatepoint(st_makeline(mp.min_point, mx.max_point), ($5 - mmt.min_time) / (mmt.max_time - mmt.min_time))) as interpolated_latitude
        from
            min_max_times mmt
            join min_points mp on mmt.fid = mp.fid
            join max_points mx on mmt.fid = mx.fid;
        `;
        const result = await client.query(query, [...bbox, timestamp]);
        return result.rows;
    } catch (err) {
        console.error('error fetching interpolated points:', err.stack);
        return [];
    }
}
async function getlinegeometries(timestamp, bbox) {
    const query = `
        with extracted_points as (
            select
                fid,
                (st_dumppoints(geom)).geom as point
            from track_board_test
            where
                st_intersects(geom, st_makeenvelope($1, $2, $3, $4, 4326)) -- add bbox filter
        ),
        filtered_points as (
            select
                fid,
                point,
                st_m(point) as m_value
            from extracted_points
            where st_m(point) <= $5
        ),
        sorted_points as (
            select
                fid,
                point
            from filtered_points
            order by fid, m_value
        )
        select
            fid,
            st_makeline(point) as line_geom
        from sorted_points
        group by fid;
    `;
    const result = await client.query(query, [...bbox, timestamp]);
    return result.rows;
}
module.exports = {
    client,
    createtable,
    insertdatafromfile,
    insertrandomdata,
    getalldata,
    gettimerange,
    getpointsbytimestamp,
    getlinegeometries
};
http接口相关:
const express = require('express');
const cors = require('cors');
const {
    client,
    createtable,
    insertdatafromfile,
    insertrandomdata,
    getalldata,
    gettimerange,
    getpointsbytimestamp,
    getlinegeometries } = require('./database');
const app = express();
app.use(cors());
const port = 4325;
client.connect()
    .then(() => console.log('connected to the database'))
    .catch(err => console.error('connection error', err.stack));
createtable();
const filepath = './test.json'; // 替换为你的文件路径
insertdatafromfile(filepath, false);
insertrandomdata();
app.get('/all-data', async (req, res) => {
    try {
        const data = await getalldata();
        res.json(data);
    } catch (err) {
        res.status(500).json({ error: 'internal server error' });
    }
});
// 创建一个api端点
app.get('/time-range', async (req, res) => {
    try {
        const { mintime, maxtime } = await gettimerange();
        res.json({ mintime, maxtime });
    } catch (err) {
        console.error('error fetching time range:', err.stack);
        res.status(500).json({ error: 'internal server error' });
    }
});
app.get('/points', async (req, res) => {
    const timestamp = req.query.timestamp;
    const bbox = req.query.bbox.split(',').map(parsefloat); // 解析 bbox 参数为数组
    if (!timestamp) {
      return res.status(400).json({ error: 'timestamp is required' });
    }
    try {
        const points = await getpointsbytimestamp(timestamp, bbox); // 将 bbox 参数传递给函数
        res.json(points);
    } catch (err) {
        res.status(500).json({ error: 'internal server error' });
    }
});
app.get('/line-geometries', async (req, res) => {
    const timestamp = req.query.timestamp;
    const bbox = req.query.bbox.split(',').map(parsefloat); // 解析 bbox 参数为数组
    if (!timestamp) {
        return res.status(400).json({ error: 'timestamp is required' });
    }
    try {
        const linegeometries = await getlinegeometries(timestamp, bbox); // 将 bbox 参数传递给函数
        res.json(linegeometries);
    } catch (err) {
        console.error('error fetching line geometries:', err.stack);
        res.status(500).json({ error: 'internal server error' });
    }
});
// 启动服务器
app.listen(port, () => {
    console.log(`server is running on http://localhost:${port}`);
});
小结
当显示全球范围性能会有明显卡顿,可能需要改进算法。
到此这篇关于vue+openlayers+nodejs+postgis实现轨迹运动的文章就介绍到这了,更多相关vue轨迹运动内容请搜索代码网以前的文章或继续浏览下面的相关文章希望大家以后多多支持代码网!


发表评论