vue3 + element plus实现甘特图
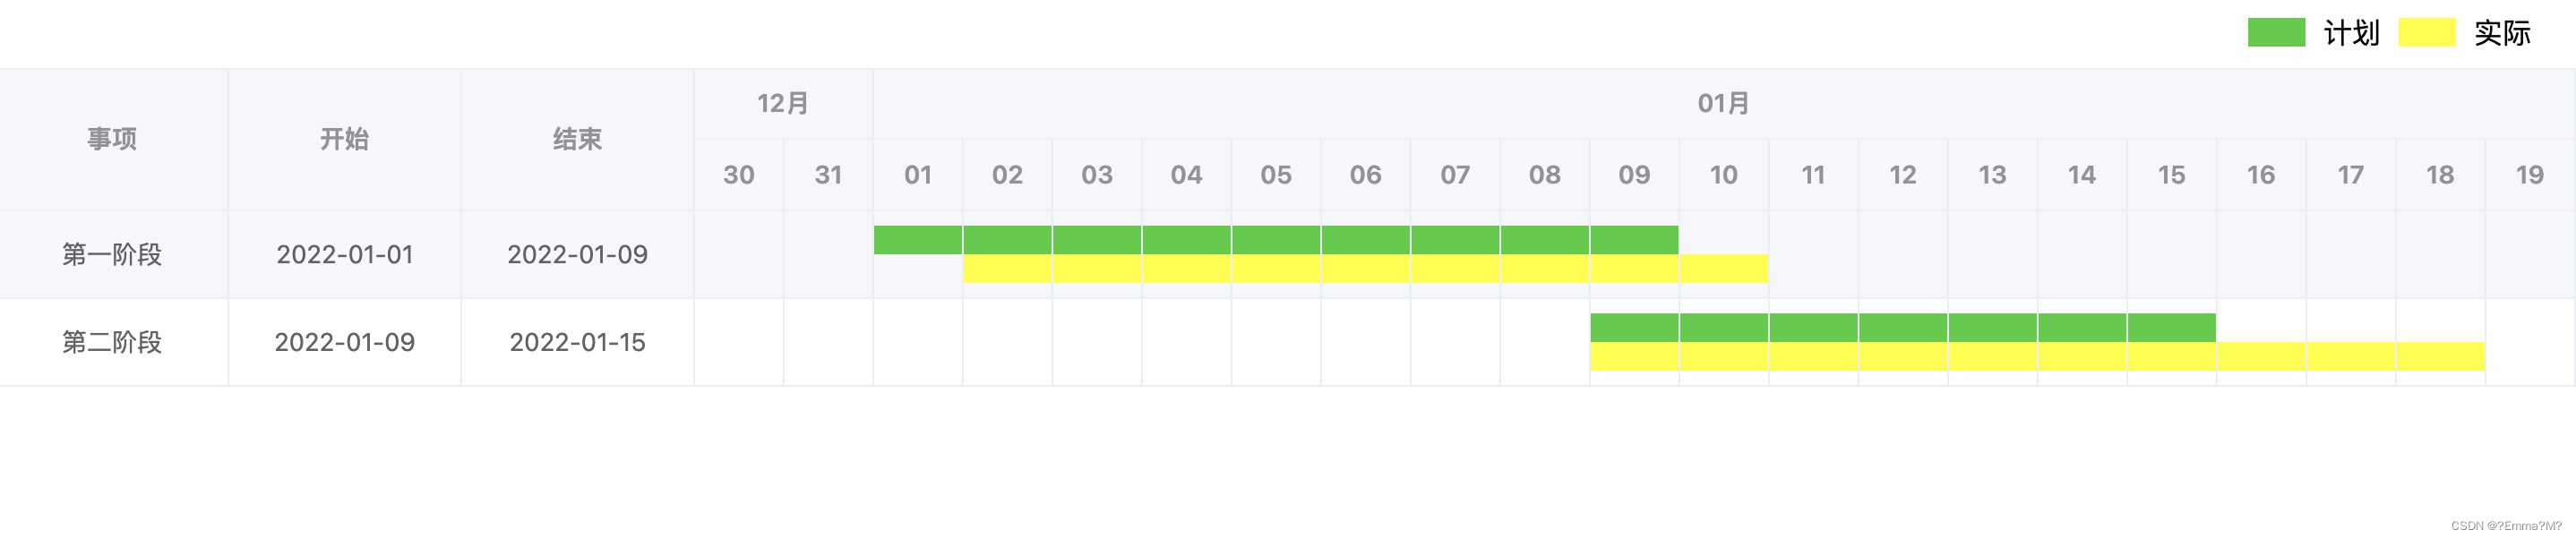
效果展示
实现思路
甘特图,个人理解就是表格的一种展现形式。左侧填充数据,右侧用图例填充表示时间、工期、进度等信息。
技术选型
常用的ui框架有很多,以前用vue2的时候多搭配element ui,最近在看vue3的内容,所以选择了element plus。所以本文示例使用vue3+element plus实现甘特图。看过原理之后改用其他技术方案也很简单。
代码实现
新建项目 vue3 + element plus
自己搜索吧,有很多,这里不是重点。
封装组件
这里说下为什么要封装成组件,因为项目里可能多处用到类似的功能,总不能每次都拷贝,然后修改。一次封装,多次引用。
上代码:我存放的路径 /src/components/gantt/index.vue
<template>
	<div class="gantt">
		<div class="legend">
			<!-- 渲染图例 -->
			<i class="plan"></i>
			<label>计划</label>
			<i class="actuality"></i>
			<label>实际</label>
		</div>
		<el-table :data="data">
			<!-- 渲染表格 -->
			<el-table-column
				v-for="(column, index) in columnsconfig"
				:key="index"
				v-bind="column"
			></el-table-column>
			<el-table-column
				v-for="monthitem in monthdata"
				:key="monthitem.month"
				align="center"
				min-width="80"
				:prop="monthitem.month"
				:label="monthitem.month"
			>
				<template #header>
					<span>{{ monthitem.month.substring(5) + '月' }}</span>
				</template>
				<el-table-column
					v-for="day in monthitem.dayarray"
					:key="day"
					align="center"
					:width="50"
					:prop="day"
				>
					<template #header>
						<span>{{ day.substring(8) }}</span>
					</template>
					<template #default="scope">
						<i class="plan" v-if="showplan(scope)"></i>
						<i class="empty" v-else></i>
						<i class="actuality" v-if="showactuality(scope)"></i>
						<i class="empty" v-else></i>
					</template>
				</el-table-column>
			</el-table-column>
		</el-table>
	</div>
</template>

<script setup>
import { ref } from 'vue';

const props = defineprops({
	data: {
		type: array,
		default: []
	},
	columnsconfig: {
		type: array,
		default: []
	},
	ganttconfig: {
		type: object,
		default: {
			planbegincolumn: 'planbegin',
			planendcolumn: 'planend',
			actualitybegincolumn: 'actualitybegin',
			actualityendcolumn: 'actualityend'
		}
	}
})

const monthdata = ref({})

const init = () => {
	let mindate = undefined
	let maxdate = undefined

	props.data.foreach((row, index) => {
		let current = new date(row[props.ganttconfig.planbegincolumn])
		if (mindate) {
			mindate = mindate.gettime() < current.gettime() ? mindate : current
		} else {
			mindate = current
		}
		current = new date(row[props.ganttconfig.planendcolumn])
		if (maxdate) {
			maxdate = maxdate.gettime() > current.gettime() ? maxdate : current
		} else {
			maxdate = current
		}
		current = props.ganttconfig.actualitybegincolumn || row[props.ganttconfig.actualitybegincolumn] ? new date(row[props.ganttconfig.actualitybegincolumn]) : undefined
		if (current) {
			mindate = mindate.gettime() < current.gettime() ? mindate : current
		}
		current = props.ganttconfig.actualityendcolumn || row[props.ganttconfig.actualityendcolumn] ? new date(row[props.ganttconfig.actualityendcolumn]) : undefined
		if (current) {
			maxdate = maxdate.gettime() > current.gettime() ? maxdate : current
		}
	})

	// 甘特图前后各放宽2天
	mindate = new date(mindate.gettime() - 2 * 24 * 60 * 60 * 1000)
	maxdate = new date(maxdate.gettime() + 2 * 24 * 60 * 60 * 1000)
	let current = new date(format(mindate))
	while(!isafter(current, maxdate)) {
		const month = formatyearmonth(current)
		const day = format(current)
		if (monthdata.value[month]) {
			monthdata.value[month].dayarray.push(day)
		} else {
			monthdata.value[month] = {
				month: month,
				dayarray: [day]
			}
		}
		// 加一天
		current = after(current)
	}
}
/**
 * 格式化 yyyy-mm-dd
 */
const format = (date) => {
	const day = string(date.getdate()).padstart(2, '0')
	return formatyearmonth(date) + '-' + day
}
/**
 * 格式化 yyyy-mm
 */
const formatyearmonth = (date) => {
	const year = date.getfullyear()
	const month = string(date.getmonth() + 1).padstart(2, '0')
	return year + '-' + month
}
/**
 * 加一天
 */
const after = (date) => {
	return new date(date.gettime() + 24 * 60 * 60 * 1000)
}
/**
 * date1是否大于等于date2
 */
const isafter = (date1, date2) => {
	return date1.gettime() >= date2.gettime()
}
/**
 * 显示计划进度
 */
const showplan = ({row, column}) => {
	const currentday = new date(column.property)
	const begin = new date(row[props.ganttconfig.planbegincolumn])
	const end = new date(row[props.ganttconfig.planendcolumn])
	return currentday.gettime() >= begin.gettime() && currentday.gettime() <= end.gettime()
}
/**
 * 显示实际进度
 */
const showactuality = ({row, column}) => {
	const currentday = new date(column.property)
	const begin = props.ganttconfig.actualitybegincolumn || row[props.ganttconfig.actualitybegincolumn] ? new date(row[props.ganttconfig.actualitybegincolumn]) : undefined
	const end = props.ganttconfig.actualityendcolumn || row[props.ganttconfig.actualityendcolumn] ? new date(row[props.ganttconfig.actualityendcolumn]) : undefined
	return begin && end && currentday.gettime() >= begin.gettime() && currentday.gettime() <= end.gettime()
}
init()
</script>

<style scoped>
	.plan {
		display: flex;
		width: calc(100% + 24px);
		height: 16px;
		background-color: limegreen;
		margin: 0 -12px;
	}
	.actuality {
		display: flex;
		width: calc(100% + 24px);
		height: 16px;
		background-color: yellow;
		margin: 0 -12px;
	}
	.empty {
		display: flex;
		width: calc(100% + 24px);
		height: 16px;
		margin: 0 -12px;
	}
	.legend {
		display: flex;
		line-height: 40px;
		flex-direction: row;
		justify-content: right;
		align-items: center;
		padding: 0 20px;

		* {
			margin: 0 5px;
		}

		i {
			width: 32px;
			height: 16px;
		}
	}
</style>
引用组件
app.vue中引用上面的组件
<script setup>
	import gantt from '@/components/gantt/index.vue'
	const data = ref([
		{
			title: '第一阶段',
			planbegin: '2022-01-01',
			planend: '2022-01-09',
			actualitybegin: '2022-01-02',
			actualityend: '2022-01-10'
		},
		{
			title: '第二阶段',
			planbegin: '2022-01-09',
			planend: '2022-01-15',
			actualitybegin: '2022-01-09',
			actualityend: '2022-01-18'
		}
	])
	const columnsconfig = ref([
		{
			label: '事项',
			prop: 'title',
			fixed: 'left',
			align: 'center',
			'min-width': 120
		},
		{
			label: '开始',
			prop: 'planbegin',
			fixed: 'left',
			align: 'center',
			'min-width': 120
		},
		{
			label: '结束',
			prop: 'planend',
			fixed: 'left',
			align: 'center',
			'min-width': 120
		}
	])
</script>

<template>
	<div>
		<gantt
			:data="data"
			:columnsconfig="columnsconfig"
			:ganttconfig ="{
				planbegincolumn: 'planbegin',
				planendcolumn: 'planend',
				actualitybegincolumn: 'actualitybegin',
				actualityendcolumn: 'actualityend'
			}"
		/>
	</div>
</template>

<style scoped>
</style>
到此这篇关于基于vue3和element plus实现甘特图的文章就介绍到这了,更多相关vue3 element plus甘特图内容请搜索代码网以前的文章或继续浏览下面的相关文章希望大家以后多多支持代码网!


发表评论