需求:查询一个月的数据,但是有些数据为0,后端没传,所以要前端进行操作,把没传的数据进行补0填充达到月数据完整效果
1.错误展示
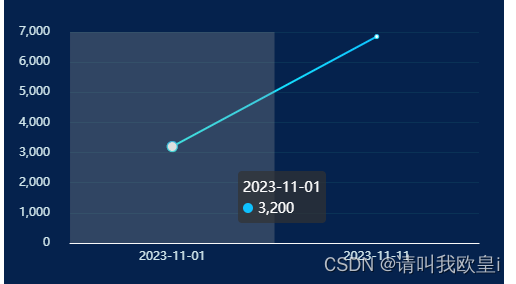
如果这个月为0的数据后端没传,那么图片不能展示这个月所有的数据,会导致折线图不直观
  // 模拟后端数据
            let result = [
                {
                    date: '2023-11-01',
                    value: 3200
                },
                {
                    date: '2023-11-11',
                    value: 6850
                }
            ];
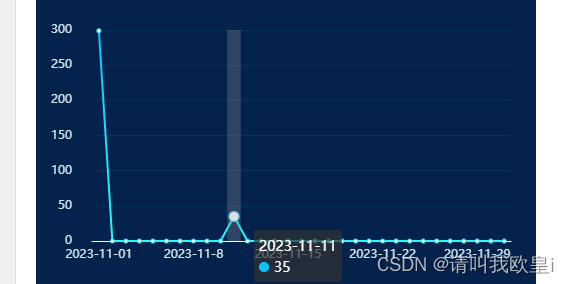
2.正确效果
3.代码讲解
3.1思路
默认请求后端接口肯定是当月的数据,当月的格式应该为2024-03按照年和月去请求
    var date = new date();
    const year = date.getfullyear();
    const month = date.getmonth() + 1;
    this.monthflow = `${year}-${month}`;
获取到当月的天数,如果想获取其他月的天数可以通过var today = new date('2023-12');
            // 得到这个月的总天数
            var lastday = new date(year, month + 1, 0).getdate();
            console.log(lastday, '当月的天数');
之后通过linq插件实现,下载并且在页面导入
//下载
npm install linq
//导入
import linq from "linq";
通过for循环当月的天数,之后判断2024-01-23,中的23是不是等于当天,如果等于就把数据填充,如果不等于也就是这天没有数据,那么就自动补0,最后通过sendmonthoption变量接收数据,这个日期当日可以是动态的,根据实际数据进行更改
    for (var i = 1; i <= lastday; i++) {
                //  new date(x.date).getdate()获取到数据的日期,如果为01,则为1,并且是数字类型
                let count = linq.from(result)
                    .where((x) => new date(x.date).getdate() == i)
                    .toarray();
                if (count.length > 0) {
                    this.sendmonthoption.xaxis.push(count[0].date);
                    this.sendmonthoption.seriesdata.push(count[0].value);
                } else {
                    this.sendmonthoption.xaxis.push(`2023-11-${i}`);
                    this.sendmonthoption.seriesdata.push(0);
                }
            }
4.完整代码
<template>
    <div id="month" ref="bin" style="width: 500px; height: 300px; margin-top: 0.125rem"></div>
</template>
<script>
import * as echarts from 'echarts';
import linq from 'linq';
export default {
    data() {
        return {
            sendmonthoption: {
                xaxis: [],
                seriesdata: []
            }
        };
    },
    mounted() {
        this.play_echarts();
    },
    methods: {
        play_echarts() {
            // 假如是当月的数据查询
            var today = new date();
            // 获取到年月
            var year = today.getfullyear();
            var month = today.getmonth();
            // 得到这个月的总天数
            var lastday = new date(year, month + 1, 0).getdate();
            console.log(lastday, '当月的天数');
            // 模拟后端数据
            let result = [
                {
                    date: '2023-11-01',
                    value: 299
                },
                {
                    date: '2023-11-11',
                    value: 35
                }
            ];
            for (var i = 1; i <= lastday; i++) {
                //  new date(x.date).getdate()获取到数据的日期,如果为01,则为1,并且是数字类型
                let count = linq.from(result)
                    .where((x) => new date(x.date).getdate() == i)
                    .toarray();
                if (count.length > 0) {
                    this.sendmonthoption.xaxis.push(count[0].date);
                    this.sendmonthoption.seriesdata.push(count[0].value);
                } else {
                    this.sendmonthoption.xaxis.push(`2023-11-${i}`);
                    this.sendmonthoption.seriesdata.push(0);
                }
            }
            var piechart = echarts.init(this.$refs.bin);
            var option = {
                backgroundcolor: '#05224d',
                tooltip: {
                    trigger: 'axis',
                    axispointer: {
                        type: 'shadow'
                    }
                },
                grid: {
                    top: '15%',
                    left: '3%',
                    right: '5%',
                    bottom: '8%',
                    containlabel: true
                },
                // 内置区域缩放
                //数据过多避免重叠
                xaxis: [
                    {
                        type: 'category',
                        boundarygap: true,
                        axisline: {
                            //坐标轴轴线相关设置。数学上的x轴
                            show: true,
                            linestyle: {
                                color: '#f9f9f9'
                            }
                        },
                        axislabel: {
                            //坐标轴刻度标签的相关设置
                            color: '#d1e6eb'
                            //   margin: 15,
                        },
                        axistick: {
                            show: false
                        },
                        data: this.sendmonthoption.xaxis
                    }
                ],
                datazoom: [
                    {
                        type: 'inside' // 使用滑动条型的 datazoom
                    }
                ],
                yaxis: [
                    {
                        type: 'value',
                        min: 0,
                        // max: 140,
                        splitnumber: 7,
                        splitline: {
                            show: true,
                            linestyle: {
                                color: '#0a3256'
                            }
                        },
                        axisline: {
                            show: false
                        },
                        axislabel: {
                            margin: 20,
                            color: '#d1e6eb'
                        },
                        axistick: {
                            show: false
                        }
                    }
                ],
                series: [
                    {
                        type: 'line',
                        itemstyle: {
                            color: new echarts.graphic.lineargradient(0, 0, 0, 1, [
                                {
                                    offset: 0,
                                    color: '#0ec1ff'
                                },
                                {
                                    offset: 1,
                                    color: '#1cfffb'
                                }
                            ])
                        },
                        data: this.sendmonthoption.seriesdata
                    }
                ]
            };
            // 使用刚指定的配置项和数据显示图表。true是为了实时更新数据
            piechart.setoption(option, true);
            window.addeventlistener('resize', function () {
                piechart.resize();
            });
            //   piechart.on(
            //     "touchmove",
            //     function (e) {
            //       e.preventdefault();
            //     },
            //     { passive: false }
            //   );
        }
    }
};
</script>
<style lang="scss" scoped></style>
到此这篇关于echarts折线图月份数据不足自动补0和日期达到数据连续的效果的文章就介绍到这了,更多相关echarts折线图月份内容请搜索代码网以前的文章或继续浏览下面的相关文章希望大家以后多多支持代码网!


发表评论