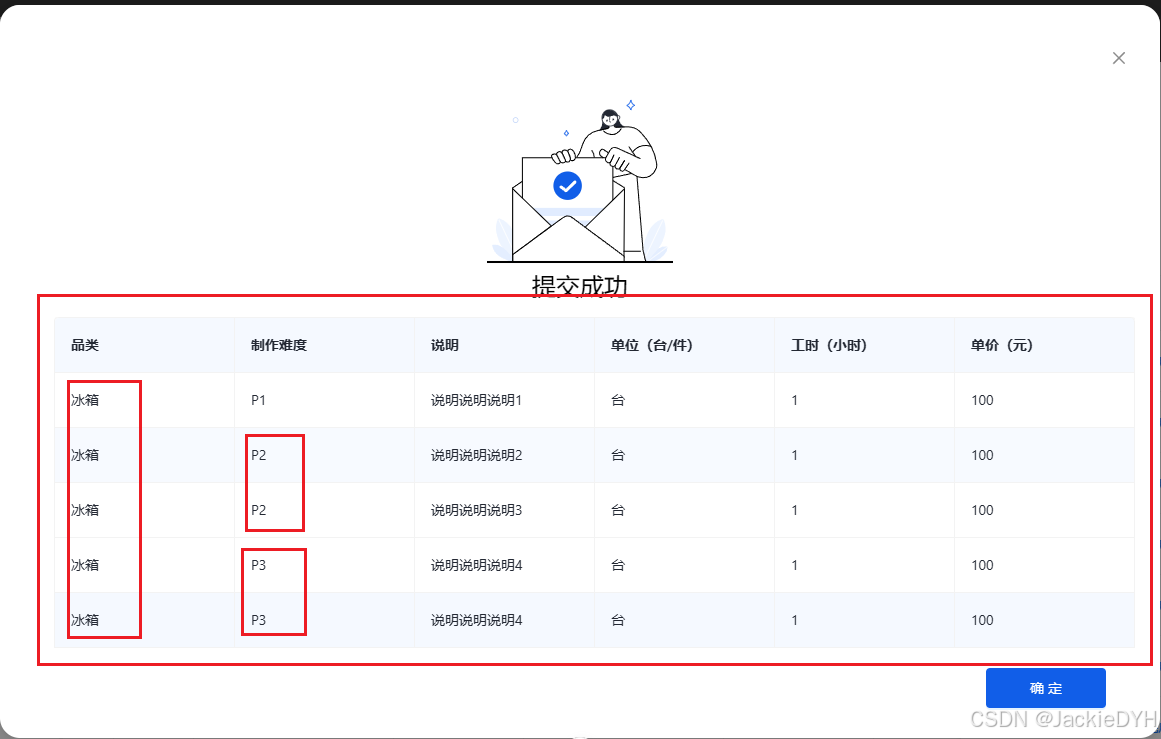
原数据
根据需求实现当前两列数据中有相同数据时,合并列单元格
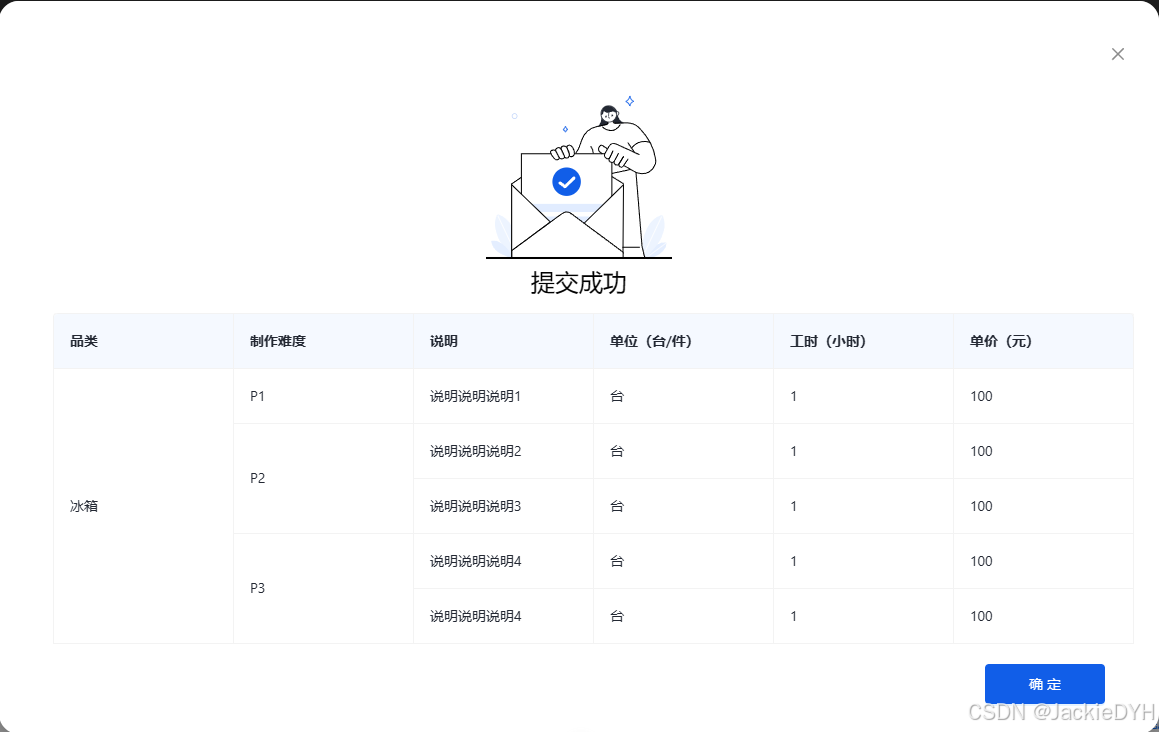
实现
源码
数据
const datasource = ref([
  {
    id: 1,
    pl: "冰箱",
    zznd: "p1",
    sm: "说明说明说明1",
    dw: "台",
    gs: "1",
    dj: "100"
  },
  {
    id: 1,
    pl: "冰箱",
    zznd: "p2",
    sm: "说明说明说明2",
    dw: "台",
    gs: "1",
    dj: "100"
  },
  {
    id: 1,
    pl: "冰箱",
    zznd: "p2",
    sm: "说明说明说明3",
    dw: "台",
    gs: "1",
    dj: "100"
  },
  {
    id: 1,
    pl: "冰箱",
    zznd: "p3",
    sm: "说明说明说明4",
    dw: "台",
    gs: "1",
    dj: "100"
  },
  {
    id: 1,
    pl: "冰箱",
    zznd: "p3",
    sm: "说明说明说明4",
    dw: "台",
    gs: "1",
    dj: "100"
  }
])
处理函数
const calculaterowspan = (data, index, key) => {
  if (index === 0 || data[index][key] !== data[index - 1][key]) {
    let rowspan = 1
    for (let i = index + 1; i < data.length; i++) {
      if (data[i][key] === data[index][key]) {
        rowspan++
      } else {
        break
      }
    }
    return rowspan
  }
  return 0
}
全部源码
<template>
  <a-modal
    title=" "
    :footer="null"
    width="1160px"
    wrap-class-name="price-modal-wrap"
    :open="open"
    @update:open="submit"
    centered
    destroy-on-close>
    <!-- @update:open="(v: boolean) => emit('update:open', v)" -->
    <div class="px-[54px] pb-[30px] pt-3">
      <div class="flex flex-col items-center">
        <img src="@/assets/images/steptemp/success.svg" alt="" />
        <span class="text-[#000] text-[24px] font-medium mb-[12px]">提交成功</span>
      </div>
      <a-table bordered :loading="loading" :columns="columns" :data-source="datasource" :pagination="false">
        <template #bodycell="{ text, column, record, index }">
          <template v-if="!['demandid', 'createtime', 'operator'].includes(string(column.dataindex))">
            <a-tooltip placement="topleft" :title="text">
              {{ text }}
            </a-tooltip>
          </template>
        </template>
      </a-table>
      <div class="text-right pt-5">
        <a-button type="primary" class="w-[120px]" @click="submit">确定</a-button>
      </div>
    </div>
  </a-modal>
</template>
<script setup lang="ts">
const props = defineprops<{
  open: boolean
  flag?: string
}>()
const emit = defineemits(["update:open", "goback"])
const submit = () => {
  if (props.flag === "table") {
    emit("update:open", false)
    return
  }
  emit("goback")
}
const datasource = ref([
  {
    id: 1,
    pl: "冰箱",
    zznd: "p1",
    sm: "说明说明说明1",
    dw: "台",
    gs: "1",
    dj: "100"
  },
  {
    id: 1,
    pl: "冰箱",
    zznd: "p2",
    sm: "说明说明说明2",
    dw: "台",
    gs: "1",
    dj: "100"
  },
  {
    id: 1,
    pl: "冰箱",
    zznd: "p2",
    sm: "说明说明说明3",
    dw: "台",
    gs: "1",
    dj: "100"
  },
  {
    id: 1,
    pl: "冰箱",
    zznd: "p3",
    sm: "说明说明说明4",
    dw: "台",
    gs: "1",
    dj: "100"
  },
  {
    id: 1,
    pl: "冰箱",
    zznd: "p3",
    sm: "说明说明说明4",
    dw: "台",
    gs: "1",
    dj: "100"
  }
])
const loading = ref(false)
const calculaterowspan = (data, index, key) => {
  if (index === 0 || data[index][key] !== data[index - 1][key]) {
    let rowspan = 1
    for (let i = index + 1; i < data.length; i++) {
      if (data[i][key] === data[index][key]) {
        rowspan++
      } else {
        break
      }
    }
    return rowspan
  }
  return 0
}
const columns = [
  {
    title: "品类",
    dataindex: "pl",
    width: 180,
    customcell: (_, index) => {
      const rowspan = calculaterowspan(datasource.value, index, "pl")
      return {
        rowspan
      }
    }
  },
  {
    title: "制作难度",
    dataindex: "zznd",
    ellipsis: true,
    width: 180,
    customcell: (_, index) => {
      const rowspan = calculaterowspan(datasource.value, index, "zznd")
      return {
        rowspan
      }
    }
  },
  {
    title: "说明",
    dataindex: "sm",
    width: 180
  },
  {
    title: "单位(台/件)",
    dataindex: "dw",
    width: 180
  },
  {
    title: "工时(小时)",
    dataindex: "gs",
    width: 180
  },
  {
    title: "单价(元)",
    dataindex: "dj",
    width: 180
  }
  // {
  //   title: "操作",
  //   dataindex: "operator",
  //   width: 140
  // }
]
</script>
<style lang="scss">
.price-modal-wrap {
  .ant-modal-content {
    @apply rounded-[20px] overflow-hidden;
  }
  .ant-modal-header {
    @apply rounded-[20px_20px_0_0] py-10 px-[30px] border-none;
  }
  .ant-modal-title {
    @apply text-[20px] font-medium leading-[22px];
  }
  .ant-modal-body {
    padding: 0;
  }
  .ant-modal-close {
    @apply right-[30px] top-[42px];
  }
}
</style>
到此这篇关于vue中使用antd中a-table实现表格数据列合并展示的文章就介绍到这了,更多相关vue antd内容请搜索代码网以前的文章或继续浏览下面的相关文章希望大家以后多多支持代码网!


发表评论