springcloud之熔断监控hystrixdashboard和turbine
hystrix-dashboard是一款针对hystrix进行实时监控的工具,通过hystrix dashboard我们可以在直观地看到各
hystrix command的请求响应时间, 请求成功率等数据。但是只使用hystrix dashboard的话, 你只能看到单个应
用内的服务信息,这明显不够。我们需要一个工具能让我们汇总系统内多个服务的数据并显示到hystrix
dashboard上,这个工具就是turbine。
1、hystrix dashboard
我们在熔断示例项目的基础上更改。
1.1 添加依赖
<?xml version="1.0" encoding="utf-8"?>
<project xmlns="http://maven.apache.org/pom/4.0.0" xmlns:xsi="http://www.w3.org/2001/xmlschema-instance"
         xsi:schemalocation="http://maven.apache.org/pom/4.0.0 https://maven.apache.org/xsd/maven-4.0.0.xsd">
    <modelversion>4.0.0</modelversion>
    <parent>
        <groupid>org.springframework.boot</groupid>
        <artifactid>spring-boot-starter-parent</artifactid>
        <version>1.5.3.release</version>
        <relativepath/>
    </parent>
    <groupid>com.example</groupid>
    <artifactid>spring-cloud-consumer-hystrix-dashboard</artifactid>
    <version>0.0.1-snapshot</version>
    <name>spring-cloud-consumer-hystrix-dashboard</name>
    <description>spring-cloud-consumer-hystrix-dashboard</description>
    <properties>
        <project.build.sourceencoding>utf-8</project.build.sourceencoding>
        <project.reporting.outputencoding>utf-8</project.reporting.outputencoding>
        <java.version>1.8</java.version>
        <spring-cloud.version>dalston.release</spring-cloud.version>
    </properties>
    <dependencies>
        <dependency>
            <groupid>org.springframework.cloud</groupid>
            <artifactid>spring-cloud-starter-feign</artifactid>
        </dependency>
        <dependency>
            <groupid>org.springframework.cloud</groupid>
            <artifactid>spring-cloud-starter-eureka</artifactid>
        </dependency>
        <dependency>
            <groupid>org.springframework.boot</groupid>
            <artifactid>spring-boot-starter-web</artifactid>
        </dependency>
        <dependency>
            <groupid>org.springframework.cloud</groupid>
            <artifactid>spring-cloud-starter-hystrix</artifactid>
        </dependency>
        <dependency>
            <groupid>org.springframework.cloud</groupid>
            <artifactid>spring-cloud-starter-hystrix-dashboard</artifactid>
        </dependency>
        <dependency>
            <groupid>org.springframework.boot</groupid>
            <artifactid>spring-boot-starter-actuator</artifactid>
        </dependency>
        <dependency>
            <groupid>org.springframework.boot</groupid>
            <artifactid>spring-boot-starter-test</artifactid>
            <scope>test</scope>
        </dependency>
    </dependencies>
    <dependencymanagement>
        <dependencies>
            <dependency>
                <groupid>org.springframework.cloud</groupid>
                <artifactid>spring-cloud-dependencies</artifactid>
                <version>${spring-cloud.version}</version>
                <type>pom</type>
                <scope>import</scope>
            </dependency>
        </dependencies>
    </dependencymanagement>
    <build>
        <plugins>
            <plugin>
                <groupid>org.springframework.boot</groupid>
                <artifactid>spring-boot-maven-plugin</artifactid>
            </plugin>
        </plugins>
    </build>
</project>
1.2 启动类
启动类添加启用hystrix dashboard和熔断器
package com.example;
import org.springframework.boot.springapplication;
import org.springframework.boot.autoconfigure.springbootapplication;
import org.springframework.cloud.client.circuitbreaker.enablecircuitbreaker;
import org.springframework.cloud.client.discovery.enablediscoveryclient;
import org.springframework.cloud.netflix.feign.enablefeignclients;
import org.springframework.cloud.netflix.hystrix.dashboard.enablehystrixdashboard;
@springbootapplication
@enablediscoveryclient
@enablefeignclients
@enablehystrixdashboard
@enablecircuitbreaker
public class springcloudconsumerhystrixdashboardapplication {
    public static void main(string[] args) {
        springapplication.run(springcloudconsumerhystrixdashboardapplication.class, args);
    }
}
1.3 其它类
package com.example.remote;
import org.springframework.cloud.netflix.feign.feignclient;
import org.springframework.web.bind.annotation.requestmapping;
import org.springframework.web.bind.annotation.requestparam;
@feignclient(name= "spring-cloud-producer", fallback = helloremotehystrix.class)
public interface helloremote {
    @requestmapping(value = "/hello")
    public string hello(@requestparam(value = "name") string name);
}
package com.example.remote;
import org.springframework.stereotype.component;
import org.springframework.web.bind.annotation.requestparam;
@component
public class helloremotehystrix implements helloremote{
@override
public string hello(@requestparam(value = "name") string name) {
return "hello " +name+", this messge send failed ";
}
}package com.example.controller;
import com.example.remote.helloremote;
import org.springframework.beans.factory.annotation.autowired;
import org.springframework.web.bind.annotation.pathvariable;
import org.springframework.web.bind.annotation.requestmapping;
import org.springframework.web.bind.annotation.restcontroller;
@restcontroller
public class consumercontroller {
@autowired
helloremote helloremote;
@requestmapping("/hello/{name}")
public string index(@pathvariable("name") string name) {
return helloremote.hello(name);
}
}spring.application.name=spring-cloud-consumer-hystrix-dashboard server.port=9003 feign.hystrix.enabled=true eureka.client.serviceurl.defaultzone=http://localhost:8000/eureka/
1.4 测试
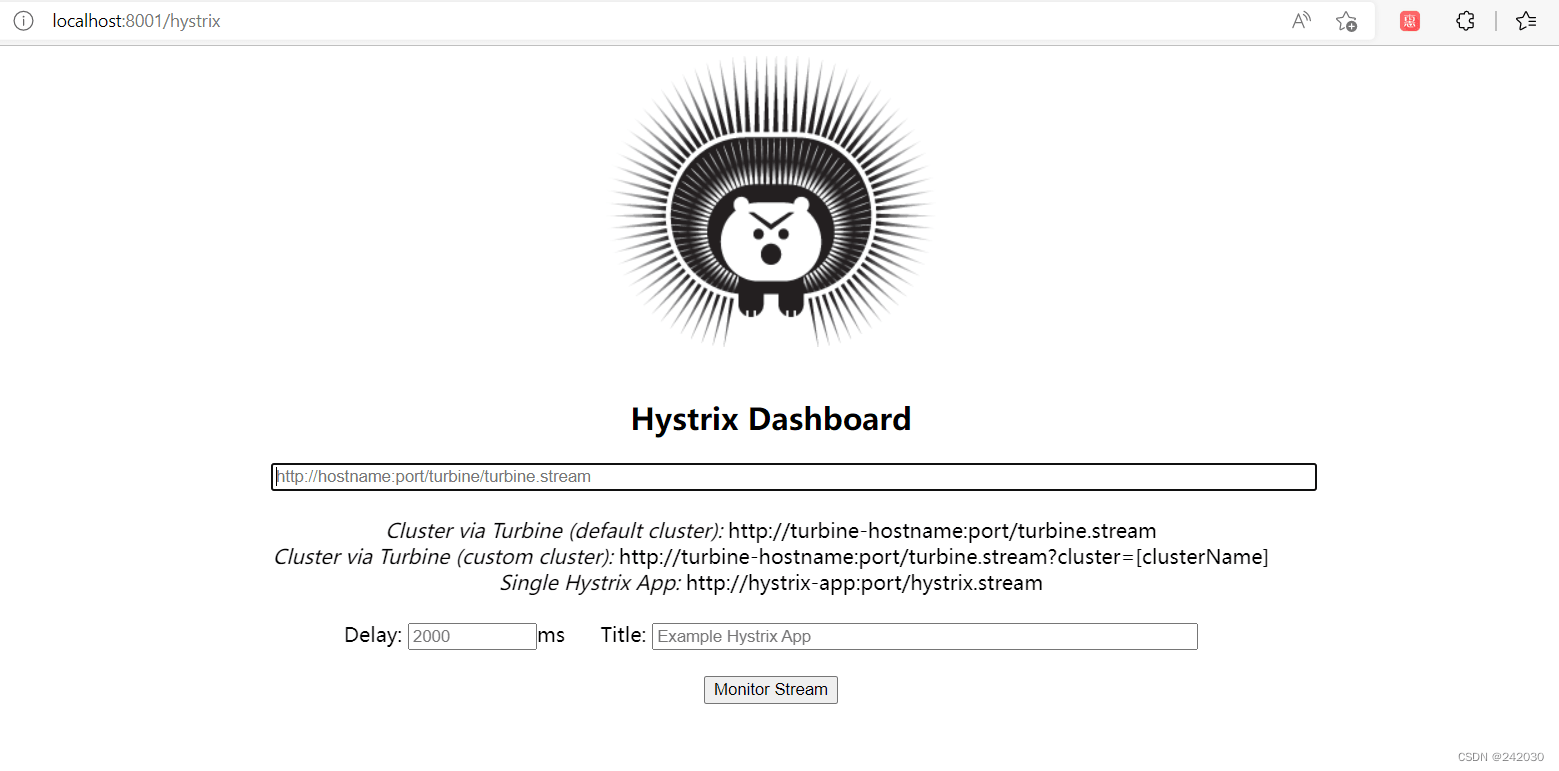
启动工程后访问 http://localhost:9003/hystrix,将会看到如下界面:
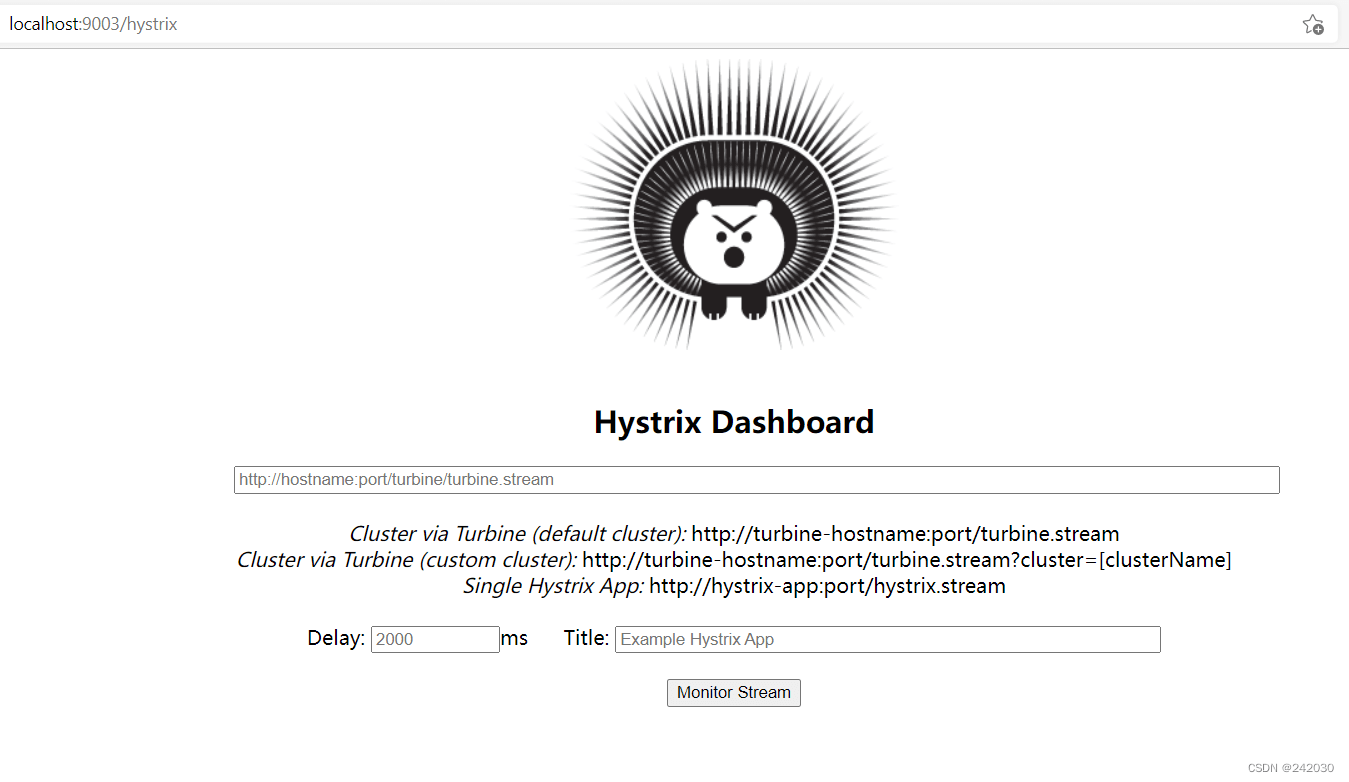
图中会有一些提示:
cluster via turbine (default cluster):
http://turbine-hostname:port/turbine.streamcluster via turbine (custom cluster):
http://turbine-hostname:port/turbine.stream?cluster=[clustername]single hystrix app:
http://hystrix-app:port/hystrix.stream
大概意思就是如果查看默认集群使用第一个url,查看指定集群使用第二个url,单个应用的监控使用最后一个,我
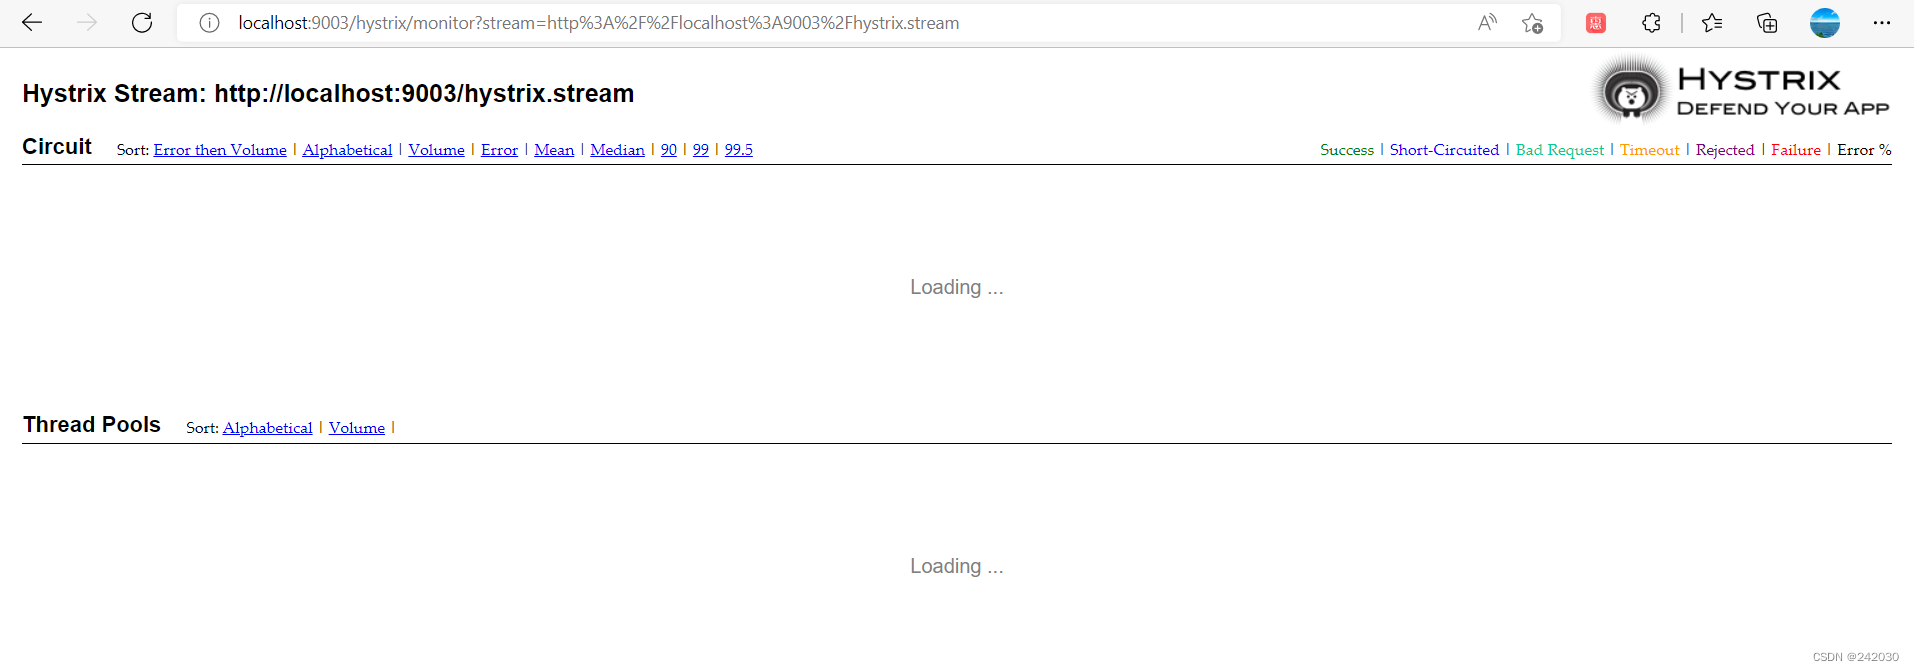
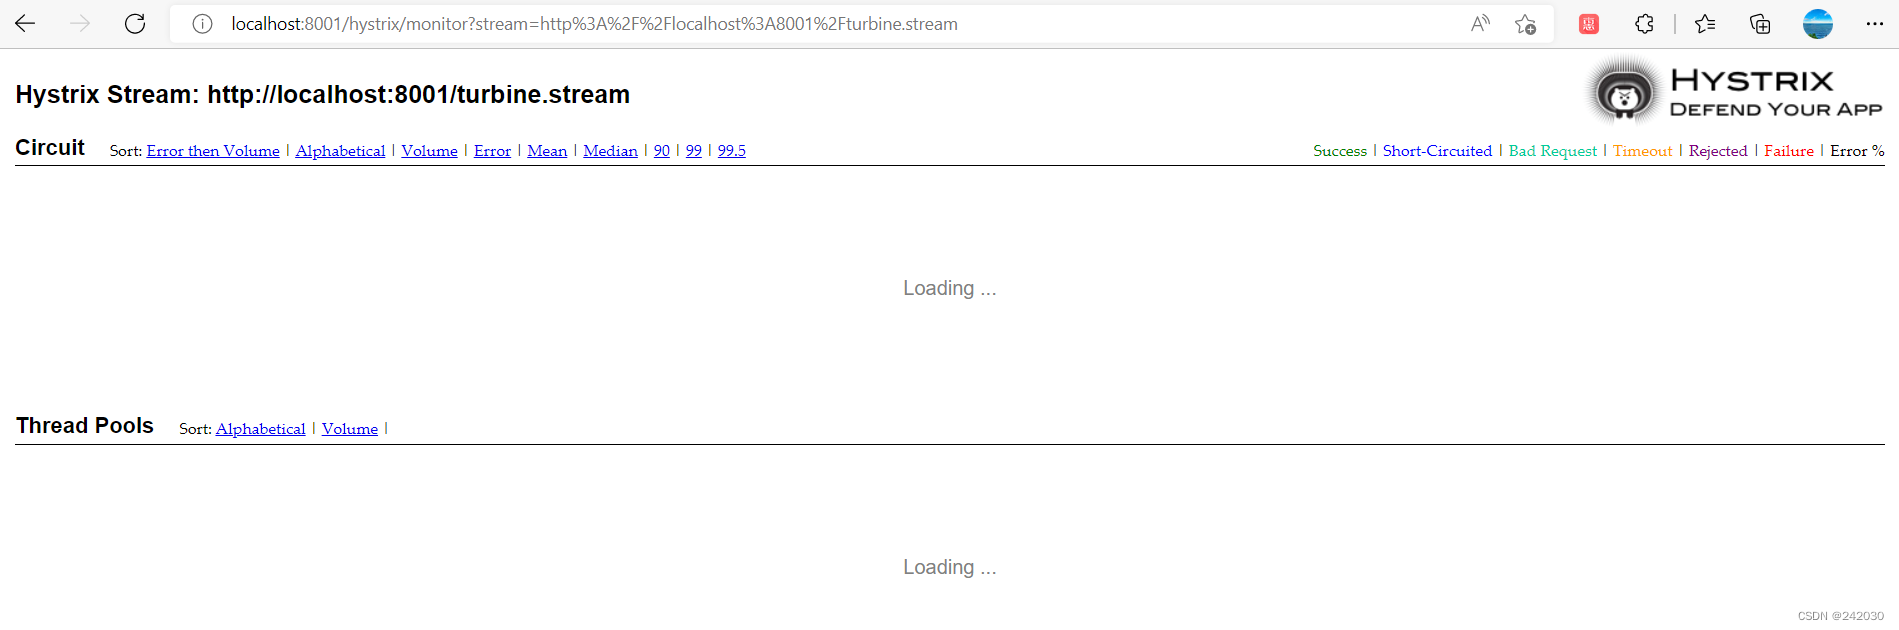
们暂时只演示单个应用的所以在输入框中输入: http://localhost:9003/hystrix.stream ,输入之后点击
monitor,进入页面。如果没有请求会先显示loading ...:
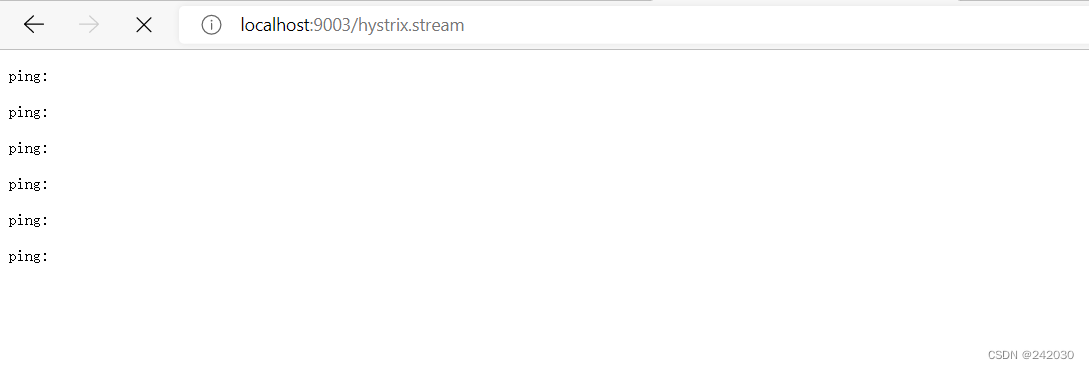
访问 http://localhost:9003/hystrix.stream 也会不断的显示ping。
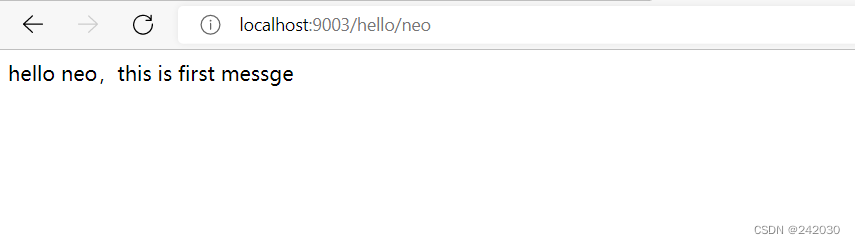
请求服务 http://localhost:9003/hello/neo,就可以看到监控的效果了:
首先访问 http://localhost:9003/hystrix.stream,显示如下:
data: {"type":"hystrixcommand","name":"helloremote#hello(string)","group":"spring-cloud-producer","currenttime":1662554090588,"iscircuitbreakeropen":false,"errorpercentage":0,"errorcount":0,"requestcount":0,"rollingcountbadrequests":0,"rollingcountcollapsedrequests":0,"rollingcountemit":0,"rollingcountexceptionsthrown":0,"rollingcountfailure":0,"rollingcountfallbackemit":0,"rollingcountfallbackfailure":0,"rollingcountfallbackmissing":0,"rollingcountfallbackrejection":0,"rollingcountfallbacksuccess":0,"rollingcountresponsesfromcache":0,"rollingcountsemaphorerejected":0,"rollingcountshortcircuited":0,"rollingcountsuccess":0,"rollingcountthreadpoolrejected":0,"rollingcounttimeout":0,"currentconcurrentexecutioncount":0,"rollingmaxconcurrentexecutioncount":0,"latencyexecute_mean":0,"latencyexecute":{"0":0,"25":0,"50":0,"75":0,"90":0,"95":0,"99":0,"99.5":0,"100":0},"latencytotal_mean":0,"latencytotal":{"0":0,"25":0,"50":0,"75":0,"90":0,"95":0,"99":0,"99.5":0,"100":0},"propertyvalue_circuitbreakerrequestvolumethreshold":20,"propertyvalue_circuitbreakersleepwindowinmilliseconds":5000,"propertyvalue_circuitbreakererrorthresholdpercentage":50,"propertyvalue_circuitbreakerforceopen":false,"propertyvalue_circuitbreakerforceclosed":false,"propertyvalue_circuitbreakerenabled":true,"propertyvalue_executionisolationstrategy":"thread","propertyvalue_executionisolationthreadtimeoutinmilliseconds":1000,"propertyvalue_executiontimeoutinmilliseconds":1000,"propertyvalue_executionisolationthreadinterruptontimeout":true,"propertyvalue_executionisolationthreadpoolkeyoverride":null,"propertyvalue_executionisolationsemaphoremaxconcurrentrequests":10,"propertyvalue_fallbackisolationsemaphoremaxconcurrentrequests":10,"propertyvalue_metricsrollingstatisticalwindowinmilliseconds":10000,"propertyvalue_requestcacheenabled":true,"propertyvalue_requestlogenabled":true,"reportinghosts":1,"threadpool":"spring-cloud-producer"}
data: {"type":"hystrixthreadpool","name":"spring-cloud-producer","currenttime":1662554090588,"currentactivecount":0,"currentcompletedtaskcount":1,"currentcorepoolsize":10,"currentlargestpoolsize":1,"currentmaximumpoolsize":10,"currentpoolsize":1,"currentqueuesize":0,"currenttaskcount":1,"rollingcountthreadsexecuted":0,"rollingmaxactivethreads":0,"rollingcountcommandrejections":0,"propertyvalue_queuesizerejectionthreshold":5,"propertyvalue_metricsrollingstatisticalwindowinmilliseconds":10000,"reportinghosts":1}
ping: 说明已经返回了监控的各项结果。
到监控页面就会显示如下图:
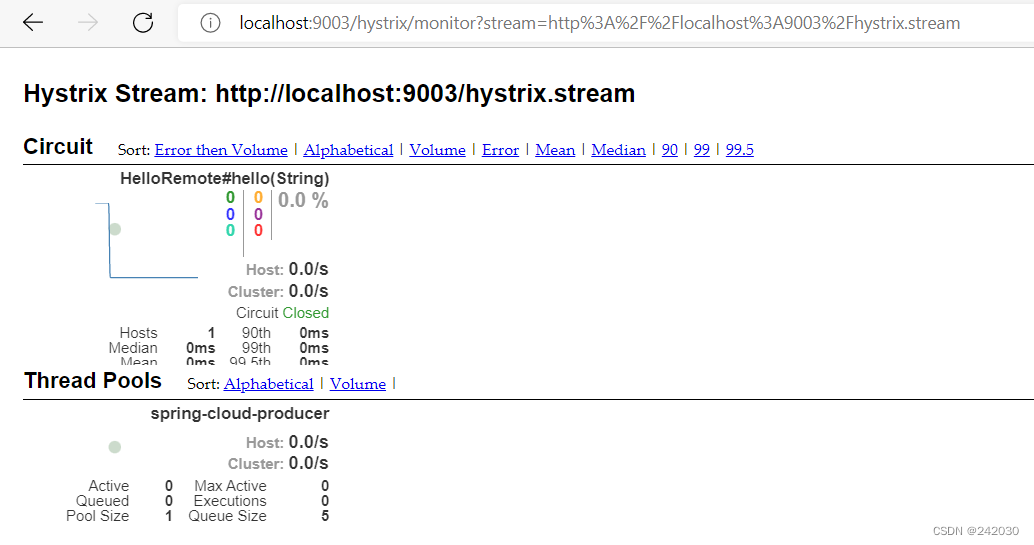
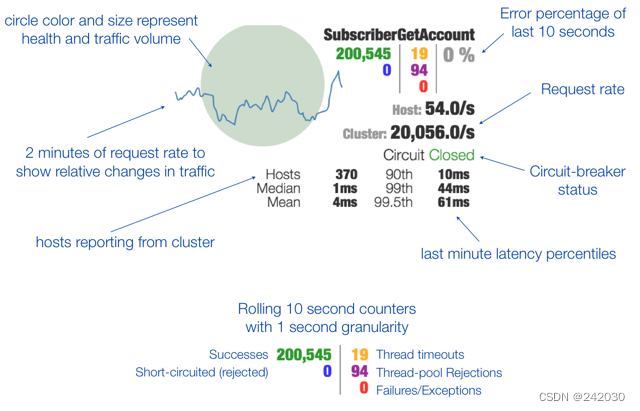
其实就是 http://localhost:9003/hystrix.stream 返回结果的图形化显示,hystrix dashboard wiki上详细
说明了图上每个指标的含义,如下图:
到此单个应用的熔断监控已经完成。
2、turbine
在复杂的分布式系统中,相同服务的节点经常需要部署上百甚至上千个,很多时候,运维人员希望能够把相同服务
的节点状态以一个整体集群的形式展现出来,这样可以更好的把握整个系统的状态。 为此,netflix提供了一个开
源项目(turbine)来提供把多个hystrix.stream的内容聚合为一个数据源供dashboard展示。
2.1 添加依赖
<?xml version="1.0" encoding="utf-8"?>
<project xmlns="http://maven.apache.org/pom/4.0.0" xmlns:xsi="http://www.w3.org/2001/xmlschema-instance"
xsi:schemalocation="http://maven.apache.org/pom/4.0.0 https://maven.apache.org/xsd/maven-4.0.0.xsd">
<modelversion>4.0.0</modelversion>
<parent>
<groupid>org.springframework.boot</groupid>
<artifactid>spring-boot-starter-parent</artifactid>
<version>1.5.3.release</version>
<relativepath/>
</parent>
<groupid>com.example</groupid>
<artifactid>spring-cloud-hystrix-dashboard-turbine</artifactid>
<version>0.0.1-snapshot</version>
<name>spring-cloud-hystrix-dashboard-turbine</name>
<description>spring-cloud-hystrix-dashboard-turbine</description>
<properties>
<project.build.sourceencoding>utf-8</project.build.sourceencoding>
<project.reporting.outputencoding>utf-8</project.reporting.outputencoding>
<java.version>1.8</java.version>
<spring-cloud.version>dalston.release</spring-cloud.version>
</properties>
<dependencies>
<dependency>
<groupid>org.springframework.cloud</groupid>
<artifactid>spring-cloud-starter-turbine</artifactid>
</dependency>
<dependency>
<groupid>org.springframework.cloud</groupid>
<artifactid>spring-cloud-netflix-turbine</artifactid>
</dependency>
<dependency>
<groupid>org.springframework.boot</groupid>
<artifactid>spring-boot-starter-actuator</artifactid>
</dependency>
<dependency>
<groupid>org.springframework.cloud</groupid>
<artifactid>spring-cloud-starter-hystrix-dashboard</artifactid>
</dependency>
</dependencies>
<dependencymanagement>
<dependencies>
<dependency>
<groupid>org.springframework.cloud</groupid>
<artifactid>spring-cloud-dependencies</artifactid>
<version>${spring-cloud.version}</version>
<type>pom</type>
<scope>import</scope>
</dependency>
</dependencies>
</dependencymanagement>
<build>
<plugins>
<plugin>
<groupid>org.springframework.boot</groupid>
<artifactid>spring-boot-maven-plugin</artifactid>
</plugin>
</plugins>
</build>
</project>2.2 配置文件
spring.application.name=hystrix-dashboard-turbine
server.port=8001
turbine.appconfig=node01,node02
turbine.aggregator.clusterconfig= default
turbine.clusternameexpression= new string("default")
eureka.client.serviceurl.defaultzone=http://localhost:8000/eureka/turbine.appconfig:配置eureka中的serviceid列表,表明监控哪些服务。turbine.aggregator.clusterconfig:指定聚合哪些集群,多个使用”,”分割,默认为default。可使用
http://.../turbine.stream?cluster={clusterconfig之一}访问。
turbine.clusternameexpression:
1、clusternameexpression指定集群名称,默认表达式appname;此时:
turbine.aggregator.clusterconfig需要配置想要监控的应用名称;
2、当clusternameexpression: default时,turbine.aggregator.clusterconfig可以不写,因为默认就是
default;
3、当clusternameexpression: metadata[‘cluster’]时,假设想要监控的应用配置了
eureka.instance.metadata-map.cluster: abc,则需要配置,同时
turbine.aggregator.clusterconfig: abc
2.3 启动类
启动类添加@enableturbine,激活对turbine的支持
package com.example;
import org.springframework.boot.springapplication;
import org.springframework.boot.autoconfigure.springbootapplication;
import org.springframework.cloud.netflix.hystrix.dashboard.enablehystrixdashboard;
import org.springframework.cloud.netflix.turbine.enableturbine;
@springbootapplication
@enablehystrixdashboard
@enableturbine
public class springcloudhystrixdashboardturbineapplication {
public static void main(string[] args) {
springapplication.run(springcloudhystrixdashboardturbineapplication.class, args);
}
}到此turbine(hystrix-dashboard-turbine)配置完成
2.4 测试
在示例项目spring-cloud-consumer-hystrix基础上修改为两个服务的调用者spring-cloud-consumer-node1和
spring-cloud-consumer-node2。
spring-cloud-consumer-node1项目改动如下:application.properties文件内容
spring.application.name=node01 server.port=9001 feign.hystrix.enabled=true eureka.client.serviceurl.defaultzone=http://localhost:8000/eureka/
spring-cloud-consumer-node2项目改动如下:application.properties文件内容
spring.application.name=node02 server.port=9002 feign.hystrix.enabled=true eureka.client.serviceurl.defaultzone=http://localhost:8000/eureka/
helloremote类修改:
package com.example.remote;
import org.springframework.cloud.netflix.feign.feignclient;
import org.springframework.web.bind.annotation.requestmapping;
import org.springframework.web.bind.annotation.requestparam;
@feignclient(name = "spring-cloud-producer", fallback = helloremotehystrix.class)
public interface helloremote {
@requestmapping(value = "/hello")
public string hello(@requestparam(value = "name") string name);
}对应的helloremotehystrix和consumercontroller类跟随修改,具体查看代码
package com.example.remote;
import org.springframework.stereotype.component;
import org.springframework.web.bind.annotation.requestparam;
@component
public class helloremotehystrix implements helloremote{
    @override
    public string hello(@requestparam(value = "name") string name) {
        return "hello " +name+", this messge send failed ";
    }
}
package com.example.controller;
import com.example.remote.helloremote;
import org.springframework.beans.factory.annotation.autowired;
import org.springframework.web.bind.annotation.pathvariable;
import org.springframework.web.bind.annotation.requestmapping;
import org.springframework.web.bind.annotation.restcontroller;
@restcontroller
public class consumercontroller {
@autowired
helloremote helloremote;
@requestmapping("/hello/{name}")
public string index(@pathvariable("name") string name) {
return helloremote.hello(name);
}
}修改完毕后,依次启动spring-cloud-eureka、spring-cloud-consumer-node1、spring-cloud-consumer-
node2、spring-cloud-hystrix-dashboard-turbine
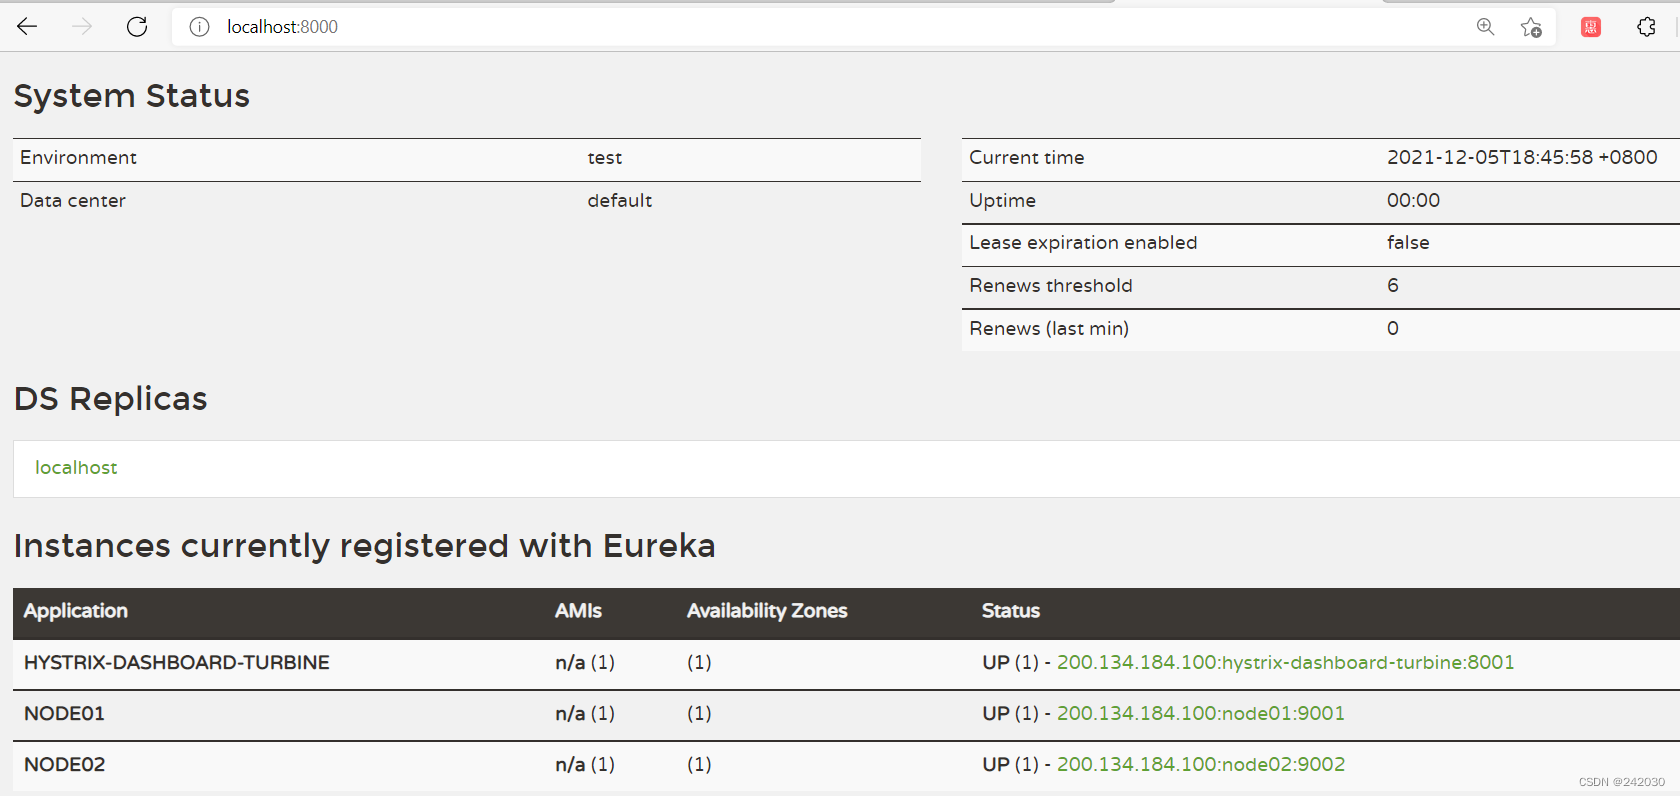
打开eureka后台可以看到注册了三个服务:
访问 http://localhost:8001/turbine.stream
返回:
: ping
data: {"reportinghostslast10seconds":0,"name":"meta","type":"meta","timestamp":1662554703162}
: ping
data: {"reportinghostslast10seconds":0,"name":"meta","type":"meta","timestamp":1662554706172}
并且会不断刷新以获取实时的监控数据,说明和单个的监控类似,返回监控项目的信息。
进行图形化监控查看,输入:http://localhost:8001/hystrix,返回酷酷的小熊界面
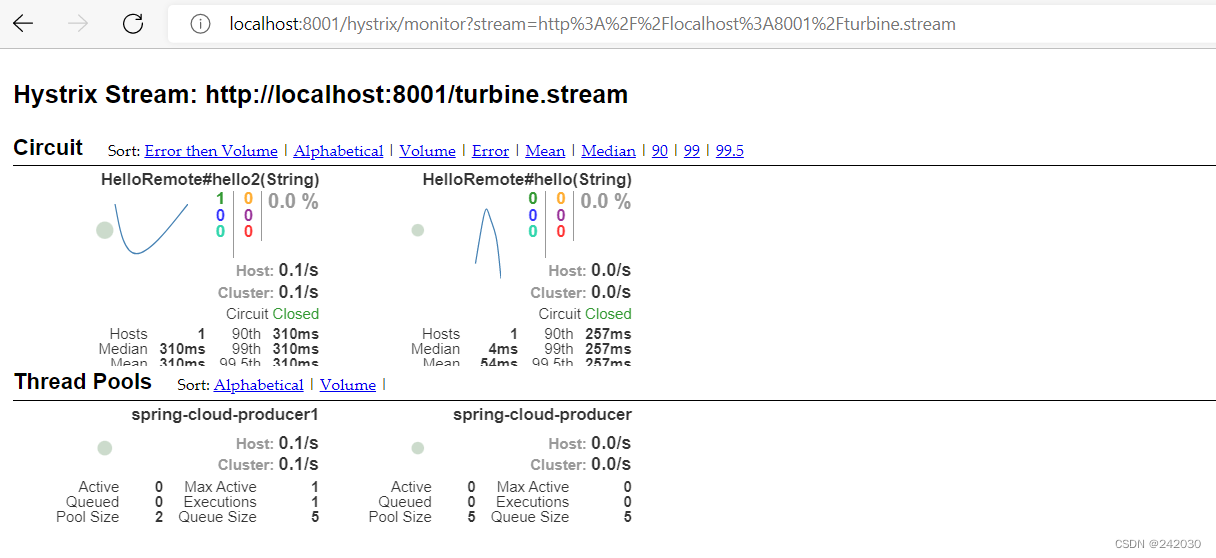
输入:http://localhost:8001/turbine.stream,然后点击 monitor stream ,可以看到出现了俩个监控列表
访问http://localhost:9001/hello/neo和http://localhost:9002/hello/neo
到此这篇关于springcloud中的熔断监控hystrixdashboard和turbine的文章就介绍到这了,更多相关springcloud熔断监控内容请搜索代码网以前的文章或继续浏览下面的相关文章希望大家以后多多支持代码网!

发表评论