一.spring boot admin集成
1.引入依赖
<dependencies>
    <!-- spring boot admin server 服务端引入-->
    <dependency>
        <groupid>de.codecentric</groupid>
        <artifactid>spring-boot-admin-server</artifactid>
        <version>2.7.1</version>
    </dependency>
    <!-- spring boot admin client客户端引入 -->
    <dependency>
        <groupid>de.codecentric</groupid>
        <artifactid>spring-boot-admin-starter-client</artifactid>
        <version>2.7.1</version>
    </dependency>
	 <!-- 使用nacos时引入-->
	<dependency>
		<groupid>com.alibaba.cloud</groupid>
		<artifactid>spring-cloud-starter-alibaba-nacos-discovery</artifactid>
	</dependency>
    <!-- spring boot starter mail 邮件提醒时引入-->
    <dependency>
        <groupid>org.springframework.boot</groupid>
        <artifactid>spring-boot-starter-mail</artifactid>
    </dependency>
</dependencies>
2.添加配置
management:
endpoints:
web:
exposure:
#启用所有的 actuator 端点
include: "*"
endpoint:
health:
show-details: always
server:
port: 9000
spring:
application:
name: admin-client
cloud:
nacos:
discovery:
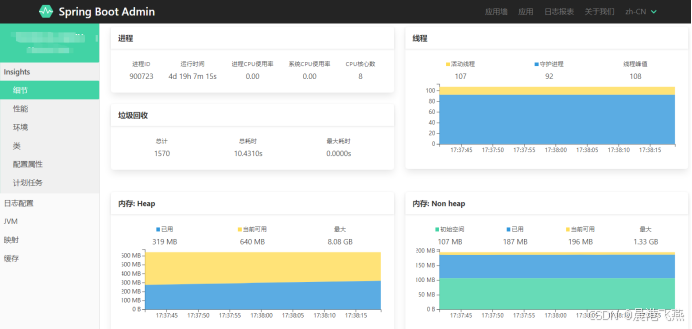
server-addr: 127.0.0.1:88483.监控界面
启动后访问:http://ip:9000,即可访问到监控页面
二.spring boot admin告警机制
spring boot admin 的告警机制可以帮助你监控 spring boot 应用的状态并在发生重要事件时发送通知。spring boot admin 提供了多种告警方式和配置选项,以便与不同的通知系统集成。以下是 spring boot admin 的告警机制的详细说明
1. 基本告警机制
spring boot admin 的告警机制基于监控事件和实例状态变化。可以配置不同的触发条件和通知方式来处理这些事件。
spring boot admin 监控应用的状态变化(例如:up、down、offline)。当应用的状态发生变化时,可以触发告警。告警通常包括以下几个方面:
实例状态变化: 例如,当应用从 up 状态变为 down 状态时。健康检查: 健康检查失败时,可以触发告警。
2. 配置告警
配置邮件信息
在 spring boot admin 服务器的配置文件中,可以设置告警的基本信息,包括通知发送者、smtp 配置等。
示例 application.yml 配置:
spring:
  boot:
    admin:
      notify:
        mail:
          from: "your-email@example.com"
          to: "alert-email@example.com"
          host: "smtp.example.com"
          port: 587
          username: "your-email@example.com"
          password: "your-email-password"
          properties.mail.smtp.auth: true
          properties.mail.smtp.starttls.enable: true
或者通过bean配置方式
@bean
public javamailsender javamailsender() {
    javamailsenderimpl mailsender = new javamailsenderimpl();
    mailsender.sethost(mailutil.mail_smtp_host); // 邮件服务器地址
    mailsender.setport(integer.parseint(mailutil.mail_smtp_port)); // 使用ssl的端口号
    mailsender.setusername(mailutil.mail_smtp_user); // 发送邮件的用户名
    mailsender.setpassword(mailutil.mail_smtp_password); // 发送邮件的密码
    properties props = mailsender.getjavamailproperties();
    props.put("mail.transport.protocol", "smtp");//常见的协议类型smtp,imap,pop3
    props.put("mail.smtp.auth", "true");
    props.put("mail.smtp.socketfactory.port", mailutil.mail_smtp_port); // 配置socket工厂端口
    props.put("mail.smtp.socketfactory.class", "javax.net.ssl.sslsocketfactory"); // 使用ssl
    props.put("mail.smtp.starttls.enable", "false"); // 由于使用ssl,禁用starttls
   // props.put("mail.debug", "true"); // 调试模式
    return mailsender;
}
配置触发条件
spring boot admin 允许基于特定条件触发告警。以下是一些常见的告警触发条件:
- cpu 使用率: 当 cpu 使用率超过指定阈值时触发告警。
- 内存使用率: 当 jvm 内存使用超过指定阈值时触发告警。
- 线程数: 当线程数超出设定范围时触发告警。
- gc 暂停: 当垃圾回收暂停时间过长时触发告警。
- 自定义指标: 可以基于应用程序的自定义指标来触发告警。
示例配置:
spring:
  boot:
    admin:
      monitor:
        status-lifetime: 10m
        threshold: 0.9
      notify:
        triggers:
          - name: cpu
            metric: "system.cpu.usage"
            threshold: 0.9
            above: true
            period: 5m
          - name: memory
            metric: "jvm.memory.used"
            threshold: 0.9
            above: true
            period: 5m
          - name: jvm-heap
            metric: "jvm.memory.heap.used"
            threshold: 0.9
            above: true
            period: 5m
          - name: threads
            metric: "jvm.threads.live"
            threshold: 1000
            above: true
            period: 5m
          - name: gc
            metric: "jvm.gc.pause"
            threshold: 0.1
            above: true
            period: 5m
2.1 triggers触发器讲解
spring.boot.admin.monitor.triggers 是 spring boot admin 的配置项,用于定义在监控应用程序实例时的触发器。通过这些触发器,你可以设定特定的条件,当这些条件满足时,spring boot admin 会执行相应的动作,比如发送通知、触发告警等。
触发器的基本概念
触发器(triggers)是基于条件表达式的逻辑,用于自动化监控和管理任务。当应用程序的状态或性能指标满足预设的条件时,触发器会激活并执行预定义的动作。这种机制使得系统监控变得更加智能和自动化。
配置项解释
spring.boot.admin.monitor.triggers 配置项用于定义一个或多个触发器。每个触发器可以包含以下部分:
1.condition: 条件表达式,用于定义触发器何时触发。这通常是一个spel(spring expression language)表达式。
2.action: 当条件满足时,应该执行的动作。动作可以包括发送邮件、触发webhook、记录日志等。
触发器配置结构
触发器通常配置在 application.yml 或 application.properties 文件中,以下是配置结构的详细解释:
spring:
  boot:
    admin:
      monitor:
        triggers:
          - condition: "health.status=='down' or info.memory.free<52428800 or info.cpu.usage>0.8"
            # 在这里定义动作,比如发送通知或执行其他操作
          - action: ...
1.condition
condition: 这是触发器的核心部分,定义了触发的条件。条件可以基于健康状态、度量指标(如 cpu 使用率、内存使用情况等),甚至是自定义的应用程序信息。
典型的条件表达式可能包括健康状态检查、资源使用率监控等。
条件可以包括对监控数据、应用状态或其他系统指标的检查。以下是一些常见的配置条件:
1. 应用健康状态
health.status=='up': 应用健康状态为 "up"。
health.status=='down': 应用健康状态为 "down"。
health.status=='out_of_service': 应用健康状态为 "out_of_service"。
2. 内存使用情况
info.memory.usage > 0.8: 内存使用率超过 80%。
info.memory.usage < 0.5: 内存使用率低于 50%。
3. cpu 使用率
info.cpu.usage > 0.7: cpu 使用率超过 70%。
info.cpu.usage < 0.3: cpu 使用率低于 30%。
4. 自定义指标
custom.metric > 100: 某个自定义指标超过 100。
custom.metric < 10: 某个自定义指标低于 10。
5. 应用实例
instance.name=='app-instance-1': 应用实例名称为 app-instance-1。
instance.id=='12345': 应用实例 id 为 12345。
6. 事件类型
event.type=='instanceregisteredevent': 事件类型为 instanceregisteredevent。
event.type=='instancederegisteredevent': 事件类型为 instancederegisteredevent。
7. 响应时间
http.server.requests.max > 5000: 最大 http 请求响应时间超过 5000 毫秒。
http.server.requests.mean > 2000: 平均 http 请求响应时间超过 2000 毫秒。
示例配置
在配置中可以结合使用多种条件。例如:
triggers:
  - condition: health.status=='down' or info.cpu.usage > 0.8
  - condition: info.memory.usage > 0.7
这将触发警报当应用健康状态为 "down" 或 cpu 使用率超过 80%,或者内存使用率超过 70% 时。
2.action:
action: 这个部分定义了当条件满足时应该执行的操作。可以是多种操作,比如发送邮件、触发 http 请求(webhook)、记录日志,或者调用自定义的动作。
spring.boot.admin 可以与其他系统集成,通过 webhook 通知外部系统,或者使用电子邮件通知运维人员。
使用场景
健康监控: 你可以设置一个触发器,当应用程序的健康状态变为 down 时自动发送警报或执行恢复脚本。
性能监控: 通过监控 cpu 使用率或内存使用情况,可以在资源使用率超过特定阈值时触发警报,从而避免潜在的性能问题。
自动化响应: 你可以在触发条件下执行自动化的恢复操作,或者通知运维团队采取行动。
触发器的示例
spring:
  boot:
    admin:
      monitor:
        triggers:
          - condition: "health.status=='down'"
            action:
              type: "email"
              recipients:
                - "admin@example.com"
              subject: "application down"
              body: "the application is currently down. please check immediately."
          - condition: "info.memory.free < 104857600" # 100mb
            action:
              type: "webhook"
              url: "https://alert-system.example.com/notify"
              method: "post"
              headers:
                content-type: "application/json"
              body: '{"message": "memory usage is critically low"}'
在这个示例中:
第一个触发器检测到应用程序健康状态为 down 时发送电子邮件通知。
第二个触发器检测到可用内存小于 100mb 时,触发一个 http post 请求,通知外部的告警系统。
完成示例
server.port=9000
#启用所有的 actuator 端点
management.endpoints.web.exposure.include="*"
management.endpoint.health.show-details=always
#是否暴露 metrics 端点,提供如 jvm 内存使用、系统 cpu 使用率、线程使用情况等信息,actuator 端点包括health,info,threads, heap dump,environment,loggers,caches,dump,trace?
management.endpoint.metrics.enabled=true
#是否将应用程序的度量指标导出到控制台或日志中
management.metrics.export.simple.enabled=true
#邮件服务器配置
spring.mail.host=smtp.your-email-provider.com
spring.mail.port=465
spring.mail.username=your-email@example.com
spring.mail.password=your-email-password
spring.mail.properties.mail.smtp.auth=true
spring.mail.properties.mail.smtp.starttls.enable=true
# 告警邮件配置
spring.boot.admin.notify.mail.from=xxxxx@qq.com
spring.boot.admin.notify.mail.to=877507054@qq.com
spring.boot.admin.notify.mail.subject="service alert:[${spring.application.name}] "
spring.boot.admin.notify.mail.enabled=true
# 检查和更新注册的客户端应用程序的状态的频率
spring.boot.admin.monitor.instances.poll-interval=10s
#应用程序的状态在这个时间段内没有更新,会将其状态标记为过时(offline)
spring.boot.admin.monitor.status-lifetime=10s
spring.boot.admin.ui.title=消费帮扶监控平台
#触发器配置,当应用程序的健康状态为 down或者可用内存少于 50mb 时或者当 cpu 使用率超过 80% 时触发
spring.boot.admin.monitor.triggers.0.condition=health.status=='down' or info.memory.free<52428800 or info.cpu.usage>0.1
spring.boot.admin.monitor.triggers.0.action.mail.from=xxxxx@qq.com
spring.boot.admin.monitor.triggers.0.action.mail.to=877507054@qq.com,xxxx@163.com
spring.boot.admin.monitor.triggers.0.action.subject=[${spring.application.name}] 程序告警
spring.boot.admin.monitor.triggers.0.action.mail.text=the application [${spring.application.name}] (id: ${spring.boot.admin.client.instance-id}) has a cpu usage over 80%. immediate attention required. instance details: ip - ${instance.remoteaddress}
关键变量解释
${spring.application.name}: 代表当前应用程序的名称。这是在 spring boot 配置中常用的属性,能够标识应用程序。
${spring.boot.admin.client.instance-id}: 代表 spring boot admin 为每个客户端实例分配的唯一 id。如果你在应用程序的 application.properties 中配置了 spring.boot.admin.client.instance-id,它可以用来唯一标识每个实例。
${instance.remoteaddress}: 代表应用程序实例的 ip 地址,能够帮助你识别警报来自哪个服务器。
总结
spring.boot.admin.monitor.triggers 是 spring boot admin 中一个强大的功能,用于自动化应用程序监控和管理。通过定义触发器条件和相应的动作,可以实现智能化的监控响应,确保系统的稳定性和可用性。使用触发器,你可以在应用程序状态出现异常时及时收到通知或采取自动化措施,从而提高系统的可靠性和响应速度。
3. 自定义通知
可以实现自定义的通知逻辑,例如发送邮件、推送通知、调用 api 等。通过实现 notifier 接口或扩展 abstracteventnotifier 类,可以定义自己的告警处理方式。
示例customeventnotifier
/**
 * 自定义通知器类
 * {
 * "names": [
 * "http.server.requests:http 请求的计数和统计信息",
 * "jvm.buffer.count:jvm 中缓冲区的数量",
 * "jvm.buffer.memory.used:jvm 中缓冲区使用的内存量",
 * "jvm.buffer.total.capacity:jvm 中缓冲区的总容量",
 * "jvm.classes.loaded:当前加载的 jvm 类的数量",
 * "jvm.classes.unloaded:已卸载的 jvm 类的数量",
 * "jvm.gc.live.data.size:jvm 堆中活跃数据的大小",
 * "jvm.gc.max.data.size:最大可回收的数据大小",
 * "jvm.gc.memory.allocated:分配的 jvm 内存量",
 * "jvm.gc.memory.promoted:晋升的内存量",
 * "jvm.gc.pause:垃圾回收暂停时间",
 * "jvm.memory.committed:已提交的 jvm 内存量",
 * "jvm.memory.max:jvm 可用的最大内存量",
 * "jvm.memory.used:当前使用的 jvm 内存量",
 * "jvm.threads.daemon:当前活跃的守护线程数",
 * "jvm.threads.live:当前活跃的线程总数",
 * "jvm.threads.peak:jvm 线程的峰值数量",
 * "jvm.threads.states:各个线程状态的数量",
 * "logback.events:logback 事件的计数",
 * "process.cpu.usage:进程的 cpu 使用率",
 * "process.files.max:进程允许的最大文件描述符数量",
 * "process.files.open:当前打开的文件描述符数量",
 * "process.start.time:进程启动时间",
 * "process.uptime:进程的运行时间",
 * "system.cpu.count:系统中的 cpu 核心数量",
 * "system.cpu.usage:系统的 cpu 使用率",
 * "system.load.average.1m:系统 1 分钟内的平均负载",
 * "tomcat.sessions.active.current:当前活跃的 tomcat 会话数量",
 * "tomcat.sessions.active.max:tomcat 中的最大活跃会话数量",
 * "tomcat.sessions.alive.max:tomcat 中的最大存活会话数量",
 * "tomcat.sessions.created:创建的 tomcat 会话总数",
 * "tomcat.sessions.expired:过期的 tomcat 会话数量",
 * "tomcat.sessions.rejected:被拒绝的 tomcat 会话数量"
 * ]
 * }
 */
@component
public class customnotifier extends abstracteventnotifier implements healthindicator {
    private static final logger logger = loggerfactory.getlogger(customnotifier.class);
    private resttemplate resttemplate;
    //阈值
    private static double cputhreshold = 50.0;//cpu使用率阈值
    private static double jvmmemorythreshold = 50.0;//内存使用率阈值
    //使用率
    private static double cpuusage = 0.0;//cpu 使用率
    private static double jvmmemoryusage = 0.0;//jvm内存使用率
    //所属环境
    private static string environment;
    static {
        if (environmentutil.isprodprofile()) {//生产环境
            environment = "生产环境";
        } else {
            environment = "测试环境";
        }
    }
    @resource
    private javamailsender mailsender;
    public customnotifier(instancerepository repository, resttemplate resttemplate) {
        super(repository);
        this.resttemplate = resttemplate;
    }
    @override
    protected mono<void> donotify(instanceevent event, instance instance) {
        return mono.fromrunnable(() -> {
            try {
                if (event instanceof instanceregisteredevent) {//新实例加入事件
                    handleevent(instance, "1");
                    logger.info("新实例加入事件,实例名:{}", instance.getregistration().getname());
                } else if (event instanceof instancederegisteredevent) {//实例关闭或注销事件
                    handleevent(instance, "2");
                    logger.info("实例关闭或注销事件,实例名:{}", instance.getregistration().getname());
                } else if (event instanceof instancestatuschangedevent) {//实例健康状态改变事件
                    handleevent(instance, "3");
                    logger.info("实例健康状态改变事件,实例名:{}", instance.getregistration().getname());
                } else if (event instanceof instanceinfochangedevent) {//实例信息更新事件
                    handleevent(instance, "4");
                    logger.info("实例信息更新事件,实例名:{}", instance.getregistration().getname());
                } else {
                    handleevent(instance, "5");//其他事件
                    logger.info("其他事件,实例名:{}", instance.getregistration().getname());
                }
            } catch (exception e) {
                logger.info("监控平台异常:" + e.getmessage());
            }
        });
    }
    private void handleevent(instance instance, string type) {
        string alertmessage = "";
        /*****************************************1.收集信息************************************************************/
        string applicationname = instance.getregistration().getname();
        //状态
        string status = instance.getstatusinfo().getstatus();
        //获取metrics信息
        map<string, object> allmetrics = new hashmap<>();
        try {
            // 获取 /metrics 基本 url
            string basemetricurl = instance.getregistration().getserviceurl() + "/actuator/metrics";
            // 获取所有 metrics 名称
            map<string, object> metricsresponse = resttemplate.getforobject(basemetricurl, map.class);
            if (metricsresponse == null||metricsresponse.isempty()) {
                throw new runtimeexception("获取metrics端点信息为null");
            }
            list<string> namelist = (list) metricsresponse.get("names");
            for (string metricname : namelist) {
                string metricurl = basemetricurl + "/" + metricname;
                map<string, object> metricdetails = resttemplate.getforobject(metricurl, map.class);
                allmetrics.put(metricname, metricdetails);
            }
            double jvmmemoryused = 0.0;
            double jvmmemorymax = 0.0;
            map<string, object> memoryusedmap = (map<string, object>) allmetrics.get("jvm.memory.used");//当前使用的 jvm 内存量
            map<string, object> memorymaxmap = (map<string, object>) allmetrics.get("jvm.memory.max");//jvm 可用的最大内存量
            if (memoryusedmap != null && memorymaxmap != null) {
                // 获取内存使用和最大值的 measurements
                list<map<string, object>> memoryusedmeasurements = (list<map<string, object>>) memoryusedmap.get("measurements");
                list<map<string, object>> memorymaxmeasurements = (list<map<string, object>>) memorymaxmap.get("measurements");
                if (memoryusedmeasurements != null && !memoryusedmeasurements.isempty() && memorymaxmeasurements != null && !memorymaxmeasurements.isempty()) {
                    jvmmemoryused = (double) memoryusedmeasurements.get(0).get("value");
                    jvmmemorymax = (double) memorymaxmeasurements.get(0).get("value");
                }
            }
            // 计算内存使用率
            jvmmemoryusage = (jvmmemoryused / jvmmemorymax) * 100;
            logger.info("jvm 内存使用率: {}%", jvmmemoryusage);
            // cpu 使用率
            map<string, object> cpuusagemap = (map<string, object>) allmetrics.get("system.cpu.usage");
            if (cpuusagemap != null) {
                list<map<string, object>> cpuusagemeasurements = (list<map<string, object>>) cpuusagemap.get("measurements");
                if (cpuusagemeasurements != null && !cpuusagemeasurements.isempty()) {
                    cpuusage = (double) cpuusagemeasurements.get(0).get("value") * 100;
                }
            }
            logger.info("系统 cpu 使用率: {}%", cpuusage);
            /*****************************************2.组装输出信息************************************************************/
            alertmessage =
                    "\n应用id:" + instance.getid() +
                            "\n应用名:" + applicationname +
                            "\n应用名:" + applicationname +
                            "\n状态:" + status +
                            "\n事件类型:" + type +
                            "\n实例注册名称:" + instance.getregistration().getname() +
                            "\n管理url:" + instance.getregistration().getmanagementurl() +
                            "\n健康url:" + instance.getregistration().gethealthurl() +
                            "\n当前使用的jvm内存量(mb):" +  math.round(jvmmemoryused/ (1024*1024) * 100) / 100.0+
                            "\njvm可用的最大内存量(mb):" +  math.round(jvmmemorymax / (1024*1024) * 100) / 100.0+
                            "\njvm内存使用率:" + math.round(jvmmemoryusage * 100) / 100.0+
                            "\ncpu使用率:" + math.round(cpuusage * 100) / 100.0 +
                            "\nmetrics端点json:" + json.tojsonstring(allmetrics) ;
            logger.info(alertmessage);
        } catch (exception e) {
            logger.error("获取 metrics 端点信息错误: ", e);
        }
        /*****************************************3.根据情况发送邮件************************************************************/
        if ("2".equals(type)) {
            sendemail(environment + "监控告警]-实例关闭或注销事件:" + applicationname, alertmessage, null);
        }
        if (cpuusage > cputhreshold) {
            sendemail(environment + "监控告警]-系统cpu使用率达到" + cpuusage + "%告警:" + applicationname, alertmessage, null);
        }
        if (jvmmemoryusage > jvmmemorythreshold) {
            sendemail(environment + "监控告警]-jvm内存使用率达到" + jvmmemoryusage + "%告警:" + applicationname, alertmessage, null);
        }
    }
    private void sendemail(string title, string body, string tomail) {
        try {
            simplemailmessage message = new simplemailmessage();
            if (stringutils.isempty(tomail)) {
                tomail = mailutil.mail_smtp_to;
            }
            message.setto(tomail.split(",")); // 收件人
            message.setfrom(mailutil.mail_smtp_user);
            message.setsubject(title);
            message.settext(body);
            logger.info("发送告警邮件:", message.getsubject() + ",to:" + message.getto());
            mailsender.send(message);
        } catch (exception e) {
            logger.error("发送邮件失败,失败信息:" + e.getmessage());
        }
    }
    /**
     * 定义信息到/actuator/health端点,向/actuator/info端点自定义信息可以继承infocontributor接口
     * healthindicator 是一个用于提供应用健康检查的接口
     * healthindicator 会被 spring boot actuator 自动扫描,并在 /actuator/health 端点上暴露。
     * 访问 /actuator/health
     * {
     * "status": "up",
     * "details": {
     * "maxmemory": 4294967296,
     * "totalmemory": 104857600,
     * "freememory": 73741824,
     * "usedmemory": 31115776
     * }
     * }
     *
     * @return
     */
    @override
    public health health() {
        // 获取当前jvm内存使用情况
        runtime runtime = runtime.getruntime();
        /**获取当前jvm 内存使用情况**/
        memorymxbean memorymxbean = managementfactory.getmemorymxbean();
        memoryusage heapmemoryusage = memorymxbean.getheapmemoryusage();
        memoryusage nonheapmemoryusage = memorymxbean.getnonheapmemoryusage();
        /**获取垃圾回收器信息**/
        list<garbagecollectormxbean> garbagecollectormxbeans = managementfactory.getgarbagecollectormxbeans();
        stringbuilder gcinfo = new stringbuilder();
        for (garbagecollectormxbean gcbean : garbagecollectormxbeans) {
            gcinfo.append(gcbean.getname())
                    .append(": ")
                    .append("collection count: ").append(gcbean.getcollectioncount() == -1 ? "n/a" : gcbean.getcollectioncount())
                    .append(", collection time (ms): ").append(gcbean.getcollectiontime() == -1 ? "n/a" : gcbean.getcollectiontime())
                    .append("\n");
        }
        /**获取线程信息**/
        threadmxbean threadmxbean = managementfactory.getthreadmxbean();
        /**获取操作系统信息**/
        operatingsystemmxbean osmxbean = managementfactory.getoperatingsystemmxbean();
        // 检查内存使用情况是否超出了阈值
        long usedmemory = runtime.totalmemory() - runtime.freememory();
        return health.up()
                .withdetail("jvm堆最大内存", runtime.maxmemory())
                .withdetail("jvm堆总内存", runtime.totalmemory())//返回当前 jvm 堆的总内存量,代码所在jvm
                .withdetail("jvm堆空闲的内存量", runtime.freememory())//返回当前 jvm 堆中空闲的内存量
                .withdetail("jvm堆已用内存", usedmemory)
                .withdetail("非堆内存(non-heap)内存使用", nonheapmemoryusage.getused() + "/" + math.round(nonheapmemoryusage.getmax()))
                .withdetail("堆(heap)内存使用", heapmemoryusage.getused() + "/" + math.round(heapmemoryusage.getmax()))
                .withdetail("可用处理器", runtime.availableprocessors())
                .withdetail("线程信息", threadmxbean.getthreadcount())
                .withdetail("峰值线程数", threadmxbean.getpeakthreadcount())
                .withdetail("总启动线程数", threadmxbean.gettotalstartedthreadcount())
                .withdetail("操作系统可用处理器", osmxbean.getavailableprocessors())
                .withdetail("系统负载平均值", osmxbean.getsystemloadaverage())
                .withdetail("gc信息", gcinfo)
                .build();
    }
}
其他配置信息
@bean
public resttemplate resttemplate() {
    return new resttemplate();
}
在 customnotifier 类中,donotify 方法的 instance 参数代表了一个注册的应用实例的详细信息。理解 instance 的结构和内容可以帮助你在处理通知时更好地利用这些数据。
instance 的主要字段,你可以访问 instance 对象来获取有关应用实例的信息,以便在通知中使用。例如,你可以:
- 获取实例的基本信息:如 name、id 等,来确定是哪个实例触发了事件。
- 检查实例的状态:通过 statusinfo 和 status 字段,你可以了解实例的健康状况,并据此做出通知决策。
- 使用注册信息:例如,managementurl 和 healthurl,可以用于构建通知内容或执行进一步的检查。
- 访问实例的端点信息:例如,你可以查看哪些 actuator 端点被暴露,并利用这些端点进行更深入的监控或操作。
3.1 instance 对象
以下是 instance 对象的一些关键字段及其含义:
id:
唯一标识该实例的 id。
version:
该实例的版本号。
registration:
实例注册信息,包括:
name: 实例的名称。
managementurl: 用于管理的 url(例如 /actuator 的 url)。
healthurl: 用于健康检查的 url。
serviceurl: 服务的基础 url。
source: 实例的注册来源(例如 discovery)。
metadata: 与实例相关的元数据,如心跳超时、nacos 配置等。
registered:
布尔值,指示实例是否已注册。
statusinfo:
实例的状态信息,包括:
status: 实例的健康状态(例如 up、down)。
details: 包含详细的状态信息,可能包括:sentinel, elasticsearch, diskspace, ping, discoverycomposite, refreshscope, nacosdiscovery, db, redis 等。每个状态组件可能有 status 和 details,这些详细信息可以包括服务的健康状况、性能指标等。
statustimestamp:
实例状态的时间戳。
info:
实例的额外信息,通常是应用程序的自定义信息。
endpoints:
实例暴露的 actuator 端点的列表,包括每个端点的 id 和 url(例如 /actuator/health、/actuator/metrics)。
tags:
实例的标签,用于标识或分类实例。
三.spring boot admin支持的监控属性
在spring boot admin中,你可以监控应用程序的各种指标。spring boot admin通过spring boot actuator提供的端点来收集这些监控信息。下面是spring boot admin支持的监控属性的详细列表,它们通常包括系统的健康状态、度量数据、环境信息等。
1.常见的spring boot admin监控属性
1. health
status: 应用程序的整体健康状态 (up, down, out_of_service, unknown)。
details: 各个健康检查的详细信息,如数据库、消息中间件等。
2. metrics
jvm.memory.used: 已使用的jvm内存。
jvm.memory.max: 最大jvm内存。
jvm.memory.committed: 已提交的jvm内存。
jvm.gc.total: jvm垃圾回收总数。
jvm.gc.time: jvm垃圾回收时间。
system.cpu.usage: 系统cpu使用率。
system.cpu.load: 系统cpu负载。
disk.space.free: 磁盘可用空间。
disk.space.total: 磁盘总空间。
disk.space.used: 磁盘已用空间。
3. environment
properties: 环境属性,如server.port, spring.datasource.url等。
configurations: 应用程序配置文件的详细信息。
beans: spring上下文中定义的bean信息。
4. info
app.version: 应用程序的版本。
app.description: 应用程序的描述。
build.version: 构建版本。
build.name: 构建名称。
build.time: 构建时间。
git.commit.id: git提交id。
git.commit.time: git提交时间。
git.branch: git分支。
5. loggers
loggers: 各个日志记录器的级别(例如debug, info, warn, error)。
logging.level: 各个包的日志级别配置。
6. threads
thread.count: 当前活动线程的数量。
thread.states: 各种线程状态的计数(例如runnable, waiting, timed_waiting, blocked)。
thread.details: 线程的详细信息。
7. caches
caches: 相关缓存的信息,如缓存名称、大小等。
8. heap dump
heap: 堆转储的详细信息,包括各个类的实例和内存占用情况。
9. dump
dump: 应用程序的线程转储信息。
10. trace
trace: 跟踪信息,通常用于调试目的。
配置spring boot admin以显示这些属性
确保你的application.properties或application.yml中配置了actuator的相关端点,以便spring boot admin能够获取这些监控信息。例如:
management.endpoints.web.exposure.include=health,metrics,info,env,loggers,threaddump
management.endpoint.health.show-details=always
https://docs.spring.io/spring-boot/reference/actuator/endpoints.html
2.端点接口
1. /actuator/health
状态信息 (statusinfo):包括应用程序的健康状态(如 up、down),以及各种健康检查的详细信息(例如数据库、缓存、磁盘空间的健康状况)。这对应于 instance 对象的 statusinfo 字段。
   {
      "status": "up",
      "details": {
        "diskspace": {
          "status": "up",
          "details": {
            "total": 51510251520,
            "free": 35968552960
          }
        }
      }
    }
2. /actuator/info
额外信息 (info):通常用于返回应用程序的元数据,例如版本信息、构建信息等。对应 instance 对象的 info 字段。示例:
 {
      "app": "my-app",
      "version": "1.0.0"
    }
3. /actuator/env
环境信息:提供有关应用程序的环境属性的详细信息。这不是直接包含在 instance 对象中的字段,但可以在 info 中看到。 示例:
{
      "propertysources": [
        {
          "name": "systemproperties",
          "properties": {
            "java.version": "1.8.0_212"
          }
        }
      ]
    }
4. /actuator/metrics
性能指标:提供关于应用程序性能的详细数据(例如内存使用情况、垃圾回收信息等)。这些信息可以用来补充 statusinfo 中的性能数据,但通常 metrics 不直接映射到 instance 的字段中。示例:
   {
      "jvm.memory.used": 12345678,
      "jvm.memory.max": 98765432
    }
5. /actuator/mappings
端点映射:提供所有控制器端点的映射信息。这可以与 instance 的 endpoints 字段相关联。 示例:
 {
      "controllers": {
        "home": "/home",
        "admin": "/admin"
      }
    }
6. /actuator/beans
bean 信息:列出所有 spring bean 和其配置。这有助于调试和了解应用程序的内部结构,虽然它通常不直接映射到 instance 对象的字段中。示例:
    {
      "beans": [
        {
          "name": "datasource",
          "type": "javax.sql.datasource"
        }
      ]
    }
这些端点提供了不同类型的监控和管理信息,可以帮助你从 actuator 中提取所需的数据
3.访问示例
访问:http://localhost:9000/actuator
{
  "_links": {
    "self": {
      "href": "http://localhost:9000/actuator",
      "templated": false
    },
    "archaius": {
      "href": "http://localhost:9000/actuator/archaius",
      "templated": false
    },
    "nacosdiscovery": {
      "href": "http://localhost:9000/actuator/nacosdiscovery",
      "templated": false
    },
    "sentinel": {
      "href": "http://localhost:9000/actuator/sentinel",
      "templated": false
    },
    "beans": {
      "href": "http://localhost:9000/actuator/beans",
      "templated": false
    },
    "caches-cache": {
      "href": "http://localhost:9000/actuator/caches/{cache}",
      "templated": true
    },
    "caches": {
      "href": "http://localhost:9000/actuator/caches",
      "templated": false
    },
    "health": {
      "href": "http://localhost:9000/actuator/health",
      "templated": false
    },
    "health-path": {
      "href": "http://localhost:9000/actuator/health/{*path}",
      "templated": true
    },
    "info": {
      "href": "http://localhost:9000/actuator/info",
      "templated": false
    },
    "conditions": {
      "href": "http://localhost:9000/actuator/conditions",
      "templated": false
    },
    "configprops": {
      "href": "http://localhost:9000/actuator/configprops",
      "templated": false
    },
    "env-tomatch": {
      "href": "http://localhost:9000/actuator/env/{tomatch}",
      "templated": true
    },
    "env": {
      "href": "http://localhost:9000/actuator/env",
      "templated": false
    },
    "loggers": {
      "href": "http://localhost:9000/actuator/loggers",
      "templated": false
    },
    "loggers-name": {
      "href": "http://localhost:9000/actuator/loggers/{name}",
      "templated": true
    },
    "heapdump": {
      "href": "http://localhost:9000/actuator/heapdump",
      "templated": false
    },
    "threaddump": {
      "href": "http://localhost:9000/actuator/threaddump",
      "templated": false
    },
    "metrics-requiredmetricname": {
      "href": "http://localhost:9000/actuator/metrics/{requiredmetricname}",
      "templated": true
    },
    "metrics": {
      "href": "http://localhost:9000/actuator/metrics",
      "templated": false
    },
    "scheduledtasks": {
      "href": "http://localhost:9000/actuator/scheduledtasks",
      "templated": false
    },
    "mappings": {
      "href": "http://localhost:9000/actuator/mappings",
      "templated": false
    },
    "refresh": {
      "href": "http://localhost:9000/actuator/refresh",
      "templated": false
    },
    "features": {
      "href": "http://localhost:9000/actuator/features",
      "templated": false
    },
    "service-registry": {
      "href": "http://localhost:9000/actuator/service-registry",
      "templated": false
    }
  }
}
访问http://localhost:9000/actuator/metrics
{
  "names": [
    "http.server.requests",
    "jvm.buffer.count",
    "jvm.buffer.memory.used",
    "jvm.buffer.total.capacity",
    "jvm.classes.loaded",
    "jvm.classes.unloaded",
    "jvm.gc.live.data.size",
    "jvm.gc.max.data.size",
    "jvm.gc.memory.allocated",
    "jvm.gc.memory.promoted",
    "jvm.gc.pause",
    "jvm.memory.committed",
    "jvm.memory.max",
    "jvm.memory.used",
    "jvm.threads.daemon",
    "jvm.threads.live",
    "jvm.threads.peak",
    "jvm.threads.states",
    "logback.events",
    "process.cpu.usage",
    "process.files.max",
    "process.files.open",
    "process.start.time",
    "process.uptime",
    "system.cpu.count",
    "system.cpu.usage",
    "system.load.average.1m",
    "tomcat.sessions.active.current",
    "tomcat.sessions.active.max",
    "tomcat.sessions.alive.max",
    "tomcat.sessions.created",
    "tomcat.sessions.expired",
    "tomcat.sessions.rejected"
  ]
}
访问具体的参数可以得到具体的值,比如访问/actuator/metrics/jvm.memory.used
访问http://localhost:9000/applications
spring boot admin 的 /applications 接口 获取的。该接口返回当前在 spring boot admin 中注册的所有应用程序的信息,包括每个应用的详细实例数据,例如 health、status、managementurl、endpoints 等。
name: 应用程序的名称,status: 应用程序的整体状态,通常是 up 或 down。
instances: 应用程序的所有实例信息。
id: 实例的唯一标识符。
statusinfo: 包含实例的详细状态信息,例如 sentinel、elasticsearch、diskspace、redis 等相关服务的状态。
endpoints: 列举了实例暴露的 actuator 端点,例如 /actuator/health, /actuator/metrics 等。
{
    "name": "yixiekeji-member",
    "buildversion": null,
    "status": "up",
    "statustimestamp": "2024-09-03t05:18:26.492z",
    "instances": [
      {
        "id": "xxx",
        "version": 2,
        "registration": {
          "name": "yixiekeji-member",
          "managementurl": "http://ip:port/actuator",
          "healthurl": "http://ip:port/actuator/health",
          "serviceurl": "http://ip:port",
          "source": "discovery",
          "metadata": {
            "preserved.heart.beat.timeout": "5000",
            "nacos.instanceid": "xxxxxx",
            "nacos.weight": "1.0",
            "nacos.cluster": "default",
            "nacos.ephemeral": "true",
            "nacos.healthy": "true",
            "preserved.register.source": "spring_cloud",
            "preserved.heart.beat.interval": "5000"
          }
        },
        "registered": true,
        "statusinfo": {
          "status": "up",
          "details": {
            "diskspace": {
              "status": "up",
              "details": {
                "total": 11111,
                "free": 11111,
                "threshold": 11111,
                "exists": true
              }
            },
            "ping": {
              "status": "up"
            }
          }
        },
        "statustimestamp": "2024-09-03t05:18:26.492z",
        "info": {
        },
        "endpoints": [
          {
            "id": "sentinel",
            "url": "http://ip:port/actuator/sentinel"
          },
          {
            "id": "caches",
            "url": "http://ip:port/actuator/caches"
          },
          {
            "id": "loggers",
            "url": "http://ip:port/actuator/loggers"
          },
          {
            "id": "health",
            "url": "http://ip:port/actuator/health"
          },
          {
            "id": "refresh",
            "url": "http://ip:port/actuator/refresh"
          },
          {
            "id": "env",
            "url": "http://ip:port/actuator/env"
          },
          {
            "id": "nacosdiscovery",
            "url": "http://ip:port/actuator/nacosdiscovery"
          },
          {
            "id": "heapdump",
            "url": "http://ip:port/actuator/heapdump"
          },
          {
            "id": "features",
            "url": "http://ip:port/actuator/features"
          },
          {
            "id": "scheduledtasks",
            "url": "http://ip:port/actuator/scheduledtasks"
          },
          {
            "id": "mappings",
            "url": "http://ip:port/actuator/mappings"
          },
          {
            "id": "archaius",
            "url": "http://ip:port/actuator/archaius"
          },
          {
            "id": "beans",
            "url": "http://ip:port/actuator/beans"
          },
          {
            "id": "configprops",
            "url": "http://ip:port/actuator/configprops"
          },
          {
            "id": "threaddump",
            "url": "http://ip:port/actuator/threaddump"
          },
          {
            "id": "metrics",
            "url": "http://ip:port/actuator/metrics"
          },
          {
            "id": "conditions",
            "url": "http://ip:port/actuator/conditions"
          },
          {
            "id": "service-registry",
            "url": "http://ip:port/actuator/service-registry"
          },
          {
            "id": "info",
            "url": "http://ip:port/actuator/info"
          }
        ],
        "buildversion": null,
        "tags": {
        }
      }
    ]
  }
参考资料:
https://juejin.cn/post/6956483441227464740
开始使用spring boot admin吧-使用nacos注册sba_spring boot admin nacos
springboot admin整合nacos_springboot admin nacos
到此这篇关于spring boot admin集成与自定义监控告警的文章就介绍到这了,更多相关spring boot admin自定义监控告警内容请搜索代码网以前的文章或继续浏览下面的相关文章希望大家以后多多支持代码网!

发表评论