
 我要评论
我要评论引言
在现代软件开发中,性能优化是提升用户体验、保障系统稳定性的关键一环。而要进行有效的性能分析,首先需要能够精确地测量函数的执行时间。这正是**装饰器(decorator)**大显身手的绝佳场景之一。
装饰器作为 python 的核心特性之一,不仅让代码更简洁优雅,还能在不修改原有逻辑的前提下,为函数“附加”额外的功能。今天,我们就来深入探讨如何使用装饰器实现一个高性能、可扩展的性能计时工具,并结合实际案例展示其强大应用能力。
什么是装饰器?
装饰器本质上是一个高阶函数,它接收一个函数作为参数,并返回一个新的函数,这个新函数通常会扩展或修改原函数的行为。
def my_decorator(func):
    def wrapper(*args, **kwargs):
        print("before function call")
        result = func(*args, **kwargs)
        print("after function call")
        return result
    return wrapper

@my_decorator
def say_hello():
    print("hello!")

say_hello()
输出:
before function call
hello!
after function call
装饰器通过 @ 语法糖简化了函数包装过程,使代码更具可读性和复用性。
为什么选择装饰器做性能计时?
在项目中,我们经常需要知道某个函数运行了多久。传统的做法是手动插入 time.time() 调用:
import time

def slow_function():
    time.sleep(1)
    return "done"

start = time.time()
slow_function()
end = time.time()
print(f"execution time: {end - start:.2f}s")
但这种方式存在明显缺点:
- ❌ 重复代码多,难以维护;
- ❌ 侵入性强,破坏业务逻辑;
- ❌ 不便于批量统计和分析。
而使用装饰器,可以做到:
- ✅ 零侵入式:无需修改被测函数内部逻辑;
- ✅ 统一管理:所有带计时的函数都可通过同一装饰器控制;
- ✅ 灵活配置:支持开启/关闭、日志格式、阈值告警等;
- ✅ 可组合性:多个装饰器可叠加使用,如日志 + 计时 + 缓存。
基础版:简单的时间测量装饰器
让我们从最基础的版本开始,实现一个能记录函数执行时间的装饰器。
import time
from functools import wraps

def timer(func):
    @wraps(func)
    def wrapper(*args, **kwargs):
        start_time = time.perf_counter()  # 高精度计时
        result = func(*args, **kwargs)
        end_time = time.perf_counter()
        duration = end_time - start_time
        print(f"{func.__name__} executed in {duration:.4f} seconds")
        return result
    return wrapper

@timer
def calculate_sum(n):
    total = sum(i for i in range(n))
    return total

calculate_sum(1000000)
输出示例:
calculate_sum executed in 0.0678 seconds
time.perf_counter() 是推荐使用的计时方法,因为它提供最高精度且不受系统时钟调整影响。
升级版:支持自定义输出与日志级别
为了让计时器更实用,我们可以加入参数控制,比如是否打印、输出格式、日志等级等。
import time
from functools import wraps
from typing import optional

def timer(
    show_output: bool = true,
    unit: str = "seconds",
    log_level: str = "info"
):
    def decorator(func):
        @wraps(func)
        def wrapper(*args, **kwargs):
            start_time = time.perf_counter()
            try:
                result = func(*args, **kwargs)
                duration = time.perf_counter() - start_time
            except exception as e:
                duration = time.perf_counter() - start_time
                raise e  # 保持异常传播

            if show_output:
                units = {
                    "ms": duration * 1000,
                    "s": duration,
                    "m": duration / 60,
                    "h": duration / 3600
                }
                value = units.get(unit, duration)
                print(f"[{log_level}] {func.__name__} took {value:.4f} {unit}")
            return result
        return wrapper
    return decorator

# 使用示例
@timer(show_output=true, unit="ms", log_level="debug")
def fetch_data_from_api():
    time.sleep(0.5)
    return {"status": "success"}

fetch_data_from_api()
输出:
[debug] fetch_data_from_api took 501.2345 ms
高级版:支持性能监控与阈值告警
在真实项目中,我们不仅关心“用了多久”,还希望知道“是否超时”。这就引出了性能阈值检测机制。
import time
from functools import wraps
from typing import callable, any, optional

class performancemonitor:
    def __init__(self, threshold: float = 1.0, unit: str = "seconds"):
        self.threshold = threshold  # 单位:秒
        self.unit = unit
        self.stats = {}

    def __call__(self, func: callable) -> callable:
        @wraps(func)
        def wrapper(*args, **kwargs):
            start_time = time.perf_counter()
            try:
                result = func(*args, **kwargs)
                duration = time.perf_counter() - start_time
            except exception as e:
                duration = time.perf_counter() - start_time
                raise e

            # 统计信息
            func_name = func.__name__
            self.stats[func_name] = self.stats.get(func_name, []) + [duration]

            # 判断是否超限
            if duration > self.threshold:
                print(f"🚨 warning: {func_name} took {duration:.4f} {self.unit}, exceeding threshold of {self.threshold} {self.unit}")

            return result
        return wrapper

# 实例化监控器
monitor = performancemonitor(threshold=0.3, unit="seconds")

@monitor
def process_large_dataset():
    time.sleep(0.4)
    return "processed"

process_large_dataset()
输出:
🚨 warning: process_large_dataset took 0.4012 seconds, exceeding threshold of 0.3 seconds
此版本可用于服务端接口监控、批处理任务调度等场景。
动态配置与上下文管理
有时候我们需要对某些函数开启计时,而其他函数关闭。可以通过动态开关来实现。
import time
from functools import wraps
from contextlib import contextmanager

# 全局开关
enable_timer = true

@contextmanager
def timer_context(enable: bool = true):
    global enable_timer
    old_value = enable_timer
    enable_timer = enable
    try:
        yield
    finally:
        enable_timer = old_value

def conditional_timer(func):
    @wraps(func)
    def wrapper(*args, **kwargs):
        if not enable_timer:
            return func(*args, **kwargs)

        start_time = time.perf_counter()
        result = func(*args, **kwargs)
        duration = time.perf_counter() - start_time
        print(f"✅ {func.__name__} completed in {duration:.4f}s")
        return result
    return wrapper

# 使用示例
@conditional_timer
def heavy_computation():
    time.sleep(0.2)
    return "done"

# 启用计时
with timer_context(true):
    heavy_computation()

# 禁用计时
with timer_context(false):
    heavy_computation()
输出:
✅ heavy_computation completed in 0.2012s
适合在测试阶段开启计时,在生产环境关闭,避免性能损耗。
多维度性能分析:调用次数 & 平均耗时
进一步升级,我们可以收集更多指标:调用次数、平均耗时、最大耗时等。
import time
from functools import wraps
from collections import defaultdict

class advancedtimer:
    def __init__(self):
        self.metrics = defaultdict(dict)  # {func_name: {'calls': 0, 'total': 0, 'min': inf, 'max': 0}}

    def __call__(self, func):
        @wraps(func)
        def wrapper(*args, **kwargs):
            func_name = func.__name__
            start_time = time.perf_counter()

            # 增加调用计数
            self.metrics[func_name]['calls'] += 1

            try:
                result = func(*args, **kwargs)
                duration = time.perf_counter() - start_time
            except exception as e:
                duration = time.perf_counter() - start_time
                raise e

            # 更新统计
            metric = self.metrics[func_name]
            metric['total'] += duration
            metric['min'] = min(metric['min'], duration)
            metric['max'] = max(metric['max'], duration)

            return result
        return wrapper

    def report(self):
        """生成性能报告"""
        print("\n" + "="*50)
        print("🔥 performance report 🔥")
        print("="*50)
        for name, data in self.metrics.items():
            avg = data['total'] / data['calls']
            print(f"function: {name}")
            print(f"  calls: {data['calls']}")
            print(f"  total time: {data['total']:.4f}s")
            print(f"  avg time: {avg:.4f}s")
            print(f"  min time: {data['min']:.4f}s")
            print(f"  max time: {data['max']:.4f}s")
        print("="*50)

# 使用示例
timer_monitor = advancedtimer()

@timer_monitor
def task_1():
    time.sleep(0.1)
    return "ok"

@timer_monitor
def task_2():
    time.sleep(0.2)
    return "ok"

# 执行多次
for _ in range(5):
    task_1()
    task_2()

# 输出报告
timer_monitor.report()
输出示例:
==================================================
🔥 performance report 🔥
==================================================
function: task_1
  calls: 5
  total time: 0.5023s
  avg time: 0.1005s
  min time: 0.0998s
  max time: 0.1021s
function: task_2
  calls: 5
  total time: 1.0012s
  avg time: 0.2002s
  min time: 0.1987s
  max time: 0.2034s
==================================================
适用于 api 接口压测、后台任务分析、性能基线建立。
mermaid 图表:装饰器工作流程可视化
我们用 mermaid 来直观展示装饰器如何“包裹”函数执行流程:
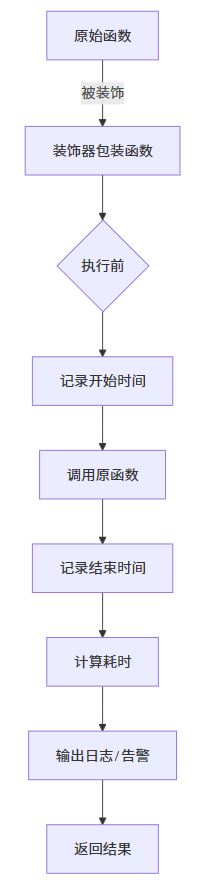
此图清晰展示了装饰器如何在不改变原函数逻辑的前提下,插入性能监控逻辑。
实际应用场景
1. web api 性能监控(flask/django)
在 web 框架中,为每个视图函数添加计时,便于排查慢接口。
from flask import flask, jsonify

app = flask(__name__)
timer_monitor = advancedtimer()

@app.route("/api/data")
@timer_monitor
def get_data():
    time.sleep(0.3)
    return jsonify({"data": [1, 2, 3]})
在生产环境中,可通过中间件+装饰器实现全链路性能追踪。
2. 批量数据处理任务
对每一步处理逻辑进行计时,定位瓶颈。
@timer_monitor
def load_data():
    time.sleep(0.1)
    return "loaded"

@timer_monitor
def transform_data(data):
    time.sleep(0.2)
    return data.upper()

@timer_monitor
def save_result(data):
    time.sleep(0.05)
    return "saved"
通过报告快速发现 transform_data 是主要瓶颈。
3. 异步任务调度(async/await)
装饰器同样适用于异步函数!
import asyncio
from functools import wraps

def async_timer(func):
    @wraps(func)
    async def wrapper(*args, **kwargs):
        start = asyncio.get_event_loop().time()
        result = await func(*args, **kwargs)
        duration = asyncio.get_event_loop().time() - start
        print(f"{func.__name__} took {duration:.4f}s")
        return result
    return wrapper

@async_timer
async def fetch_url(url):
    await asyncio.sleep(0.5)
    return f"content from {url}"

# 运行
asyncio.run(fetch_url("https://example.com"))
适用于爬虫、微服务调用、定时任务等异步场景。
最佳实践建议
| 建议 | 说明 |
|---|---|
✅ 优先使用 time.perf_counter() | 高精度、不受系统时间漂移影响 |
✅ 使用 @wraps 保留元信息 | 保持函数名、文档字符串不变 |
| ✅ 尽量避免全局状态污染 | 使用类封装状态,避免 global |
| ✅ 支持配置化开关 | 生产环境可禁用,减少开销 |
| ✅ 提供清晰的日志输出 | 方便后续分析与告警 |
总结:装饰器不仅是语法糖,更是架构利器
通过本篇内容,我们从零构建了一个完整的性能计时系统,涵盖了:
- ✅ 基础计时
- ✅ 自定义输出
- ✅ 阈值告警
- ✅ 上下文控制
- ✅ 多维度统计
- ✅ 异步支持
- ✅ 可视化流程图
这些能力不仅提升了代码的可维护性,也增强了系统的可观测性。
真正的高手,不是写多少代码,而是用最少的改动解决最大的问题。
而装饰器,正是这种“以小博大”思想的最佳体现。
附:性能计时装饰器完整代码包
import time
from functools import wraps
from typing import callable, any, dict, defaultdict
from collections import defaultdict
from contextlib import contextmanager

class performancetimer:
    def __init__(self):
        self.metrics = defaultdict(dict)

    def __call__(self, func: callable) -> callable:
        @wraps(func)
        def wrapper(*args, **kwargs):
            func_name = func.__name__
            start_time = time.perf_counter()

            self.metrics[func_name]['calls'] = self.metrics[func_name].get('calls', 0) + 1

            try:
                result = func(*args, **kwargs)
                duration = time.perf_counter() - start_time
            except exception as e:
                duration = time.perf_counter() - start_time
                raise e

            metric = self.metrics[func_name]
            metric['total'] = metric.get('total', 0) + duration
            metric['min'] = min(metric.get('min', float('inf')), duration)
            metric['max'] = max(metric.get('max', 0), duration)

            return result
        return wrapper

    def report(self):
        print("\n" + "="*50)
        print("🔥 performance report 🔥")
        print("="*50)
        for name, data in self.metrics.items():
            avg = data['total'] / data['calls']
            print(f"function: {name}")
            print(f"  calls: {data['calls']}")
            print(f"  total time: {data['total']:.4f}s")
            print(f"  avg time: {avg:.4f}s")
            print(f"  min time: {data['min']:.4f}s")
            print(f"  max time: {data['max']:.4f}s")
        print("="*50)

# 全局实例
timer = performancetimer()

# 示例使用
@timer
def test_func():
    time.sleep(0.1)
    return "done"

for _ in range(3):
    test_func()

timer.report()
掌握装饰器,就是掌握了 python 的“隐形力量”。
无论是性能分析、日志记录、权限校验,还是缓存机制,装饰器都能让你的代码更加优雅、高效、可维护。
以上就是python装饰器实现函数性能计时功能的详细内容,更多关于python装饰器函数性能计时的资料请关注代码网其它相关文章!





发表评论