
 我要评论
我要评论在日常工作中,excel 报表无处不在——销售数据、员工绩效、项目进度,几乎每个团队都在用表格管理业务数据。然而,当这些报表需要分享给团队其他成员、客户或领导在线查看时,excel 文件往往显得力不从心:对方可能没有安装 office、不同设备上排版错乱、嵌入到公司内网系统或网页中更是麻烦。手动把表格复制粘贴成网页,不但费时费力,而且极易丢失原有的字体、颜色、边框和图片等格式。
使用 python 代码可以很好地解决这个问题。通过程序化转换,你可以把整个工作表甚至整个工作簿一键转换为 html 网页,自动保留数据的结构与样式,转换过程完全可以自动化、批量执行,非常适合报表在线发布、数据看板展示、定时生成网页报告等场景。
本文将以一个真实的销售数据工作簿为例,演示使用 python 将 excel 转换为 html 的完整流程。本文使用的方法需要用到 free spire.xls for python,可通过 pip 安装:
pip install spire.xls.free
1. 准备演示用 excel 工作簿
为了方便演示,我们先用代码创建一份包含两个工作表和一个嵌入式 logo 图片的示例工作簿:第一个工作表 "quarterly sales" 记录各地区的季度营收,第二个工作表 "employee performance" 记录员工绩效,第三个工作表 "dashboard" 汇总关键指标并插入公司 logo。所有示例内容使用英文,更贴近真实的国际化业务报表:
from spire.xls import *
from spire.xls.common import *

outputfile = "demosalesreport.xlsx"

# 创建新的工作簿
workbook = workbook()
workbook.version = excelversion.version2010

# ============================================================
# 工作表 1:quarterly sales
# ============================================================
sheet1 = workbook.worksheets[0]
sheet1.name = "quarterly sales"

# 写入标题(合并单元格、白色粗体、深蓝背景)
titlecell = sheet1.range["a1"]
titlecell.text = "quarterly sales report — fy2025"
titlecell.style.font.fontname = "calibri"
titlecell.style.font.size = 16
titlecell.style.font.isbold = true
titlecell.style.font.color = color.get_white()
titlecell.style.color = color.fromrgb(0, 70, 127)
titlecell.style.horizontalalignment = horizontalaligntype.center
sheet1.range["a1:e1"].merge()
sheet1.rows[0].rowheight = 36

# 写入副标题
subcell = sheet1.range["a2"]
subcell.text = "prepared by: finance department  |  date: july 2025"
subcell.style.font.isitalic = true
subcell.style.font.color = color.fromrgb(100, 100, 100)
subcell.style.horizontalalignment = horizontalaligntype.center
sheet1.range["a2:e2"].merge()

# 写入表头
headers = ["region", "product category", "q1 revenue (usd)", "q2 revenue (usd)", "growth rate"]
headerrange = sheet1.range["a4:e4"]
for col, h in enumerate(headers):
    headerrange.columns[col].text = h
headerrange.style.font.isbold = true
headerrange.style.font.color = color.get_white()
headerrange.style.color = color.fromrgb(0, 112, 192)
headerrange.style.horizontalalignment = horizontalaligntype.center
headerrange.borders.linestyle = linestyletype.thin

# 写入数据行(带隔行底色)
data = [
    ["north america", "enterprise software",  485000, 562000, 0.158],
    ["north america", "cloud services",        320000, 398000, 0.243],
    ["europe",        "enterprise software",   372000, 401000, 0.078],
    ["europe",        "cloud services",        215000, 276000, 0.283],
    ["asia pacific",  "enterprise software",   298000, 387000, 0.298],
    ["asia pacific",  "cloud services",        186000, 254000, 0.365],
    ["latin america", "enterprise software",   142000, 168000, 0.183],
    ["latin america", "cloud services",         97000, 131000, 0.350],
]
for row_idx, row_data in enumerate(data, start=5):
    for col_idx, value in enumerate(row_data, start=1):
        cell = sheet1.range[row_idx, col_idx]
        if col_idx <= 2:
            cell.text = str(value)
        elif col_idx <= 4:
            cell.numbervalue = float(value)
            cell.style.numberformat = "$#,##0"
        else:
            cell.numbervalue = float(value)
            cell.style.numberformat = "0.0%"
        cell.style.font.fontname = "calibri"
        cell.style.font.size = 10
    # 隔行填充浅色背景
    range_row = sheet1.range[f"a{row_idx}:e{row_idx}"]
    if row_idx % 2 == 1:
        range_row.style.color = color.fromrgb(234, 243, 253)
    else:
        range_row.style.color = color.get_white()

# 写入合计行(使用 sum 公式)
totalrow = 13
sheet1.range[totalrow, 1].text = "total"
sheet1.range[totalrow, 1].style.font.isbold = true
sheet1.range[totalrow, 3].formula = "=sum(c5:c12)"
sheet1.range[totalrow, 3].style.numberformat = "$#,##0"
sheet1.range[totalrow, 3].style.font.isbold = true
sheet1.range[totalrow, 4].formula = "=sum(d5:d12)"
sheet1.range[totalrow, 4].style.numberformat = "$#,##0"
sheet1.range[totalrow, 4].style.font.isbold = true
sheet1.range[totalrow, 5].formula = "=d13/c13-1"
sheet1.range[totalrow, 5].style.numberformat = "0.0%"
sheet1.range[totalrow, 5].style.font.isbold = true

# 设置列宽
sheet1.columns[0].columnwidth = 20
sheet1.columns[1].columnwidth = 22
sheet1.columns[2].columnwidth = 20
sheet1.columns[3].columnwidth = 20
sheet1.columns[4].columnwidth = 15

# ============================================================
# 工作表 2:employee performance
# ============================================================
sheet2 = workbook.worksheets.add("employee performance")
t2 = sheet2.range["a1"]
t2.text = "employee performance review — q2 2025"
t2.style.font.size = 16
t2.style.font.isbold = true
t2.style.font.color = color.get_white()
t2.style.color = color.fromrgb(31, 86, 53)
t2.style.horizontalalignment = horizontalaligntype.center
sheet2.range["a1:f1"].merge()

emp_headers = ["employee id", "full name", "department", "performance score", "projects completed", "status"]
empheaderrange = sheet2.range["a4:f4"]
for col, h in enumerate(emp_headers):
    empheaderrange.columns[col].text = h
empheaderrange.style.font.isbold = true
empheaderrange.style.font.color = color.get_white()
empheaderrange.style.color = color.fromrgb(46, 125, 75)
empheaderrange.style.horizontalalignment = horizontalaligntype.center

emp_data = [
    ["emp-001", "alice johnson",  "engineering", 4.7, 12, "exceeds expectations"],
    ["emp-002", "michael chen",   "engineering", 4.2, 10, "exceeds expectations"],
    ["emp-003", "sarah williams", "marketing",   3.9,  8, "meets expectations"],
    ["emp-004", "david martinez", "sales",       4.5, 15, "exceeds expectations"],
    ["emp-005", "emily thompson", "product",     3.6,  7, "meets expectations"],
    ["emp-006", "james anderson", "finance",     4.1,  9, "meets expectations"],
    ["emp-007", "olivia brown",   "hr",          3.4,  6, "meets expectations"],
    ["emp-008", "robert taylor",  "engineering", 4.8, 14, "exceeds expectations"],
    ["emp-009", "sophia lee",     "marketing",   2.9,  5, "needs improvement"],
    ["emp-010", "daniel garcia",  "sales",       4.3, 11, "exceeds expectations"],
]
for row_idx, row_data in enumerate(emp_data, start=5):
    for col_idx, value in enumerate(row_data, start=1):
        cell = sheet2.range[row_idx, col_idx]
        if col_idx == 4:
            cell.numbervalue = float(value)
            cell.style.numberformat = "0.0"
        elif col_idx == 5:
            cell.numbervalue = float(value)
        else:
            cell.text = str(value)
        cell.style.font.fontname = "calibri"
        cell.style.font.size = 10

# ============================================================
# 工作表 3:dashboard(含 logo 图片)
# ============================================================
sheet3 = workbook.worksheets.add("dashboard")
dashtitle = sheet3.range["a1"]
dashtitle.text = "sales dashboard — fy2025"
dashtitle.style.font.size = 16
dashtitle.style.font.isbold = true
dashtitle.style.font.color = color.get_white()
dashtitle.style.color = color.fromrgb(0, 70, 127)
dashtitle.style.horizontalalignment = horizontalaligntype.center
sheet3.range["a1:d1"].merge()

metrics = [
    ["region", "total revenue (usd)", "market share", "target met"],
    ["north america", 960000, 0.34, "yes"],
    ["europe", 773000, 0.28, "yes"],
    ["asia pacific", 685000, 0.25, "yes"],
    ["latin america", 309000, 0.13, "no"],
]
for r, row_data in enumerate(metrics, start=3):
    for c, value in enumerate(row_data, start=1):
        cell = sheet3.range[r, c]
        cell.text = str(value)
        cell.style.font.size = 11 if r == 3 else 10
        cell.style.font.isbold = (r == 3)
        if r == 3:
            cell.style.font.color = color.get_white()
            cell.style.color = color.fromrgb(0, 112, 192)
        elif c == 2:
            cell.style.numberformat = "$#,##0"

# 在工作表 3 插入公司 logo 图片
sheet3.pictures.add(2, 6, "demologo.png")

# 删除默认的空工作表
for i in range(workbook.worksheets.count - 1, -1, -1):
    if workbook.worksheets[i].name.startswith("sheet"):
        workbook.worksheets.remove(workbook.worksheets[i])

# 计算公式的值,确保转换 html 时合计行有数据
workbook.calculateallvalue()

# 保存工作簿
workbook.savetofile(outputfile, excelversion.version2010)
workbook.dispose()
print(f"sample excel file created: {outputfile}")
说明:
worksheets[0]获取第一个工作表,worksheets.add(name)添加新的工作表range["a1"]通过单元格名称访问,range[row, col]通过行列索引访问numberformat设置数字格式($#,##0表示千分位金额,0.0%表示百分比)formula写入公式,合计行使用sum自动汇总merge()合并单元格生成报表标题pictures.add(row, col, path)将图片插入到指定单元格位置calculateallvalue()提前计算所有公式,这样后续转 html 时合计值可以直接显示出来
运行后生成的 demosalesreport.xlsx 包含三个工作表,是后续 html 转换演示的源文件。在 excel 中打开的效果如下:
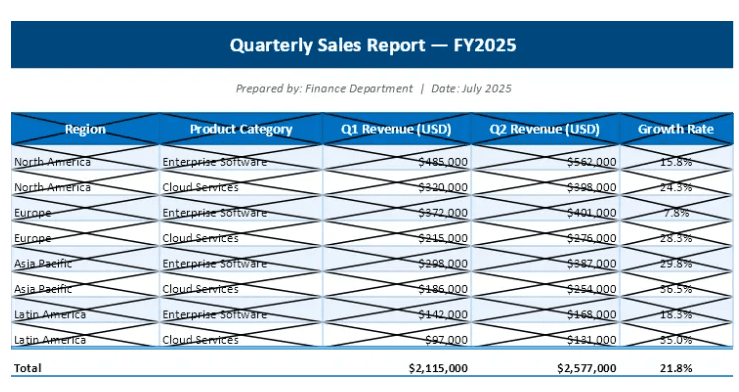
三个工作表分别为:季度销售报表(quarterly sales)、员工绩效表(employee performance)和带 logo 图片的数据看板(dashboard)。
2. 将单个工作表转换为 html
最常见的需求是将某一个工作表转换为独立的 html 文件。加载工作簿后,调用工作表的 savetohtml 方法即可完成转换:
from spire.xls import workbook, htmloptions

inputfile = "demosalesreport.xlsx"
outputfile = "quarterlysales_sheet.html"

# 加载 excel 工作簿
workbook = workbook()
workbook.loadfromfile(inputfile)

# 获取第一个工作表
sheet = workbook.worksheets[0]

# 创建 html 选项并嵌入图片
options = htmloptions()
options.imageembedded = true

# 将工作表转换为 html
sheet.savetohtml(outputfile, options)
workbook.dispose()
print("工作表已转换为 html:quarterlysales_sheet.html")
说明:
loadfromfile()从磁盘加载现有的 excel 文件htmloptions()创建 html 转换选项对象,用于控制转换行为savetohtml(filepath, options)将当前工作表的内容导出为 html 文件workbook.dispose()释放资源
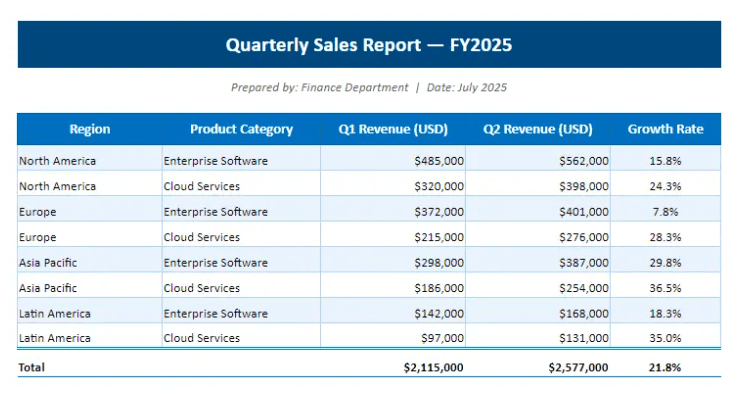
转换后生成的 html 文件可以直接在浏览器中打开,原始的字体、颜色、边框、隔行底色都会保留下来。由于我们在源文件中调用了 calculateallvalue(),合计行的公式结果 $2,115,000、$2,577,000 和 21.8% 也会正确显示在网页中。
浏览器中打开的效果如下:
注意事项:
- 此方法仅转换当前指定的工作表,不包含其他工作表的内容
- 如果工作表包含图片,建议保留
imageembedded = true(在 free 版本中,图片会输出到同名_files文件夹下,并作为外部资源引用) - 生成的 html 是标准网页,可以直接嵌入到其他系统中展示
3. 将整个工作簿转换为 html
当 excel 文件包含多个工作表时,可以直接调用工作簿级别的转换方法,一次性将所有工作表转换为一个带选项卡导航的 html 页面:
from spire.xls import workbook

inputfile = "demosalesreport.xlsx"
outputfile = "demosalesreport.html"

# 加载 excel 工作簿
workbook = workbook()
workbook.loadfromfile(inputfile)

# 将整个工作簿转换为 html(包含所有工作表)
workbook.savetohtml(outputfile)
workbook.dispose()
print("整个工作簿已转换为 html:demosalesreport.html")
说明:
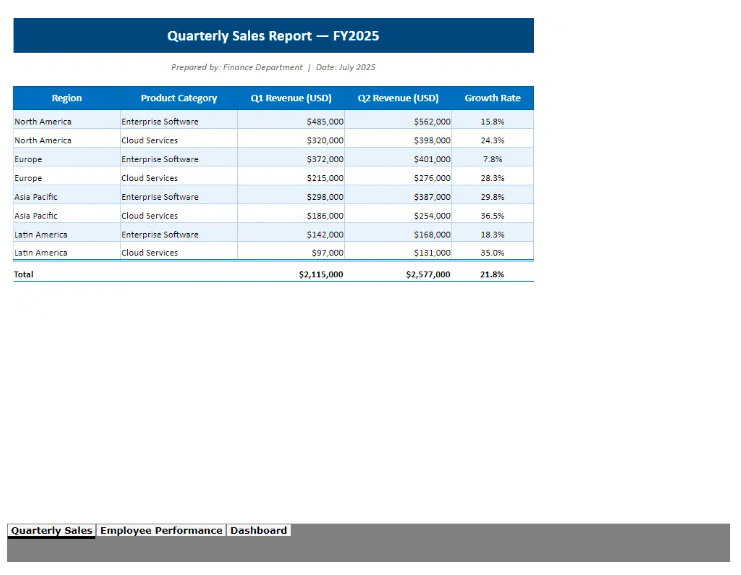
workbook.savetohtml()将工作簿中所有工作表一次性转换为 html- 转换结果是一个主 html 文件(frameset 框架页),自动生成各工作表之间的选项卡导航,点击底部标签即可切换工作表
- 每个工作表对应生成一个独立的 html 文件,存放在以主文件名命名的
_files文件夹中
在浏览器中打开的效果如下,页面下方是自动生成的工作表选项卡,点击即可在各个工作表之间切换:
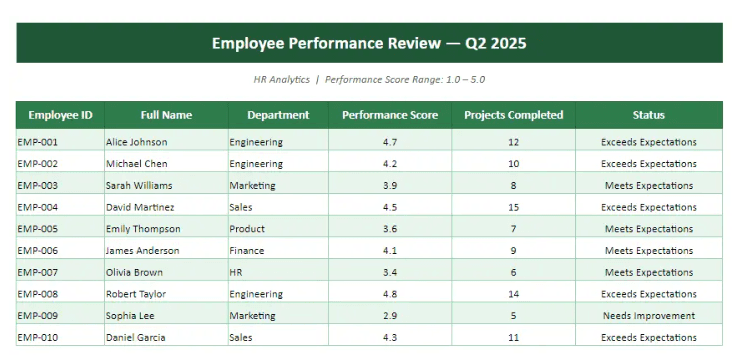
employee performance 工作表对应的 html 文件同样完整保留了原始数据的样式(绿色表头、隔行底色):
转换后的目录结构大致如下:
demosalesreport.html ← 主页面(含框架与导航)
demosalesreport_files/
├── quarterly sales.html ← 工作表 1 内容
├── employee performance.html ← 工作表 2 内容
├── dashboard.html ← 工作表 3 内容
└── tabs.html ← 底部选项卡导航
应用场景:
- 月度综合报表:包含销售、库存、财务等多个维度的数据,一次转换全部发布
- 项目管理文档:任务列表、进度跟踪、资源分配等多个工作表统一展示
- 数据看板:把多个相关报表整合到一个网页中,方便领导集中查看
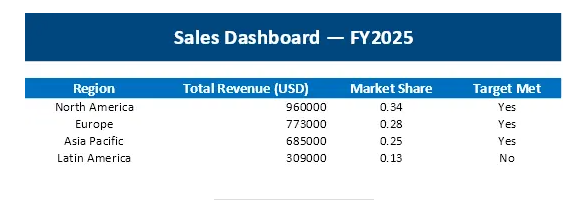
工作簿中的 dashboard 工作表还包含一张嵌入式 logo 图片,转换为 html 后同样可以正常显示:
4. 使用流式输出转换 html
在某些场景下,我们不希望把 html 直接写入磁盘文件,而是想在写入前对内容做进一步处理,或者把转换结果直接送到自定义目标(例如上传到服务器、写入数据库)。这时可以使用流式输出:
from spire.xls import workbook, htmloptions, stream

inputfile = "demosalesreport.xlsx"
outputfile = "quarterlysales_stream.html"

# 加载 excel 工作簿
workbook = workbook()
workbook.loadfromfile(inputfile)

# 获取第一个工作表
sheet = workbook.worksheets[0]

# 设置 html 选项
options = htmloptions()
options.imageembedded = true

# 创建输出流并转换
filestream = stream(outputfile)
sheet.savetohtml(filestream, options)
filestream.close()
workbook.dispose()
print("已通过流式输出转换为 html:quarterlysales_stream.html")
说明:
stream(outputfile)创建文件流对象,用于控制输出过程savetohtml(filestream, options)将工作表内容写入指定的流filestream.close()关闭流并释放资源
优势:
- 可以在写入前对 html 内容进行额外的处理或加工
- 支持自定义输出路径和文件名
- 便于集成到更大的数据处理流程中,例如配合内存流直接上传到云端
5. 关键类与方法解析
workbook 类
workbook 是整个 excel 操作的入口点,代表一个完整的 excel 文件。
常用方法:
| 方法 | 说明 |
|---|---|
loadfromfile(filepath) | 从指定路径加载 excel 文件 |
savetofile(filepath, version) | 将工作簿保存为 excel 文件 |
savetohtml(filepath) | 将整个工作簿转换为 html 文件 |
calculateallvalue() | 计算工作簿中所有公式的值 |
dispose() | 释放工作簿占用的资源 |
常用属性:
| 属性 | 说明 |
|---|---|
worksheets | 获取工作簿中的所有工作表集合 |
worksheet 类
worksheet 代表 excel 中的单个工作表,是数据操作的主要对象。
常用方法:
| 方法 | 说明 |
|---|---|
savetohtml(filepath) | 将当前工作表转换为 html 文件 |
savetohtml(stream, options) | 将工作表转换为 html 并写入流 |
merge() | 合并单元格范围 |
常用属性:
| 属性 | 说明 |
|---|---|
name | 获取或设置工作表名称 |
range | 获取工作表的单元格范围对象 |
pictures | 获取工作表中的图片集合,可通过 add() 添加图片 |
htmloptions 类
htmloptions 用于配置 html 转换的各种选项。
常用属性:
| 属性 | 说明 | 默认值 |
|---|---|---|
imageembedded | 是否将图片嵌入 html(base64 编码) | false |
imagelocationtype | 图片位置的引用方式(globalabsolute 全局绝对路径 / tablerelative 相对路径) | globalabsolute |
isfixedtablecolwidth | 是否使用固定的表格列宽 | false |
textmode | 文本取值方式(numbertext 保留数字格式文本 / value 取原始数值) | numbertext |
styledefine | 样式定义方式(head 定义在 <style> 标签 / inline 内联样式) | head |
使用建议:
- 工作表包含图片时,设置
imageembedded = true可以将图片以 base64 嵌入到单个 html 文件中(商业版支持),free 版本会将图片输出到同目录的_files文件夹中 - 需要独立分发单个 html 文件时,建议嵌入图片;需要保持文件体积小时,可以使用外部引用
textmode使用numbertext(默认)可保留$#,##0这类数字格式,让金额更易读
stream 类
stream 提供流式 i/o 操作,用于灵活控制文件输出。
常用方法:
| 方法 | 说明 |
|---|---|
close() | 关闭流并释放资源 |
使用场景:
- 需要在写入前处理数据
- 需要将输出重定向到自定义目标
- 集成到异步或批量处理流程中
6. 实际应用示例:自动化生成并发布网页报表
下面是一个完整的实际应用场景:将刚才创建的销售工作簿一键生成 excel 和 html 两种格式,方便既存档又在线分享:
from spire.xls import workbook, excelversion, htmloptions

def publish_sales_report(inputfile):
    """将销售工作簿转换为 html 报表"""
    outputhtml = "published_salesreport.html"

    # 加载工作簿
    workbook = workbook()
    workbook.loadfromfile(inputfile)

    # 转换整个工作簿为 html(包含所有工作表和导航)
    workbook.savetohtml(outputhtml)

    # 同时将第一个工作表转为独立 html 文件
    options = htmloptions()
    options.imageembedded = true
    workbook.worksheets[0].savetohtml("published_quarterlysales.html", options)

    workbook.dispose()
    print(f"html 报表已生成:{outputhtml}")
    return outputhtml

# 执行发布
publish_sales_report("demosalesreport.xlsx")
说明:
- 同时使用工作簿级和工作表级转换,兼顾"整体展示"与"单表分享"两种需求
- 转换逻辑封装成函数,便于接入定时任务批量发布
- 无需手工干预,整个过程完全自动化
扩展方向:
- 结合定时任务,实现日报、周报、月报的自动生成与发布
- 将生成的 html 上传到 web 服务器或对象存储,实现团队在线共享
- 结合邮件发送,把 html 报表作为附件自动分发给相关人员
总结
通过本文示例,你已经了解如何使用 python 将 excel 文件转换为 html 格式。从单个工作表的独立转换,到整个工作簿的带导航批量转换,再到流式输出的灵活应用,整个过程高度自动化,特别适用于企业报表发布、数据看板展示、在线文档共享等场景。
相比手动复制粘贴或在线转换工具,基于 python 的代码方式具有以下优势:
- 格式保留完整:自动保留原有的字体、颜色、边框、合并单元格等样式
- 批量处理高效:可以一次性处理多个文件,大幅提升工作效率
- 可定制性强:可以根据需求调整转换选项和输出格式
- 易于集成:可以轻松嵌入到自动化工作流或 web 应用中
你可以在此基础上扩展更多能力,例如结合定时任务实现报表的定时发布,集成到企业内部系统提供实时数据查看,或者对接数据库实现从数据提取到 html 发布的端到端自动化。如果你正在处理 excel 数据的在线展示或自动化报表需求,这种基于 python 的转换方案将为你的工作带来显著提升。
以上就是python实现将excel表格一键转为html网页并保留格式的详细内容,更多关于python excel表格转html的资料请关注代码网其它相关文章!





发表评论