oracle中要想生成 awr(automatic workload repository)报告,最常用的方法是通过 oracle 自带的命令行脚本。awr 报告是分析数据库性能、定位瓶颈的利器,生成步骤并不复杂,主要分为确认权限、执行脚本和选择范围三步。
一、登录数据库
首先,你需要以具有足够权限的数据库管理员账号登录到数据库所在的服务器,并连接到数据库。
打开终端,输入以下命令登录到数据库服务器,并使用 sqlplus 工具以 sysdba(系统管理员)身份连接:
# 切换到 oracle 用户 (通常为 oracle)
su - oracle
# 以 sysdba 身份登录
sqlplus / as sysdba
二、执行 awr 报告生成脚本
登录成功后,执行 oracle 内置的报告生成脚本 awrrpt.sql 。这个脚本会引导你一步步完成报告的生成。
sql> @?/rdbms/admin/awrrpt.sql
命令解释:@表示执行一个 sql 脚本,? 是 $oracle_home 路径的简写。因此,这条命令会完整地定位到该脚本并执行它。
三、选择报告类型与时间范围
脚本执行后,系统会提示你进行几个简单的选择,按需输入即可
3.1.选择报告格式
enter value for report_type: html
        1.html:生成html格式,图形化界面,推荐选择
        2.text:生成纯文本格式。
3.2.选择时间范围(最关键的一步)
awr 基于快照来记录性能数据。你需要选择开始快照和结束快照的 id,报告将展示这两个时间点之间的性能情况。
系统会列出最近可用的快照及其对应的时间,例如:
snap     instance     snap started
-------- ------------ -----------------------
   123    orcl        09 apr 2026 10:00
   124    orcl        09 apr 2026 11:00
   125    orcl        09 apr 2026 12:00
指定开始时间:输入你分析时间段的起始快照 id,例如 124
指定结束时间:输入结束快照 id,例如 125
注意:awr 默认每小时自动生成一次快照。如果你的数据库是新安装的,可能需要等待一段时间才能有足够的数据来生成有意义的报告
3.3.指定awr报告名称
enter value for report_name: awr_report_20260409.html
整体示例:
[oracle@rac01 ~]$ sqlplus / as sysdba
sql*plus: release 19.0.0.0.0 - production on thu apr 9 14:41:40 2026
version 19.3.0.0.0
copyright (c) 1982, 2019, oracle.  all rights reserved.
connected to:
oracle database 19c enterprise edition release 19.0.0.0.0 - production
version 19.3.0.0.0
sql> @?/rdbms/admin/awrrpt.sql
specify the report type
~~~~~~~~~~~~~~~~~~~~~~~
awr reports can be generated in the following formats.  please enter the
name of the format at the prompt.  default value is 'html'.
'html'          html format (default)
'text'          text format
'active-html'   includes performance hub active report
enter value for report_type: html
old   1: select 'type specified: ',lower(nvl('&&report_type','html')) report_type from dual
new   1: select 'type specified: ',lower(nvl('html','html')) report_type from dual
type specified:  html
old   1: select '&&report_type' report_type_def from dual
new   1: select 'html' report_type_def from dual
old   1: select '&&view_loc' view_loc_def from dual
new   1: select 'awr_pdb' view_loc_def from dual
current instance
~~~~~~~~~~~~~~~~
db id          db name        inst num       instance       container name
-------------- -------------- -------------- -------------- --------------
 1747225139     orcl                        1 orcl           orcl
instances in this workload repository schema
~~~~~~~~~~~~~~~~~~~~~~~~~~~~~~~~~~~~~~~~~~~~
  db id      inst num   db name      instance     host
------------ ---------- ---------    ----------   ------
* 1747225139     1      orcl         orcl         rac01.exampl
using 1747225139 for database id
using          1 for instance number
specify the number of days of snapshots to choose from
~~~~~~~~~~~~~~~~~~~~~~~~~~~~~~~~~~~~~~~~~~~~~~~~~~~~~~
entering the number of days (n) will result in the most recent
(n) days of snapshots being listed.  pressing <return> without
specifying a number lists all completed snapshots.
enter value for num_days: 1
listing the last day's completed snapshots
instance     db name      snap id       snap started    snap level
------------ ------------ ---------- ------------------ ----------
orcl         orcl                57  09 apr 2026 12:56    1
                                 58  09 apr 2026 14:00    1
specify the begin and end snapshot ids
~~~~~~~~~~~~~~~~~~~~~~~~~~~~~~~~~~~~~~
enter value for begin_snap: 57
begin snapshot id specified: 57
enter value for end_snap: 58
end   snapshot id specified: 58
specify the report name
~~~~~~~~~~~~~~~~~~~~~~~
the default report file name is awrrpt_1_57_58.html.  to use this name,
press <return> to continue, otherwise enter an alternative.
enter value for report_name: awr_report_20260409.html
using the report name awr_report_20260409.html
<html lang="en"><head><title>awr report for db: orcl, inst: orcl, snaps: 57-58</title>
............
............
............
end of report
</body></html>
report written to awr_report_20260409.html
sql>
四、获取报告文件
完成上述选择后,脚本会自动生成报告并保存在你当前登录的目录下。
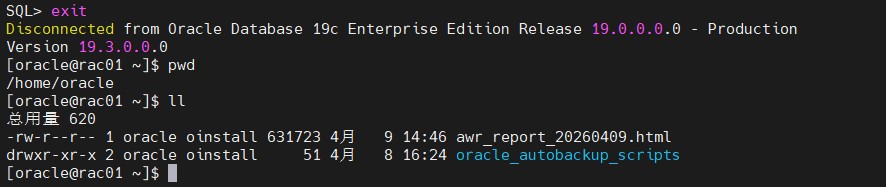
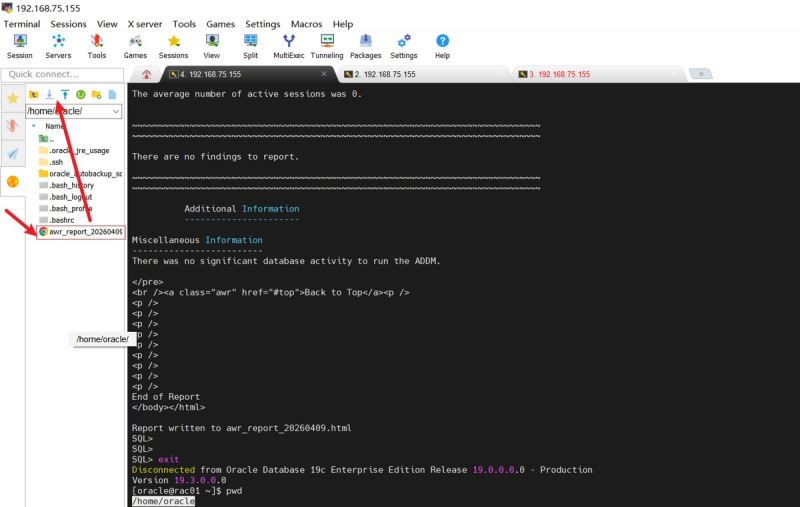
你可以在当前 sqlplus 所在的路径下找到生成的报告文件(例如 awr_report_20260409.html),使用 ls 命令确认后,通过远程工具将其下载到本地,用浏览器打开即可查看。
五、分析awr性能报告
5.1.awr 报告分析入门:五步法
分析一份有实际负载的 awr 报告,通常遵循以下五个核心步骤。你可以把这个方法套用到未来的任何报告分析中。
elapsed:消耗

parse:解析

第一步:看整体负载 —— “数据库忙不忙?”
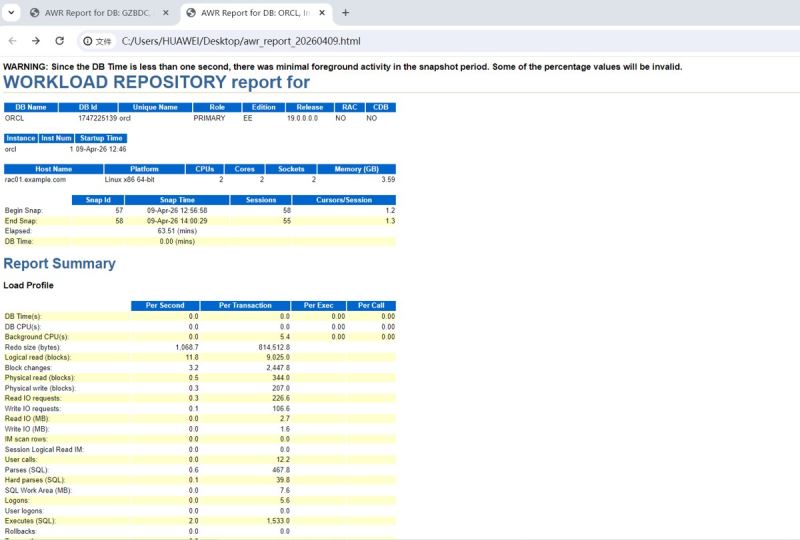
- 核心指标:db time
- 位置:报告开头的 snapshot 信息表和 load profile 部分。
分析方法:
db time 是数据库处理用户请求花费的总时间。将它除以 elapsed time(快照时长),可以算出平均活动会话数。
- 平均活动会话 = db time / elapsed time
- 例如:db time = 100分钟,elapsed time = 10分钟,则平均有 10 个会话在并发工作。
在我的awr报告中分析:db time = 0,则平均活动会话 = 0。结论是数据库处于完全空闲状态。
第二步:看等待事件 —— “瓶颈在哪里?”
- 核心部分:top 10 foreground events by total wait time
- 位置:main report -> wait events statistics -> top 10 foregroud events...
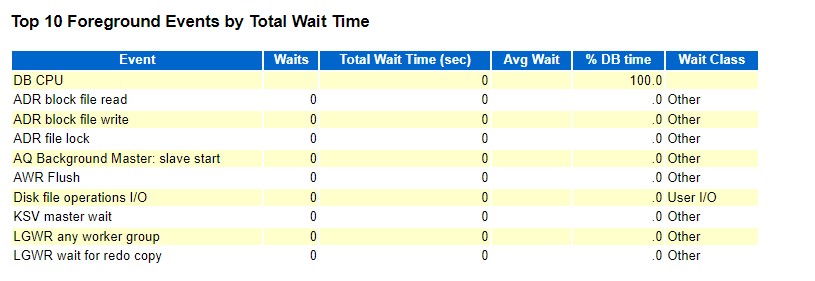
- 分析方法:这里列出了消耗数据库时间最多的“等待”。通过分析等待事件类型,可以快速定位问题。
- cpu:db cpu 排在首位且占比高(例如 > 90%),说明系统在高效计算,而非等待资源。
- i/o 相关: db file sequential / scattered read,说明磁盘 i/o 可能是瓶颈。
- 并发相关:如 buffer busy waits ,说明存在热点数据块争用。
- 网络/配置相关:如 log file sync,说明日志写入可能存在延迟。
- 在我的awr报告分析中:只有 db cpu 和 adr block file read 等少数几个事件,且等待时间(wait time)为 0,说明没有有意义的等待事件。
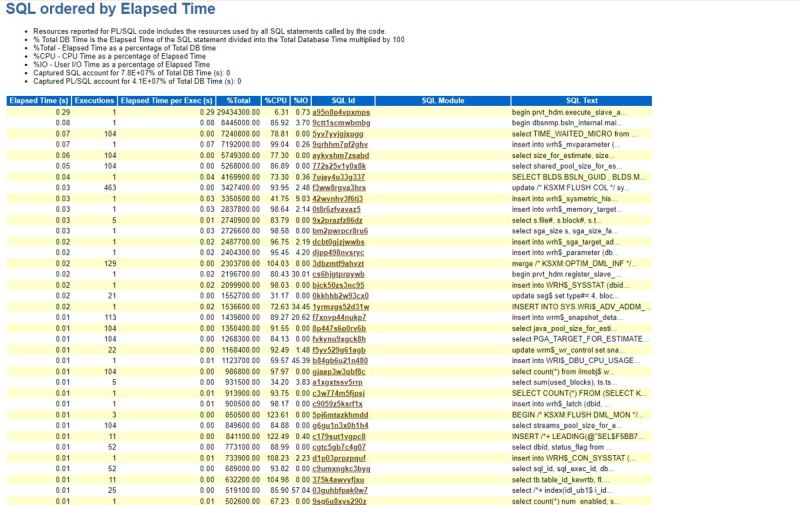
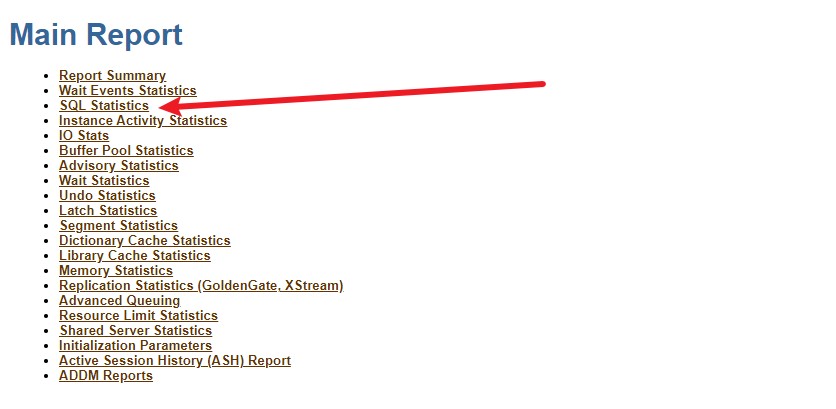
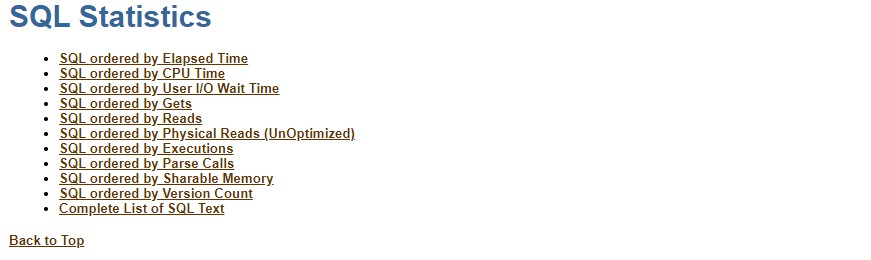
第三步:看 sql 统计 —— “是哪些 sql 在消耗资源?”
- 核心部分:sql statistics
- 位置:main report -> sql statistics -> 重点关注sql ordered by elapsed time和sql ordered by cpu time。
- 分析方法:这个区域会列出消耗资源最多的 sql 语句。
- 重点关注 elapsed time (s)、cpu time (s)、executions(执行次数)、buffer gets(逻辑读)。
- 查找“昂贵”的 sql:单次执行耗时很长,或执行次数非常多的 sql。
- 可以记录下sql id,然后去数据库里用 dbms_sqltune 包或查看执行计划进行优化。
- 报告分析中:此处有数据,但 elapsed time 都远小于 1 秒,%total 的百分比巨大是由于总 db time 为 0 导致的异常。没有需要优化的 sql。
第四步:看时间模型 —— “时间都花在哪儿了?”
- 核心部分:time model statistics
- 位置:main report -> wait events statistics -> time model statisstics。
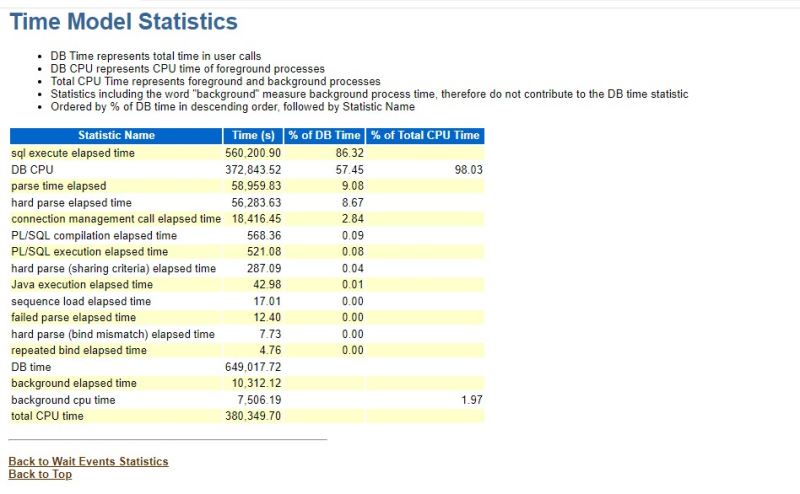
- 分析方法:这里展示了数据库时间花在了前台(db time)还是后台(background time),以及具体花费在解析 sql、硬解析等环节的时间比例。
- 重点关注 parse time elapsed 占总 db time 的比例,如果过高(例如 >10%),说明存在解析问题。
- hard parse elapsed time过高,说明可能存在未使用绑定变量导致的游标缓存失效问题。
第五步:看操作系统和内存 —— “硬件资源够不够?”
- 核心部分:host cpu 和 memory statistics
- 位置:main report -> report summary 和 memory statistics。
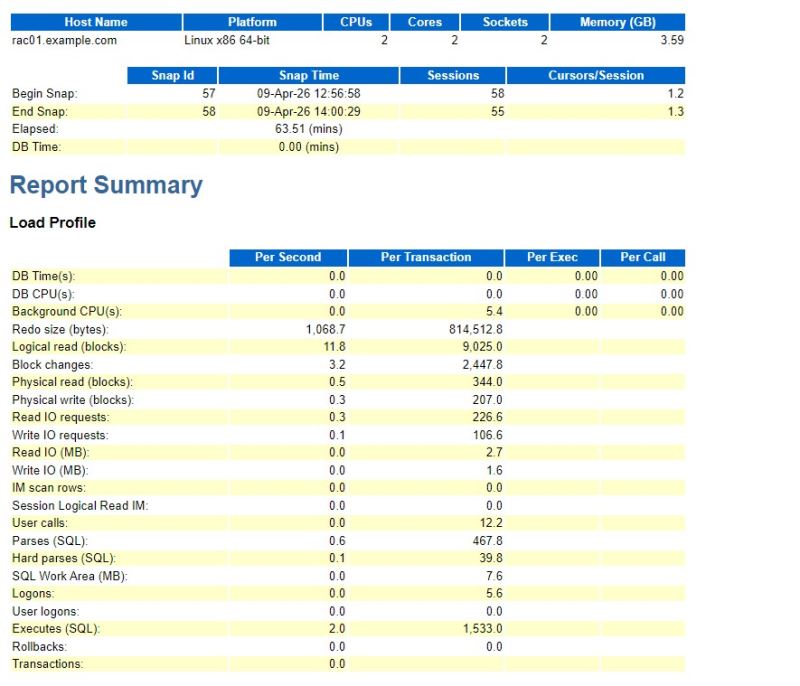
分析方法:
- cpu:查看 load average (系统平均负载)是否超过了逻辑 cpu 总数。你的服务器有 2 个 cpu,load average 仅为 0.3 左右,非常低。
- 内存:查看 memory statistics 中 %host mem used for sga + pga,以及是否存在大量换页(报告中未显示,但可从操作系统层面查看)。
- 报告分析:cpu 和内存资源都非常充足。
以上就是oracle数据库awr报告的生成步骤与分析方法的详细内容,更多关于oracle awr报告生成与分析的资料请关注代码网其它相关文章!


发表评论