说明:本文介绍spring boot actuator的使用,关于spring boot actuator介绍,下面这篇博客写得很好,珠玉在前,我就不多介绍了。
项目里引入下面这个依赖
<!--spring boot actuator依赖-->
<dependency>
	<groupid>org.springframework.boot</groupid>
	<artifactid>spring-boot-starter-actuator</artifactid>
</dependency>
增加以下配置,开放所有默认接口
management:
  endpoints:
    web:
      exposure: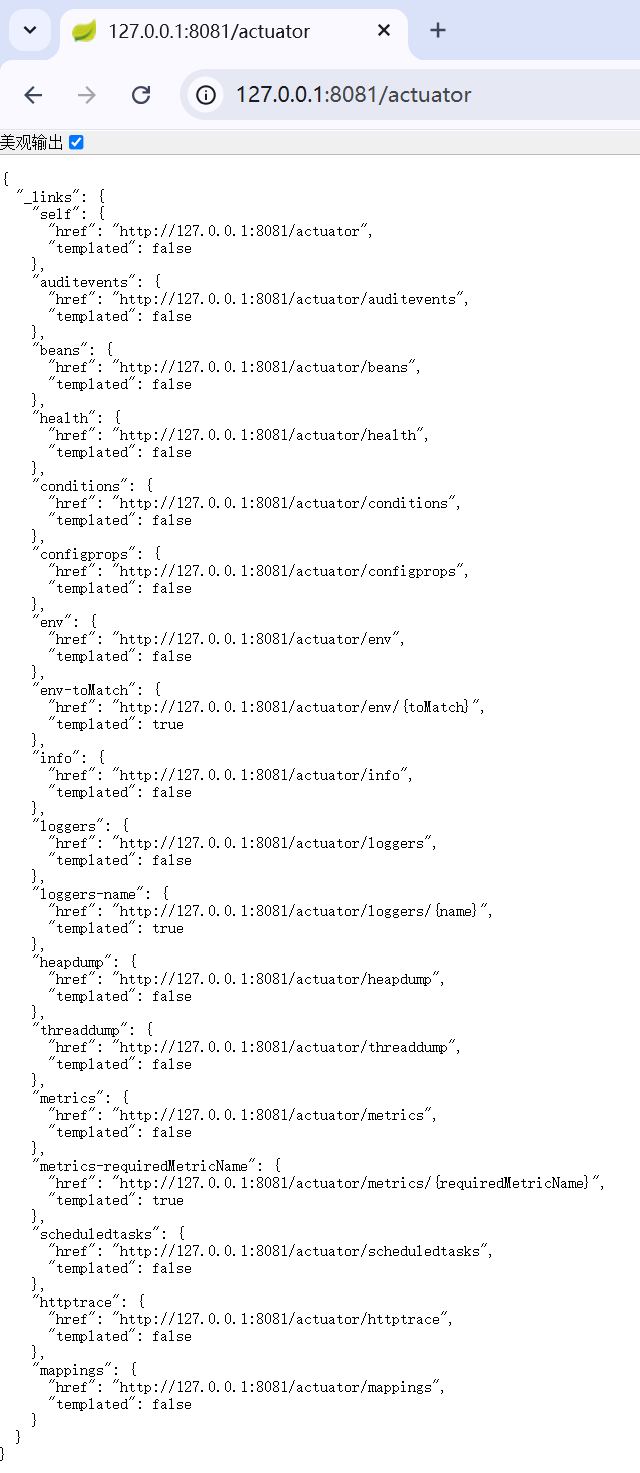
include: "*"启动项目,浏览器输入:http://127.0.0.1:8081/actuator,可见以下接口信息
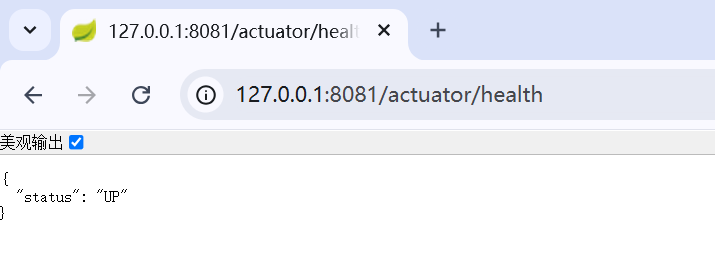
输入某个详细的接口名称,如:http://127.0.0.1:8081/actuator/health,查询详细的内容,如下:
配置文件中,添加配置,查看更详细的内容
management:
# 开放所有接口
endpoints:
web:
exposure:
include: "*"
# 单个接口设置
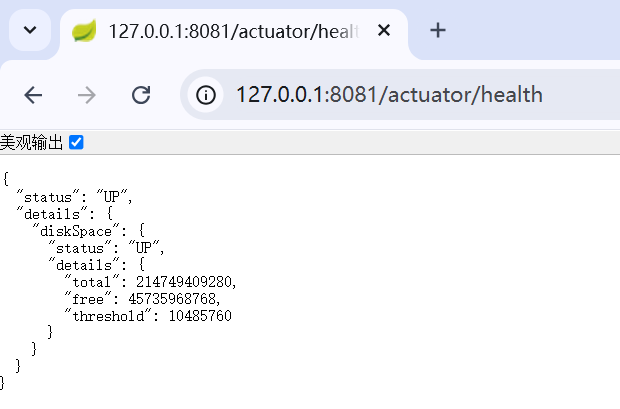
endpoint:
health:
show-details: always如下:
手动自定义一个接口,如下:
import org.springframework.boot.actuate.endpoint.annotation.endpoint;
import org.springframework.boot.actuate.endpoint.annotation.readoperation;
import org.springframework.stereotype.component;
@component
@endpoint(id = "my-actuator")
public class myactuator {
    @readoperation
    public string hello() {
        return "good luck";
    }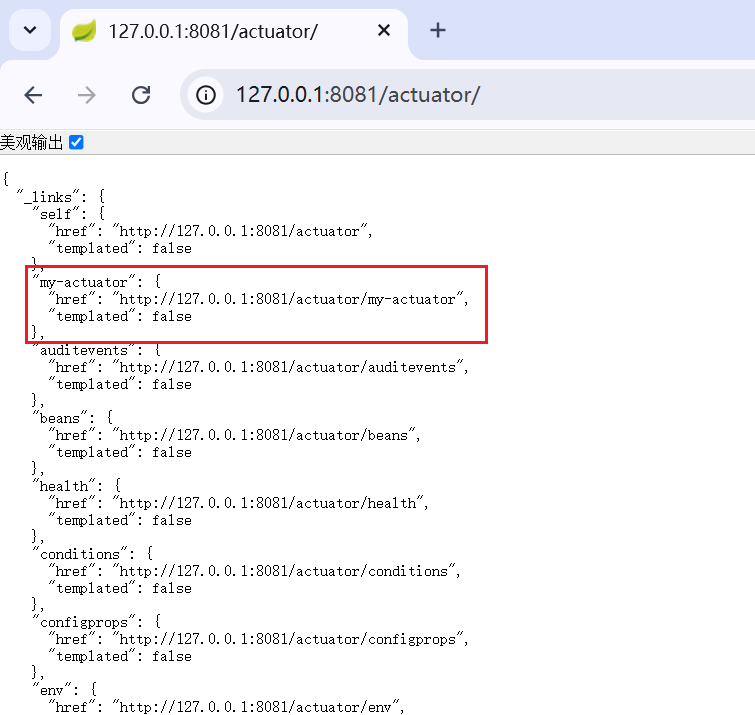
}其中@endpoint(id = "my-actuator"),可以等同于@requestmapping("/my-actuator"),浏览器敲:http://127.0.0.1:8081/actuator/,可见自定义的接口,如下:
浏览器输:http://127.0.0.1:8081/actuator/my-actuator,可见接口返回
使用场景
通过上面的简单使用,可以看到 spring boot actuator与我们常写的接口是分别开的,有点像swagger。他可以有以下的使用场景:
- 健康检查:默认的health就是用来扩展健康检查的,我们可以在代码里去扩展这个接口,来实现自己的健康检查操作;
- 监控:可以写一些接口,接口内返回运行时系统内的一些指标,收集起来,观测运行时的情况;
- 统计:如上,有些数据是“活”的,不存数据库或者日志里,服务停止,数据就消失了,这些数据就可以在接口里返回,用于统计;
- 排查问题:有些数据可能是存在本地缓存,如某个map中的,就可以写一个接口,返回该map中的数据,用于排查问题;
- ……
可以把spring boot actuator当做玻璃窗,能观察到运行时系统的内部情况。当然,用常规的接口也能实现,但不方便,因为要考虑如何在鉴权框架中排出掉这些接口,以及如何对此类接口进行管理,这就不能像spring boot actuator这样得心应手——spring boot actuator可以通过配置文件来控制。
总结
本文介绍了spring boot actuator的简单使用
到此这篇关于spring boot actuator使用的文章就介绍到这了,更多相关spring boot actuator使用内容请搜索代码网以前的文章或继续浏览下面的相关文章希望大家以后多多支持代码网!

发表评论