前言
在开发过程中,我们经常需要生成包含动态数据和图表的 word 报告。本文将介绍如何结合 poi-tl 和 jfreechart,实现动态生成 word 报告的功能,并分享一些实际开发中的踩坑经验。
word生成方案:
- freemarker+ftl
- pot-tl模板替换
- poi硬编码
一、需求背景
在之前的文章中,我们已经介绍了如何使用模板替换、复杂表格和图片插入等功能。此次的需求是生成一个包含统计图的 word 报告,统计图需要根据动态数据生成。面临的主要问题包括:
- 选择 word 生成方案:如何在 word 中动态插入数据和图表?
- 图片插入方案:如何将生成的统计图插入到 word 中?
- 生成统计图表方案:如何根据数据动态生成统计图?
二、方案分析
- poi 硬编码
直接使用 apache poi 硬编码生成 word 文档,虽然可行,但代码复杂且难以维护,因此不推荐。 - freemarker + ftl
freemarker 可以实现文本替换和图片插入,理论上符合需求。但 ftl 模板的维护较为繁琐,尤其是在处理复杂表格和图片时。 - poi-tl + jfreechart
poi-tl 是一个基于 apache poi 的模板引擎,支持文本替换、图片插入等功能。结合 jfreechart 生成统计图,可以很好地满足需求。
三、 poi-tl + jfreechart 实现
关于jfreechart请移步java使用jfreechart创建动态图表的代码示例_java_代码网
3.1 maven 依赖
首先,需要在项目中引入 poi-tl 和 jfreechart 的依赖。注意 poi 和 poi-tl 的版本需要对应,否则可能会出现 nosuchmethod 等错误。
<dependency>
		    <groupid>org.apache.poi</groupid>
		    <artifactid>poi-ooxml</artifactid>
		    <version>4.1.2</version>
		</dependency>
		<dependency>
		    <groupid>org.apache.poi</groupid>
		    <artifactid>poi-scratchpad</artifactid>
		    <version>4.1.2</version>
		</dependency>
		<dependency>
		    <groupid>org.apache.poi</groupid>
		    <artifactid>poi-excelant</artifactid>
		    <version>4.1.2</version>
		</dependency>
		<dependency>
		    <groupid>org.apache.poi</groupid>
		    <artifactid>poi-ooxml-schemas</artifactid>
		    <version>4.1.2</version>
		</dependency>
		<dependency>
			<groupid>org.jfree</groupid>
			<artifactid>jfreechart</artifactid>
			<version>1.5.3</version>
		</dependency>
		<dependency>
			<groupid>com.deepoove</groupid>
			<artifactid>poi-tl</artifactid>
			<version>1.10.0</version>
		</dependency>
3.2 word模板设置
在 word 模板中,使用占位符标记需要替换的内容。对于图片,需要在占位符前加 @,例如:
- 替换文本:时间 -> ${date}
- 插入图片:${@dailyonlinepic}
3.3 实现代码
以下是核心实现代码:
private static final string template_path = "classpath:template/report.docx";
private static final string output_dir = "d:/data/upload/analysis/";
private static final string pic_dir = output_dir + "pic/";
public void getword(string curdistcode) {
try {
// 获取模板文件
file file = resourceutils.getfile(template_path);
// 构建模板替换的数据
map<string, object> datamap = buildtemplatedata(curdistcode);
// 生成最终文件路径
string filename = uuidutil.genuuid32() + ".docx";
string filepath = output_dir + filename;
// 使用 poi-tl 渲染模板并保存
try (xwpftemplate template = xwpftemplate.compile(file, configure.newbuilder().buildgramer("${", "}").build())
.render(datamap)) {
template.writetofile(filepath);
}
//上传文件返回附件id
} catch (exception e) {
e.printstacktrace();
}
}
private map<string, object> buildtemplatedata(string curdistcode) throws ioexception {
map<string, object> datamap = new hashmap<>();
// 设置日期和在线总数
datamap.put("date", localdate.now());
// 查询设备数据
datamap.put("onlinetotal", 100);
// 生成每日在线图表
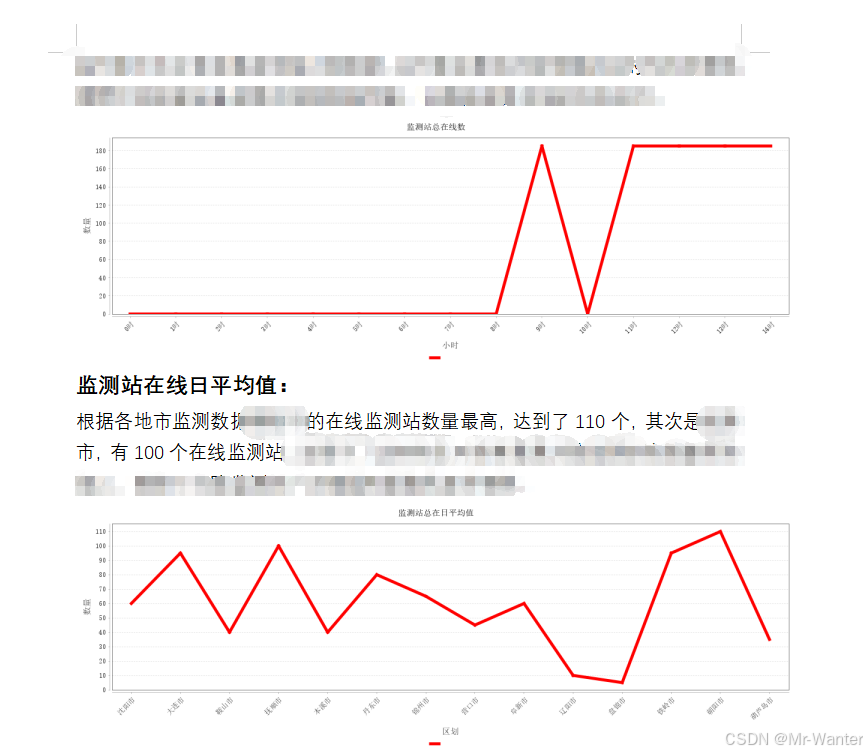
defaultcategorydataset dailydata = builddailydataset(stationbytime);
string dailypicfile = generatechart(dailydata, "监测站总在线数", "小时", "数量", dailyonlinetxtenum);
datamap.put("dailyonlinepic", pictures.ofstream(new fileinputstream(dailypicfile), picturetype.jpeg).size(600, 200).create());
return datamap;
}
// 构建每日在线图表的数据集
private defaultcategorydataset builddailydataset(list<firestationbytimedto> stationbytime) {
defaultcategorydataset dataset = new defaultcategorydataset();
stationbytime.foreach(t -> dataset.addvalue(t.getonlinenum(), "", t.gettime()));
return dataset;
}
// 生成图表并保存为图片
private string generatechart(defaultcategorydataset dataset, string title, string xaxislabel, string yaxislabel, dailyonlinetxtenum style) throws ioexception {
// 设置全局字体(支持中文)
standardcharttheme charttheme = new standardcharttheme("cn");
charttheme.setextralargefont(new font("宋体", font.plain, 14)); // 标题字体
charttheme.setlargefont(new font("宋体", font.plain, 14)); // 图例字体
charttheme.setregularfont(new font("宋体", font.plain, 12)); // 轴标签字体
chartfactory.setcharttheme(charttheme);
// 创建图表
jfreechart chart = chartfactory.createlinechart(title, xaxislabel, yaxislabel, dataset);
setchartstyle(chart, style);
// 保存图表为图片
string picfile = pic_dir + uuidutil.genuuid32() + ".png";
//int numberofcategories = dataset.getcolumncount();
//int width = math.max(800, numberofcategories * 50); // 每个类别宽度为50,最小宽度为800
chartutils.savechartaspng(new file(picfile), chart, 1200, 400);
return picfile;
}
// 设置图表样式
private void setchartstyle(jfreechart chart) {
categoryplot plot = chart.getcategoryplot();
chart.setbackgroundpaint(color.white);
plot.setbackgroundpaint(color.white);
plot.setdomaingridlinepaint(color.light_gray);
plot.setrangegridlinepaint(color.light_gray);
// 设置第一条折线的粗细
plot.getrenderer().setseriesstroke(0, new basicstroke(5.0f));
// 根据样式设置折线颜色
plot.getrenderer().setseriespaint(0, color.red);
}
效果
踩坑
- 插入图片如何占位
与常规文本替换不同,图片插入需要在占位符前加 @,例如${@dailyonlinepic}或{{@pic}} - 统计图中文乱码
jfreechart 默认不支持中文,需要通过设置全局字体解决:
       // 设置全局字体(支持中文)
        standardcharttheme charttheme = new standardcharttheme("cn");
        charttheme.setextralargefont(new font("宋体", font.plain, 14)); // 标题字体
        charttheme.setlargefont(new font("宋体", font.plain, 14));     // 图例字体
        charttheme.setregularfont(new font("宋体", font.plain, 12));   // 轴标签字体
        chartfactory.setcharttheme(charttheme);
- 统计图横坐标…
如果生成的图片宽度不够,横坐标可能会显示不全。可以通过增加图片宽度解决,插入时等比例缩放:
chartutils.savechartaspng(new file(picfile), chart, 1200, 400);
datamap.put("dailyonlinepic",
pictures.ofstream(new fileinputstream(dailypicfile), picturetype.jpeg).size(600, 200).create());
或动态计算需要生成的图片宽度:
int numberofcategories = dataset.getcolumncount();
int width = math.max(800, numberofcategories * 50); // 每个类别宽度为50,最小宽度为800
到此这篇关于java使用poi-tl和jfreechart动态生成word报告的文章就介绍到这了,更多相关java poi-tl jfreechart生成word报告t内容请搜索代码网以前的文章或继续浏览下面的相关文章希望大家以后多多支持代码网!


发表评论