介绍
今天,我运用拉格朗日插值法绘制了一条曲线。然而,我并未止步于静态展示,而是引入了一个定时器,每隔一段时间便对曲线上的点进行动态更新,从而赋予曲线生命般的动态变化。
然而,在刷新过程中,我敏锐地察觉到曲线之间的切换显得过于突兀,缺乏流畅感(请见下图)。于是,一个大胆的想法在我脑海中闪现:何不尝试构造一个曲线过渡算法,以实现曲线切换时的平滑过渡?这不仅将提升视觉效果,更将为动态曲线的展示增添一抹细腻与和谐。

在具体实现之前,我们先了解下拉格朗日插值法。
拉格朗日插值法
拉格朗日插值法是一种用于在给定数据点之间进行多项式插值的方法。
该方法可以找到一个多项式,该多项式恰好穿过二维平面上若干个给定数据点。
拉格朗日插值多项式
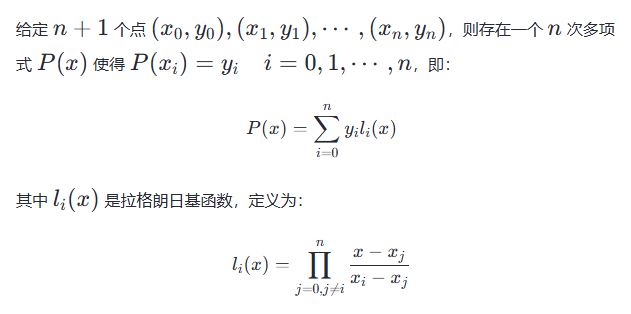
拉格朗日插值多项式的代码实现
function lagrange(x, points) {
    const n = points.length;
    const result = [];

    for (let i = 0; i < n; i++) {
        let tmp = points[i].y;
        for (let j = 0; j < n; j++) {
            if (j !== i) {
                tmp *= (x - points[j].x) / (points[i].x - points[j].x);
            }
        }
        result.push(tmp);
    }

    return result.reduce((sum, cur) => sum + cur, 0);
}
实现曲线突兀切换
我们首先完整实现一下开头介绍部分图片所展示的效果代码:
<!doctype html>
<html lang="zh-cn">

<head>
    <meta charset="utf-8">
    <meta name="viewport" content="width=device-width, initial-scale=1.0">
    <title>canvas</title>
    <style>
        body {
            font-family: arial, sans-serif;
            margin: 0;
            padding: 0;
            display: flex;
            justify-content: center;
            align-items: center;
            height: 100vh;
            background-color: #f0f0f0;
        }

        canvas {
            border-radius: 15px;
            background-color: #ffffff;
        }
    </style>
</head>

<body>
    <canvas id="demo-canvas" width="800" height="600"></canvas>

    <script>
        const canvas = document.getelementbyid('demo-canvas');
        const ctx = canvas.getcontext('2d');

        let points = [];

        function drawline(x1, y1, x2, y2, color) {
            ctx.beginpath();
            ctx.moveto(x1, y1);
            ctx.lineto(x2, y2);
            ctx.strokestyle = color;
            ctx.stroke();
        }

        function lagrange(x, points) {
            const n = points.length;
            const result = [];

            for (let i = 0; i < n; i++) {
                let tmp = points[i].y;
                for (let j = 0; j < n; j++) {
                    if (j !== i) {
                        tmp *= (x - points[j].x) / (points[i].x - points[j].x);
                    }
                }
                result.push(tmp);
            }

            return result.reduce((sum, cur) => sum + cur, 0);
        }

        function fillpoints() {
            const randomnumber = (min, max) => {
                const randombuffer = new uint32array(1);
                window.crypto.getrandomvalues(randombuffer);
                const number = randombuffer[0] / (0xffffffff + 1);
                return number * (max - min + 1) + min;
            }

            points = [];

            const count = 7;

            for (let i = 0; i < count; i++) {
                points.push({
                    x: (i + 1) * 100,
                    y: randomnumber(200, 400)
                });
            }
        }

        function draw() {
            ctx.clearrect(0, 0, canvas.width, canvas.height);

            fillpoints();

            const step = 1;

            for (let x = points[0].x; x < points[points.length - 1].x; x += step) {
                drawline(x, lagrange(x, points), x + step, lagrange(x + step, points), 'red');
            }

            settimeout(draw, 1000);
        }

        draw();
    </script>
</body>

</html>
实现曲线平滑切换
简单构思一下,解决方案其实非常简单:只需保存当前曲线与下一条曲线,然后在每个横坐标 x 值上,两条曲线分别具有两个纵坐标 y 值,通过利用这两个 y 值,我们可以构建一条 111 阶贝塞尔曲线进行插值,其他位置上的点重复同样的步骤,在相同的时间内完成插值即可实现曲线的平滑切换。
原理图如下:

开始行动,我们首先构造 111 阶贝塞尔曲线:
b(t)=(1−t)p 0 +tp 1 0≤t≤1
其中 p0为当前曲线的纵坐标,p1为下一条曲线的纵坐标,ttt 为插值系数。
function bezier(t, y0, y1) {
    return (1 - t) * y0 + t * y1;
}
然后,我们构造用于保存下一条曲线控制点的数组 nextpoints:
let nextpoints = [];
对应的填充曲线控制点的函数 fillpoints 也需要做相应调整:
function fillpoints() {
    const randomnumber = (min, max) => {
        const randombuffer = new uint32array(1);
        window.crypto.getrandomvalues(randombuffer);
        const number = randombuffer[0] / (0xffffffff + 1);
        return number * (max - min + 1) + min;
    }

    const count = 7;

    if (points.length === 0 && nextpoints.length === 0) {
        for (let i = 0; i < count; i++) {
            points.push({
                x: (i + 1) * 100,
                y: randomnumber(200, 400)
            });
            nextpoints.push({
                x: (i + 1) * 100,
                y: randomnumber(200, 400)
            });
        }
    }
    else {
        points = [];
        points = nextpoints;
        nextpoints = [];

        for (let i = 0; i < count; i++) {
            nextpoints.push({
                x: (i + 1) * 100,
                y: randomnumber(200, 400)
            });
        }
    }
}
fillpoints 函数在第一次运行时填充两条曲线控制点,之后每次运行时,先将 nextpoints 中的数据复制到 points 中,最后填充下一条曲线控制点到 nextpoints 中。
然后,我们构造用于平滑切换的动画函数 animate:
let t = 0;

function animate() {
    ctx.clearrect(0, 0, canvas.width, canvas.height);

    const step = 1;

    for (let x = points[0].x; x < points[points.length - 1].x; x += step) {
        const y = bezier(t, lagrange(x, points), lagrange(x, nextpoints));
        const y_step = bezier(t, lagrange(x + step, points), lagrange(x + step, nextpoints));

        drawline(x, y, x + step, y_step, 'red');
    }

    t += 0.05;

    if (t < 1) {
        requestanimationframe(animate);
    }
}
animate 函数在每次调用中的第一次运行时需要保证 t 值为 0,然后通过调用 requestanimationframe(animate) 函数反复执行 animate 函数完成动画绘制,直到 t 值达到 1 时,动画结束。
最后,我们对绘制函数 draw 做相应调整:
function draw() {
    ctx.clearrect(0, 0, canvas.width, canvas.height);

    fillpoints();

    const step = 1;
    t = 0;

    for (let x = points[0].x; x < points[points.length - 1].x; x += step) {
        drawline(x, lagrange(x, points), x + step, lagrange(x + step, points), 'red');
    }

    animate();

    settimeout(draw, 1000);
}
保证绘制完当前的曲线后,立即调用 animate 函数完成平滑切换,最后通过 settimeout 函数定时反复调用 draw 函数完成动画循环。
完整代码
<!doctype html>
<html lang="zh-cn">

<head>
    <meta charset="utf-8">
    <meta name="viewport" content="width=device-width, initial-scale=1.0">
    <title>canvas</title>
    <style>
        body {
            font-family: arial, sans-serif;
            margin: 0;
            padding: 0;
            display: flex;
            justify-content: center;
            align-items: center;
            height: 100vh;
            background-color: #f0f0f0;
        }

        canvas {
            border-radius: 15px;
            background-color: #ffffff;
        }
    </style>
</head>

<body>
    <canvas id="demo-canvas" width="800" height="600"></canvas>

    <script>
        const canvas = document.getelementbyid('demo-canvas');
        const ctx = canvas.getcontext('2d');

        let points = [], nextpoints = [];

        function drawline(x1, y1, x2, y2, color) {
            ctx.beginpath();
            ctx.moveto(x1, y1);
            ctx.lineto(x2, y2);
            ctx.strokestyle = color;
            ctx.stroke();
        }

        function lagrange(x, points) {
            const n = points.length;
            const result = [];

            for (let i = 0; i < n; i++) {
                let tmp = points[i].y;
                for (let j = 0; j < n; j++) {
                    if (j !== i) {
                        tmp *= (x - points[j].x) / (points[i].x - points[j].x);
                    }
                }
                result.push(tmp);
            }

            return result.reduce((sum, cur) => sum + cur, 0);
        }

        function bezier(t, y0, y1) {
            return (1 - t) * y0 + t * y1;
        }

        function fillpoints() {
            const randomnumber = (min, max) => {
                const randombuffer = new uint32array(1);
                window.crypto.getrandomvalues(randombuffer);
                const number = randombuffer[0] / (0xffffffff + 1);
                return number * (max - min + 1) + min;
            }

            const count = 7;

            if (points.length === 0 && nextpoints.length === 0) {
                for (let i = 0; i < count; i++) {
                    points.push({
                        x: (i + 1) * 100,
                        y: randomnumber(200, 400)
                    });
                    nextpoints.push({
                        x: (i + 1) * 100,
                        y: randomnumber(200, 400)
                    });
                }
            }
            else {
                points = [];
                points = nextpoints;
                nextpoints = [];

                for (let i = 0; i < count; i++) {
                    nextpoints.push({
                        x: (i + 1) * 100,
                        y: randomnumber(200, 400)
                    });
                }
            }
        }

        let t = 0;

        function animate() {
            ctx.clearrect(0, 0, canvas.width, canvas.height);

            const step = 1;

            for (let x = points[0].x; x < points[points.length - 1].x; x += step) {
                const y = bezier(t, lagrange(x, points), lagrange(x, nextpoints));
                const y_step = bezier(t, lagrange(x + step, points), lagrange(x + step, nextpoints));

                drawline(x, y, x + step, y_step, 'red');
            }

            t += 0.05;

            if (t < 1) {
                requestanimationframe(animate);
            }
        }

        function draw() {
            ctx.clearrect(0, 0, canvas.width, canvas.height);

            fillpoints();

            const step = 1;
            t = 0;

            for (let x = points[0].x; x < points[points.length - 1].x; x += step) {
                drawline(x, lagrange(x, points), x + step, lagrange(x + step, points), 'red');
            }

            animate();

            settimeout(draw, 1000);
        }

        draw();
    </script>
</body>

</html>
展示
以上就是使用javascript实现随机曲线之间进行平滑切换的详细内容,更多关于javascript曲线平滑切换的资料请关注代码网其它相关文章!


发表评论