1. 导入环境
import numpy as np
import matplotlib.pyplot as plt

from ipython import display
from datetime import datetime
from datetime import date
2. 绘图方法
def myplot(x, y, label=none, xlimit=none, size=(9, 3),filename=none):
    display.set_matplotlib_formats('svg')
    if len(x) == len(y):
        plt.figure(figsize=size)
        if xlimit and isinstance(xlimit, tuple):
            plt.xlim(xlimit)
        plt.plot(x, y, label=label)
        if label and isinstance(label, str):
            plt.legend()
        if filename:
            plt.savefig(filename)
        plt.show()
    else:
        raise valueerror("x 和 y 的长度不一致!")
3. 绘图
原始横坐标数组是一个字符串型的,无法直接用于plot(x, y)中的x
time[0:10]
array([['2019-01-01 00:14:00'],
       ['2019-01-01 00:29:00'],
       ['2019-01-01 00:44:00'],
       ['2019-01-01 00:59:00'],
       ['2019-01-01 01:14:00'],
       ['2019-01-01 01:29:00'],
       ['2019-01-01 01:44:00'],
       ['2019-01-01 01:59:00'],
       ['2019-01-01 02:14:00'],
['2019-01-01 02:29:00']], dtype='<u19')将字符串的时间转换成date对象
x_time= [datetime.strptime(d, '%y-%m-%d %h:%m:%s') for d in time]
绘图
myplot(x_time, y_num, label='car_num',
       xlimit=(date(2019, 1, 1), date(2019, 1, 22) ),
       size=(12, 3),
       filename='my_dataset-car-num.svg')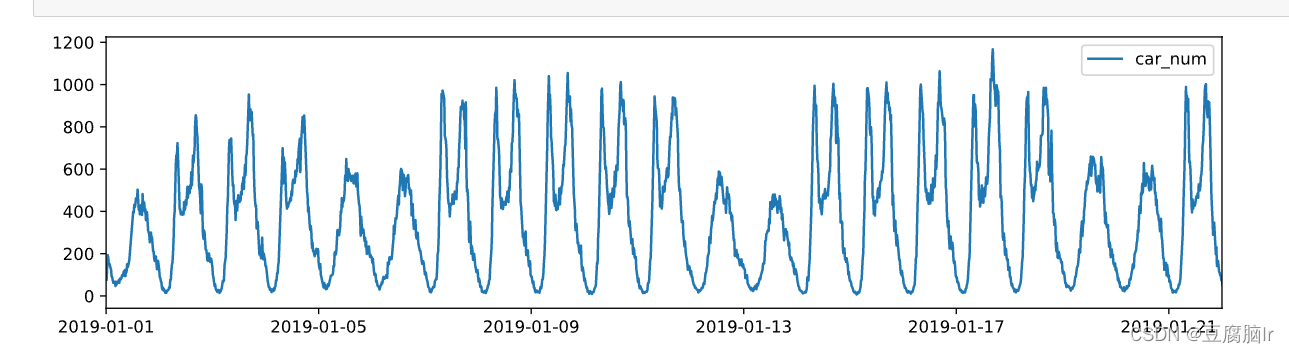
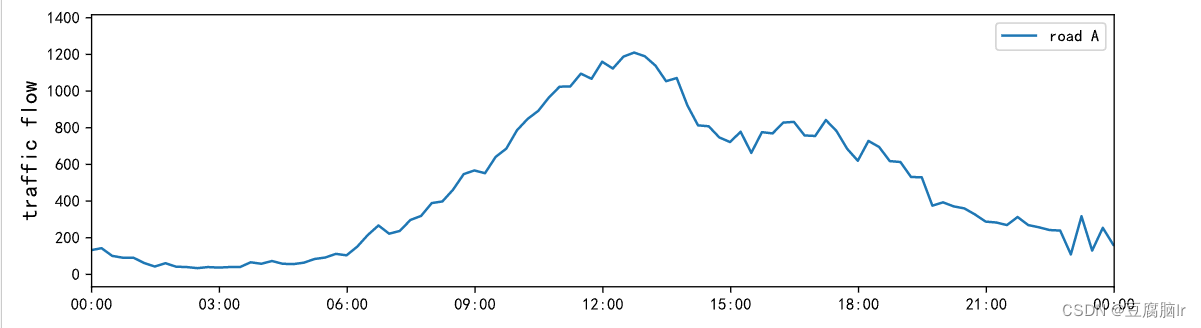
4.自定义x轴日期显示格式
如果想自定义坐标轴显示格式,可以更改一下绘图方法,通过dateformatter来实现。
from matplotlib.dates import dateformatter

def myplot(x, y, label=none, xlimit=none, size=(9, 3),filename=none):
    display.set_matplotlib_formats('svg')
    if len(x) == len(y):
        plt.figure(figsize=size)
        if xlimit and isinstance(xlimit, tuple):
            plt.xlim(xlimit)
        plt.plot(x, y, label=label)
        if label and isinstance(label, str):
            plt.legend()
        if filename:
            plt.savefig(filename)
        # ======= 以下是新增代码
        ax = plt.gca()
        formatter = dateformatter('%h:%m')
        ax.xaxis.set_major_formatter(formatter) # 设置时间显示格式
        # ==============
        plt.show()
    else:
        raise valueerror("x 和 y 的长度不一致!")
效果如下:
总结
以上为个人经验,希望能给大家一个参考,也希望大家多多支持代码网。


发表评论