一、实现的效果
二、具体步骤
1.安装依赖
2.引入echarts
注意:这里需要用到echarts-gl,必须单独引入才可以
3.echarts部分代码
我知道这部分内容很多,但只要cv去用就可以了,getparametricequation这个函数不用改(我也不知道咋改。。。反正我没动过);getpie3d函数根据自己的需求稍微改一下option配置就好,其余的可以不用管
// 颜色列表
const colorlist = [
'rgba(76, 139, 241, 0.9)',
'rgba(101, 193, 241, 0.9)',
'rgba(249, 215, 114, 0.9)',
'rgba(179, 186, 195, 0.9)',
'rgba(255, 255, 255, 0.9)',
'rgba(145, 186, 217, 0.9)',
];
// 生成扇形的曲面参数方程,用于 series-surface.parametricequation
function getparametricequation(startratio: any, endratio: any, isselected: any, ishovered: any, k: any, h: any) {
// 计算
let midratio = (startratio + endratio) / 2;
let startradian = startratio * math.pi * 2;
let endradian = endratio * math.pi * 2;
let midradian = midratio * math.pi * 2;
// 如果只有一个扇形,则不实现选中效果。
// if (startratio === 0 && endratio === 1) {
// isselected = false;
// }
isselected = false;
// 通过扇形内径/外径的值,换算出辅助参数 k(默认值 1/3)
k = typeof k !== 'undefined' ? k : 1 / 3;
// 计算选中效果分别在 x 轴、y 轴方向上的位移(未选中,则位移均为 0)
let offsetx = isselected ? math.sin(midradian) * 0.1 : 0;
let offsety = isselected ? math.cos(midradian) * 0.1 : 0;
// 计算高亮效果的放大比例(未高亮,则比例为 1)
let hoverrate = ishovered ? 1.05 : 1;
// 返回曲面参数方程
return {
u: {
min: -math.pi,
max: math.pi * 3,
step: math.pi / 32,
},
v: {
min: 0,
max: math.pi * 2,
step: math.pi / 20,
},
x: function (u: any, v: any) {
if (u < startradian) {
return offsetx + math.cos(startradian) * (1 + math.cos(v) * k) * hoverrate;
}
if (u > endradian) {
return offsetx + math.cos(endradian) * (1 + math.cos(v) * k) * hoverrate;
}
return offsetx + math.cos(u) * (1 + math.cos(v) * k) * hoverrate;
},
y: function (u: any, v: any) {
if (u < startradian) {
return offsety + math.sin(startradian) * (1 + math.cos(v) * k) * hoverrate;
}
if (u > endradian) {
return offsety + math.sin(endradian) * (1 + math.cos(v) * k) * hoverrate;
}
return offsety + math.sin(u) * (1 + math.cos(v) * k) * hoverrate;
},
z: function (u: any, v: any) {
if (u < -math.pi * 0.5) {
return math.sin(u);
}
if (u > math.pi * 2.5) {
return math.sin(u) * h * 0.1;
}
return math.sin(v) > 0 ? 1 * h * 0.1 : -1;
},
};
}
// 生成模拟 3d 饼图的配置项
function getpie3d(piedata: any, internaldiameterratio: any) {
let series = [];
let sumvalue = 0;
let startvalue = 0;
let endvalue = 0;
let legenddata = [];
let k = typeof internaldiameterratio !== 'undefined' ? (1 - internaldiameterratio) / (1 + internaldiameterratio) : 1 / 3;
// 为每一个饼图数据,生成一个 series-surface 配置
for (let i = 0; i < piedata.length; i++) {
sumvalue += piedata[i].value;
let seriesitem: any = {
name: typeof piedata[i].name === 'undefined' ? `series${i}` : piedata[i].name,
type: 'surface',
parametric: true,
wireframe: {
show: false,
},
piedata: piedata[i],
piestatus: {
selected: false,
hovered: false,
k: 1 / 10,
},
};
if (typeof piedata[i].itemstyle != 'undefined') {
let itemstyle: any = {};
typeof piedata[i].itemstyle.color != 'undefined' ? (itemstyle.color = piedata[i].itemstyle.color) : null;
typeof piedata[i].itemstyle.opacity != 'undefined' ? (itemstyle.opacity = piedata[i].itemstyle.opacity) : null;
seriesitem.itemstyle = itemstyle;
}
series.push(seriesitem);
}
// 使用上一次遍历时,计算出的数据和 sumvalue,调用 getparametricequation 函数,
// 向每个 series-surface 传入不同的参数方程 series-surface.parametricequation,也就是实现每一个扇形。
for (let i = 0; i < series.length; i++) {
endvalue = startvalue + series[i].piedata.value;
series[i].piedata.startratio = startvalue / sumvalue;
series[i].piedata.endratio = endvalue / sumvalue;
series[i].parametricequation = getparametricequation(
series[i].piedata.startratio,
series[i].piedata.endratio,
false,
false,
k,
series[i].piedata.value
);
startvalue = endvalue;
legenddata.push(series[i].name);
}
series.push({
name: 'mouseoutseries',
type: 'surface',
parametric: true,
wireframe: {
show: false,
},
itemstyle: {
opacity: 0.2,
color: 'rgba(165, 247, 253, 1)',
},
parametricequation: {
u: {
min: 0,
max: math.pi * 2,
step: math.pi / 20,
},
v: {
min: 0,
max: math.pi / 4,
step: math.pi / 20,
},
x: function (u: any, v: any) {
return ((math.sin(v) * math.sin(u) + math.sin(u)) / math.pi) * 2.5;
},
y: function (u: any, v: any) {
return ((math.sin(v) * math.cos(u) + math.cos(u)) / math.pi) * 2.5;
},
z: function (u: any, v: any) {
return math.cos(v) > 0 ? -3 : -3;
},
},
});
// 准备待返回的配置项,把准备好的 legenddata、series 传入。
let option = {
legend: {
icon: 'circle',
orient: 'vertical',
data: piedata.map((ditem: any, dindex: any) => {
return {
...ditem,
textstyle: {
rich: {
percent: {
color: colorlist[dindex],
},
},
},
};
}),
right: '5%',
top: '20%',
itemgap: 10,
itemwidth: 12,
itemheight: 12,
selectedmode: false, // 关闭图例选择
textstyle: {
color: '#fff',
fontsize: 14,
fontfamily: 'source han sans cn',
rich: {
name: {
color: '#fff',
fontsize: 18,
width: 50,
padding: [0, 0, 0, 10],
},
value: {
color: '#2bdfd4',
fontsize: 20,
width: 50,
padding: [0, 0, 0, 20],
},
percent: {
color: '#2bdfd4',
fontsize: 24,
padding: [0, 0, 0, 20],
},
unit: {
color: '#acdce4',
fontsize: 24,
padding: [0, 0, 0, 5],
},
},
},
formatter: (name: any) => {
let obj = piedata.find((item: any) => item.name === name);
let datas = piedata;
let total = 0;
let target = obj.value;
for (let i = 0; i < datas.length; i++) {
total += number(datas[i].value);
}
const arr = [`{name|${name}}{value|${obj.value}次}{percent|${((target / total) * 100).tofixed(0)}}{unit|%}`];
return arr.join('');
},
},
xaxis3d: {},
yaxis3d: {},
zaxis3d: {},
grid3d: {
viewcontrol: {
autorotate: true, // 自动旋转
},
left: '4%',
width: '45%',
show: false,
boxheight: 30,
// boxwidth和boxdepth这两个属性值保持一致,才可以在调整饼图宽度的时候保持水平,不然就会歪歪扭扭
boxwidth: 130,
boxdepth: 130,
},
series: series,
};
return option;
}
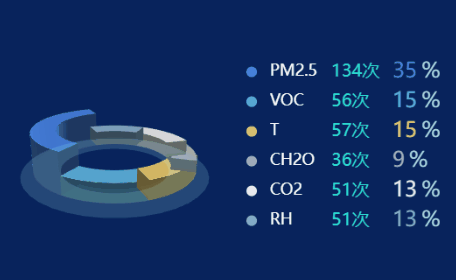
const data = [
{
name: 'pm2.5',
value: 134,
},
{
name: 'voc',
value: 56,
},
{
name: 't',
value: 57,
},
{
name: 'ch2o',
value: 36,
},
{
name: 'co2',
value: 51,
},
{
name: 'rh',
value: 51,
},
];
const serdata = data.map((ditem, index) => {
return {
...ditem,
value: number(ditem.value),
itemstyle: {
color: colorlist[index],
},
};
});
// 传入数据生成 option
let option = getpie3d(serdata, 0.7);

发表评论