一、研究背景和意义
糖尿病是美国最普遍的慢性病之一,每年影响数百万美国人,并对经济造成重大的经济负担。糖尿病是一种严重的慢性疾病,其中个体失去有效调节血液中葡萄糖水平的能力,并可能导致生活质量和预期寿命下降。。。。
本案例分析针对糖尿病数据集进行探索和分析:
二、实证分析
首先,导入需要的基础包:
import numpy as np
import pandas as pd
import matplotlib.pyplot as plt
%matplotlib inline
plt.rcparams['font.sans-serif'] = ['kaiti']  #中文
plt.rcparams['axes.unicode_minus'] = false   #负号


import seaborn as sns
读取数据文件
###读取文件数据
df=pd.read_csv('data.csv')
###展示数据前15行
df.head(15)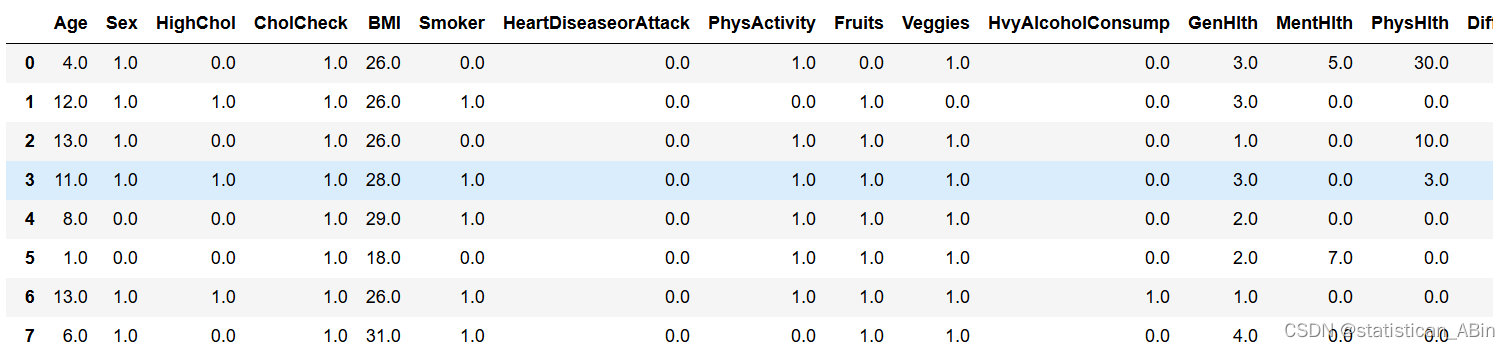
###各项特征名称
年龄:13级年龄组(_ageg5yr见密码本)
1 = 18-24 / 2 = 25-29 / 3 = 30-34 / 4 = 35-39 / 5 = 40-44 / 6 = 45-49 / 7 = 50-54 / 8 = 55-59 / 9 = 60-64 / 10 = 65-69 / 11 = 70-74 / 12 = 75-79 / 13 = 80 岁或以上
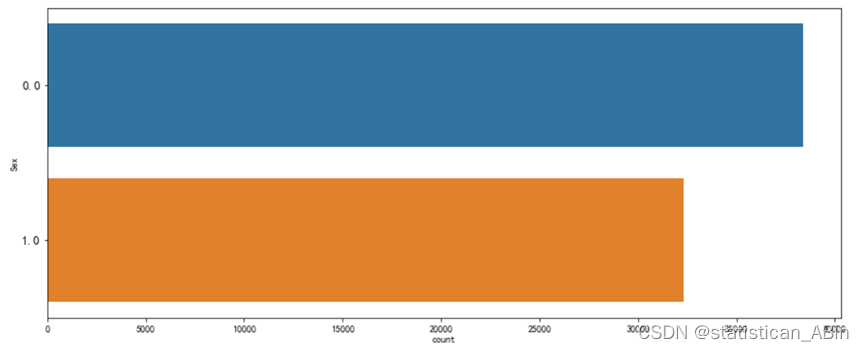
sex:患者性别(1:男;0:女)
highchol:0 = 无高胆固醇 1 = 高胆固醇
cholcheck:0 = 5 年内未进行胆固醇检查 1 = 5 年内进行了胆固醇检查
bmi:身体质量指数
吸烟者:您一生中至少吸过 100 支香烟吗? [注:5 包 = 100 支香烟] 0 = 否 1 = 是
心脏病或发作:冠心病 (chd) 或心肌梗塞 (mi) 0 = 否 1 = 是
physactivity:过去 30 天的身体活动 - 不包括工作 0 = 否 1 = 是
水果:每天吃水果 1 次或更多次 0 = 否 1 = 是
蔬菜:每天吃蔬菜 1 次或更多次 0 = 否 1 = 是
hvyalcoholconsump:(成年男性每周 >=14 杯,成年女性每周 >=7 杯)0 = 否 1 = 是
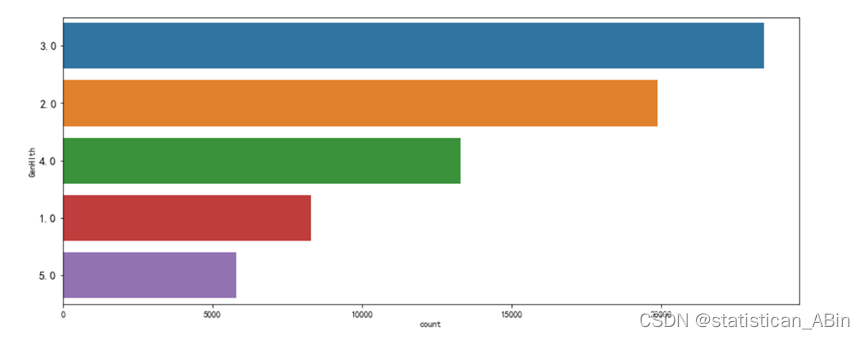
genhlth:总体而言,您的健康状况是: 等级 1-5 1 = 极好 2 = 非常好 3 = 好 4 = 一般 5 = 差
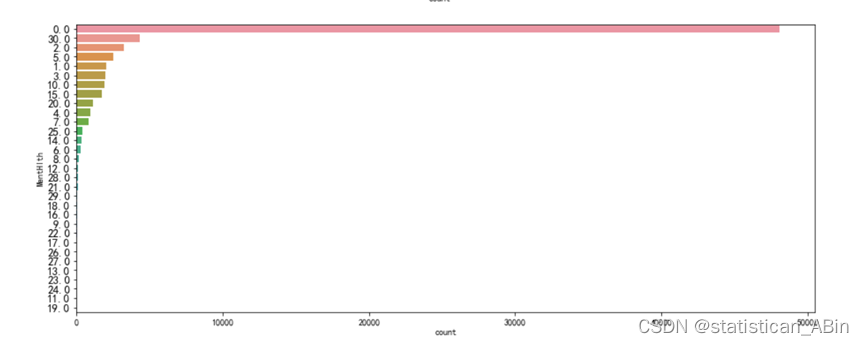
menthlth:心理健康状况不佳的天数 1-30 天
physhlth:过去 30 天的身体疾病或受伤天数 1-30
diffwalk:你走路或爬楼梯有严重困难吗? 0 = 否 1 = 是
中风:您曾经中风。 0 = 否,1 = 是
highbp:0 = 不高,bp 1 = 高 bp
糖尿病:0 = 无糖尿病,1 = 糖尿病
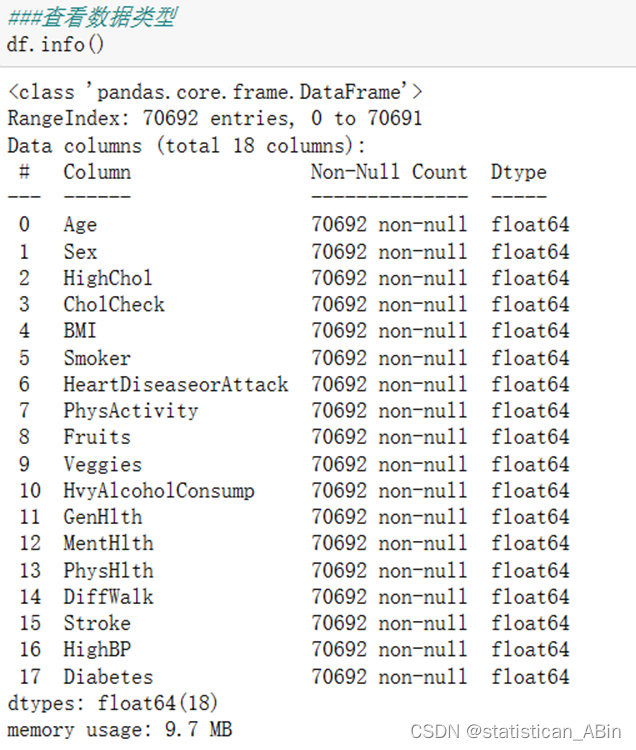
发现数据量为七万多行,17个特征
查看数据类型和形状
接下来进行基本的统计性描述分析
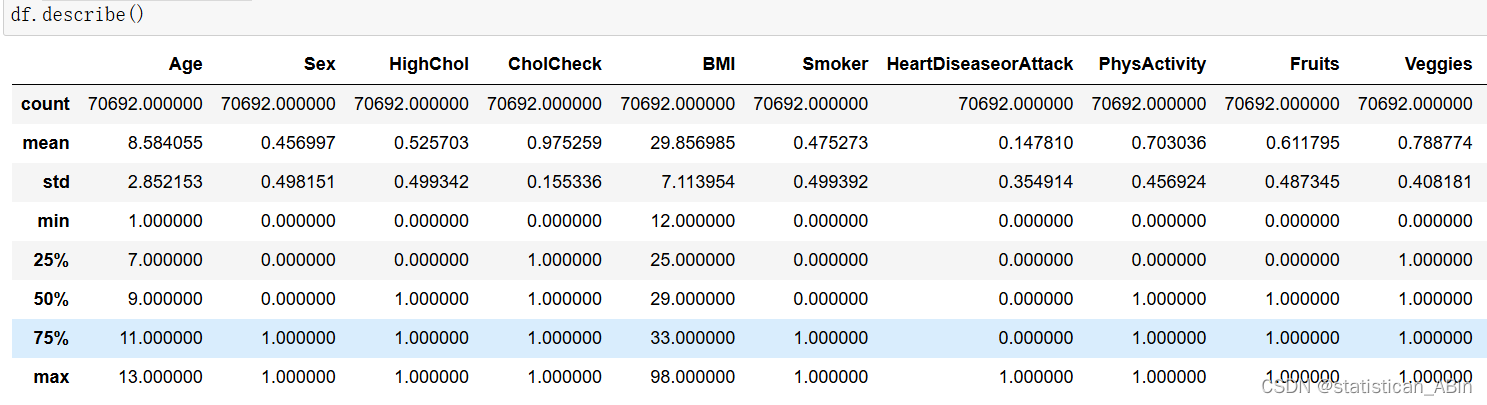
从上面结果可以看出,从描述中,我们观察到bmi,physhlth,menthlth的标准差高于1,
最大值和最小值之间的差异相对较高
下来查看缺失值

数据比较完整,无缺失值,若有的话可以可视化一下:
#观察缺失值可视化
import missingno as msno
msno.matrix(df) 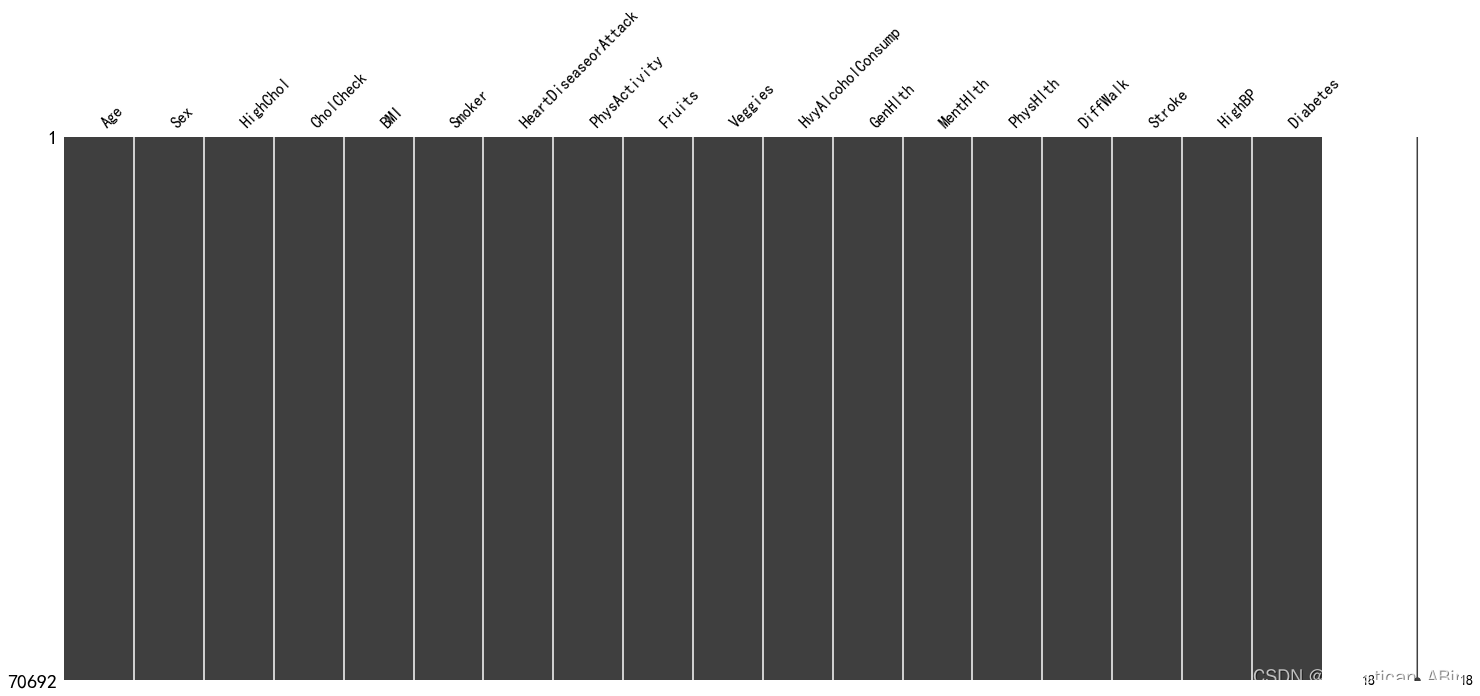
对特征分别进行可视化一下 比如各个特征的占比情况等等
import seaborn as sb
for i in df.columns:
    fig, ax = plt.subplots(1,1, figsize=(15, 6))
    sb.countplot(y = df[i],data=df, order=df[i].value_counts().index)
    plt.ylabel(i)
    plt.yticks(fontsize=13)
    plt.show()
# 按性别分组,计算平均年龄和bmi
grouped = df.groupby('sex')[['age', 'bmi']].mean()
grouped['bmi'].plot(kind='bar')
plt.title('average bmi by gender')
plt.xlabel('gender')
plt.ylabel('average bmi')
plt.show()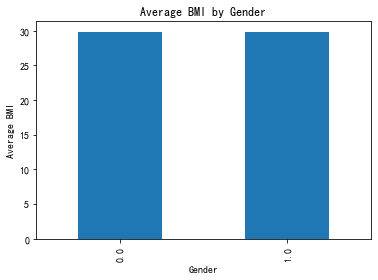
接下来看一下特征之间的相关系数
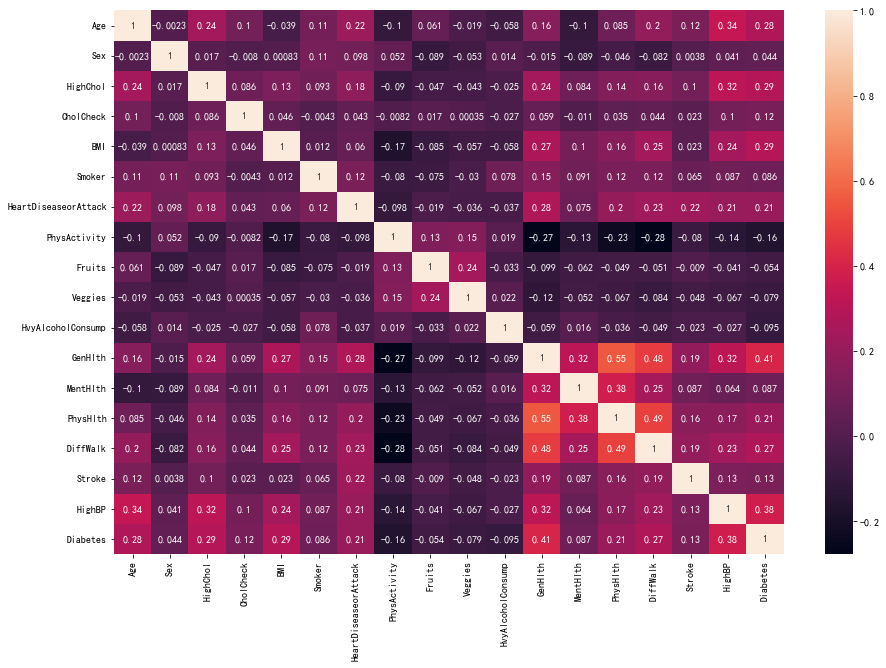
从上面热力图可以看出,最大相关性在0.38左右
再画出具体特征的分布
sb.barplot(x=df['diabetes'],y=df['highbp'],color='red') 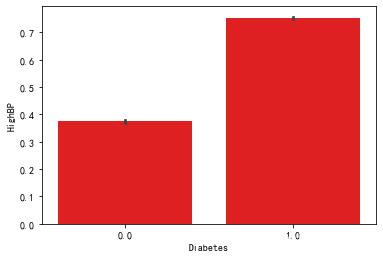
下来用直方图表示
df.hist(figsize=(20,20))
plt.show()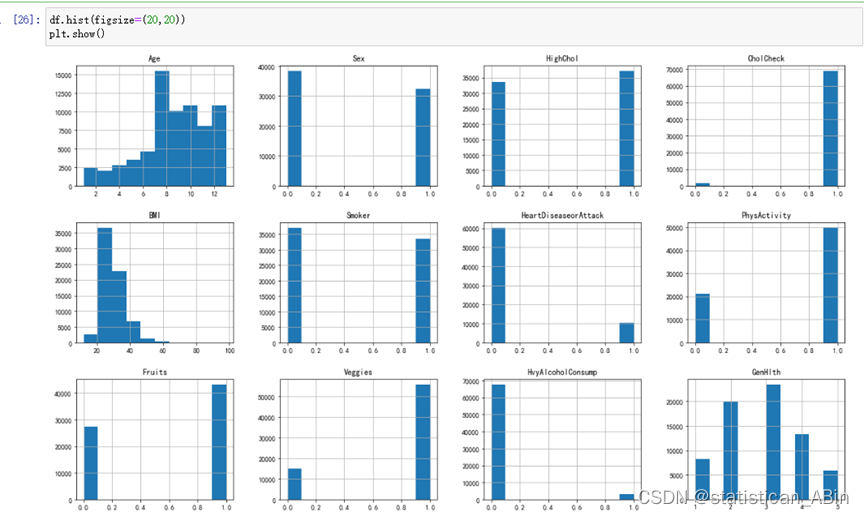 分别画出响应变量糖尿病与其他特征的关系
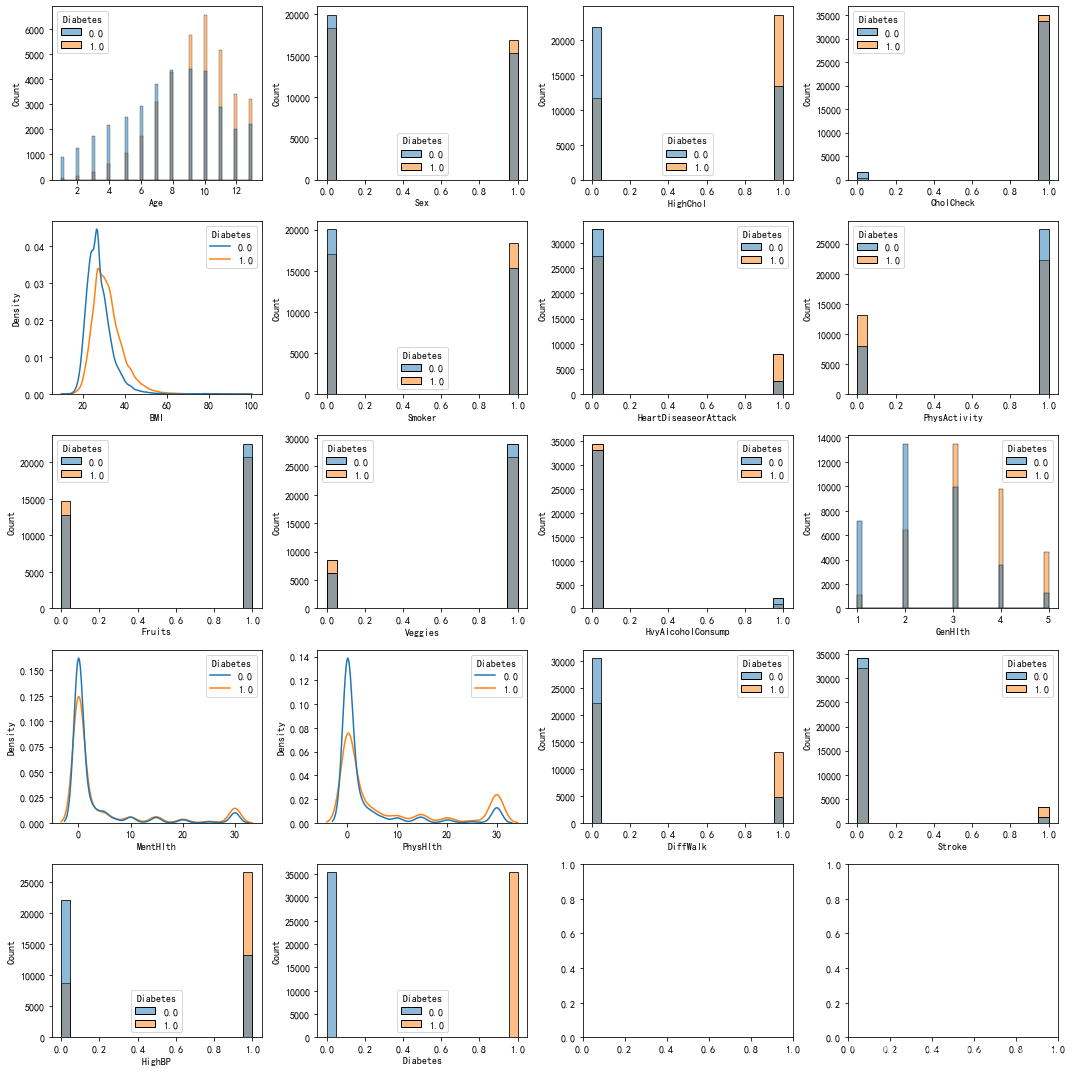
接下来看一下糖尿病分布
plt.figure(figsize=(12,5))
sns.displot(x='physhlth', col='diabetes' , data = df, kind="kde" ,color = 'pink') 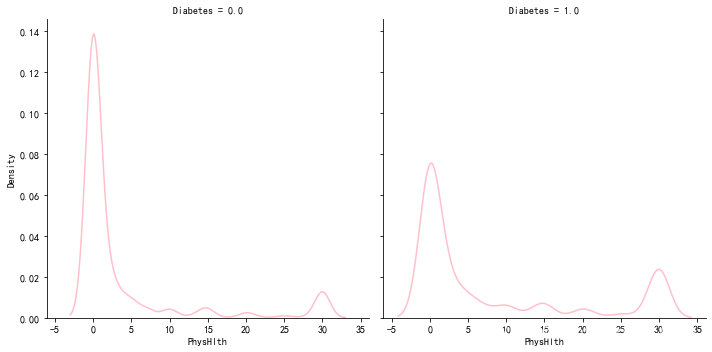
接下来进行标准化
df1 = df
cols = ['bmi', 'physhlth']
for i in cols:
    df1[i] = (df1[i] - df1[i].min()) / (df1[i].max() - df1[i].min())
下面开始机器学习部分
####划分训练集和验证集
from sklearn.model_selection import train_test_split
from sklearn.preprocessing import standardscaler
print('non normalized dataset')
x_train, x_test, y_train, y_test= train_test_split(x,y,test_size=0.25,random_state=101)
print('training: ', x_train.shape[0])
print('test: ', x_test.shape[0])
st_x= standardscaler()
x_train= st_x.fit_transform(x_train)
x_test= st_x.transform(x_test)

print('normalized dataset')
x_train1, x_test1, y_train1, y_test1 = train_test_split(x1,y1,test_size=0.25,random_state=101)
print('training: ', x_train1.shape[0])
print('test: ', x_test1.shape[0])
from sklearn.neighbors import kneighborsclassifier
import time
from sklearn.metrics import accuracy_score, confusion_matrix, classification_report
exec = []
exec1 = []
st = time.time()
knn = kneighborsclassifier(n_neighbors=5)
knn.fit(x_train, y_train)
accuracy = []
accuracy1 = []
y_pred = knn.predict(x_test)
cm = confusion_matrix(y_test, y_pred)
print(cm)
print('\n')
print(classification_report(y_test,y_pred))
print(accuracy_score(y_test, y_pred))
accuracy.append(accuracy_score(y_test, y_pred))
exec.append(time.time() - st)
print('\n\nnormalized dataset')
st = time.time()
knn.fit(x_train1, y_train1)
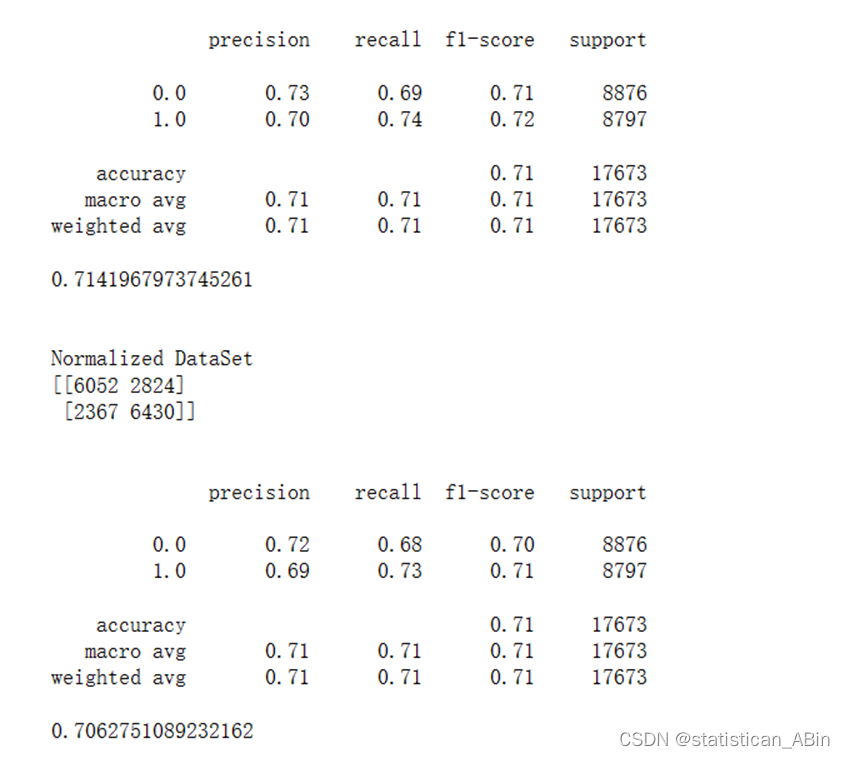
使用其他模型试一下,最终结果如下
#决策树
from sklearn.tree import decisiontreeclassifier
model = decisiontreeclassifier()
model.fit(x_train, y_train)
model.score(x_test, y_test)
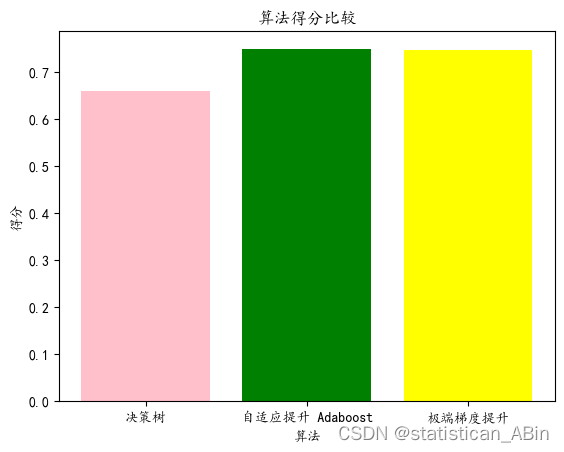
从以上结果可以看出,自适应提升adaboost模型的效果还可以,达到了0.7486.其次是极端梯度提升,knn以及最后的决策树。
三、总结
在这个项目中,我运用了机器学习的模型来预测一个人是否患有糖尿病,使用的模型包括自适应提升(adaboost)、k最近邻(knn)和决策树(decision tree)等。自适应提升(adaboost)是一种集成学习方法.它通过不断迭代调整样本权重,训练出多个弱分类器,最终组合成一个强分类器。通过对不同算法的比较和分析,最终发现自适应提升最优的算法来进行预测,并根据预测结果来制定相应的医疗干预措施,以帮助预防和治疗糖尿病。。
创作不易,希望大家多点赞关注评论!!!(类似代码或报告定制可以私信)

发表评论