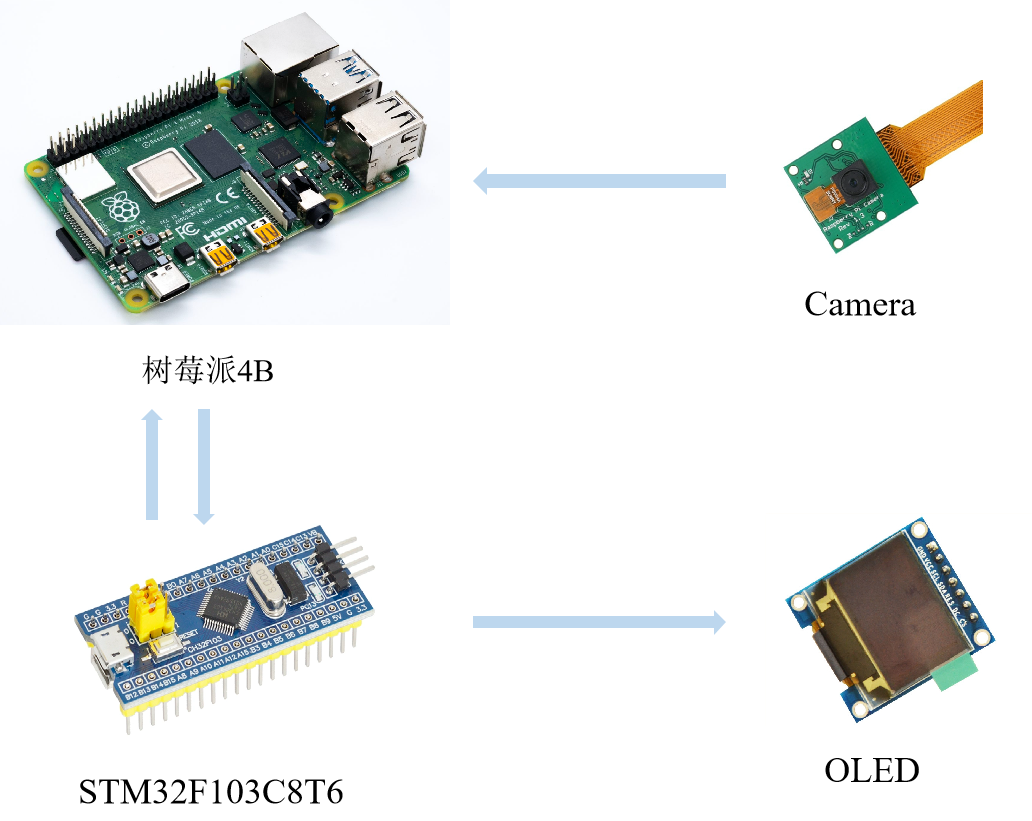
前言:本文为手把手教学树莓派4b与 stm32 的 uart 通讯,本次项目采用树莓派4b与 stm32 进行串口通讯,将彼此的数据进行互相传输。本篇博客同时提供了基于 yolov5-lite 的目标检测数据联动,即将树莓派4b检测到的信息发送至 stm32,后续可以通过这些信息进行各种需求上的控制。树莓派4b与 stm32 的联动是很常见的嵌入式架构体系,通常树莓派4b负责计算量大的任务(例如:目标检测,激光雷达等),stm32 则负责进行控制任务,该架构也是目前主流的智能硬件处理框架!(文末有代码开源!)
硬件实物图: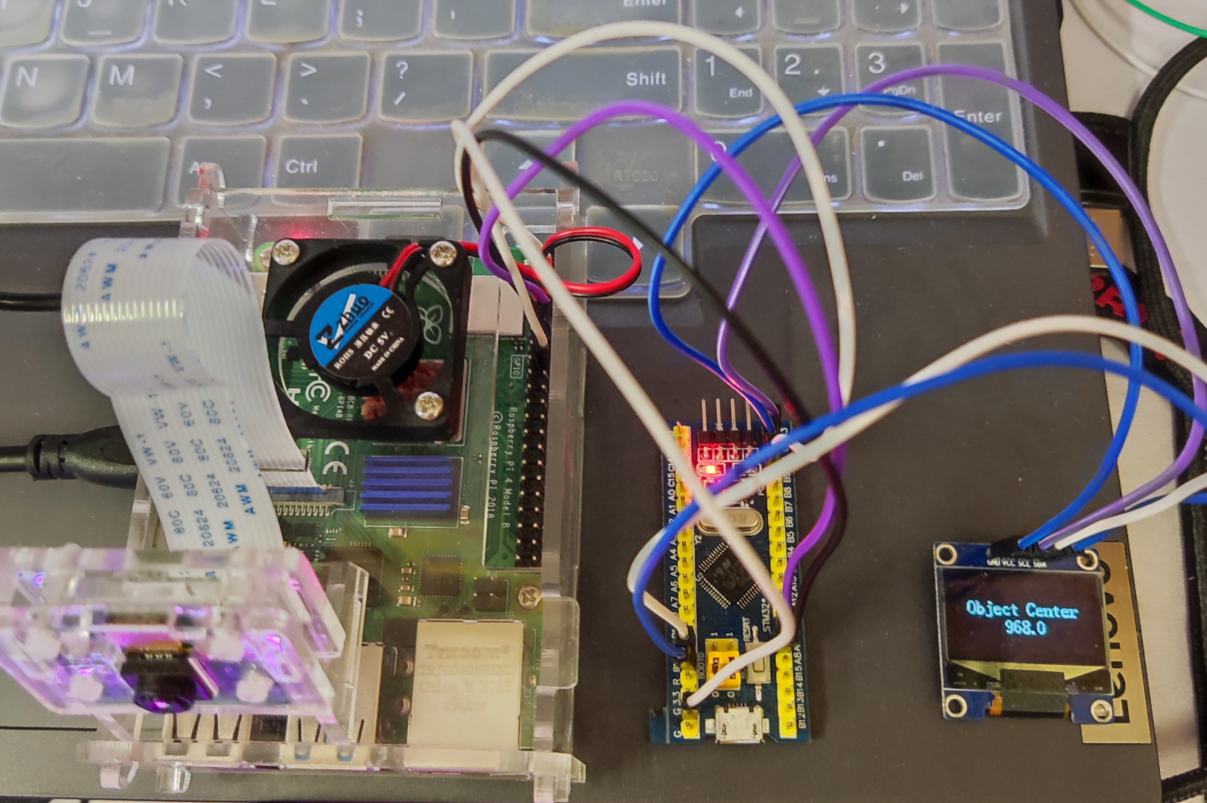
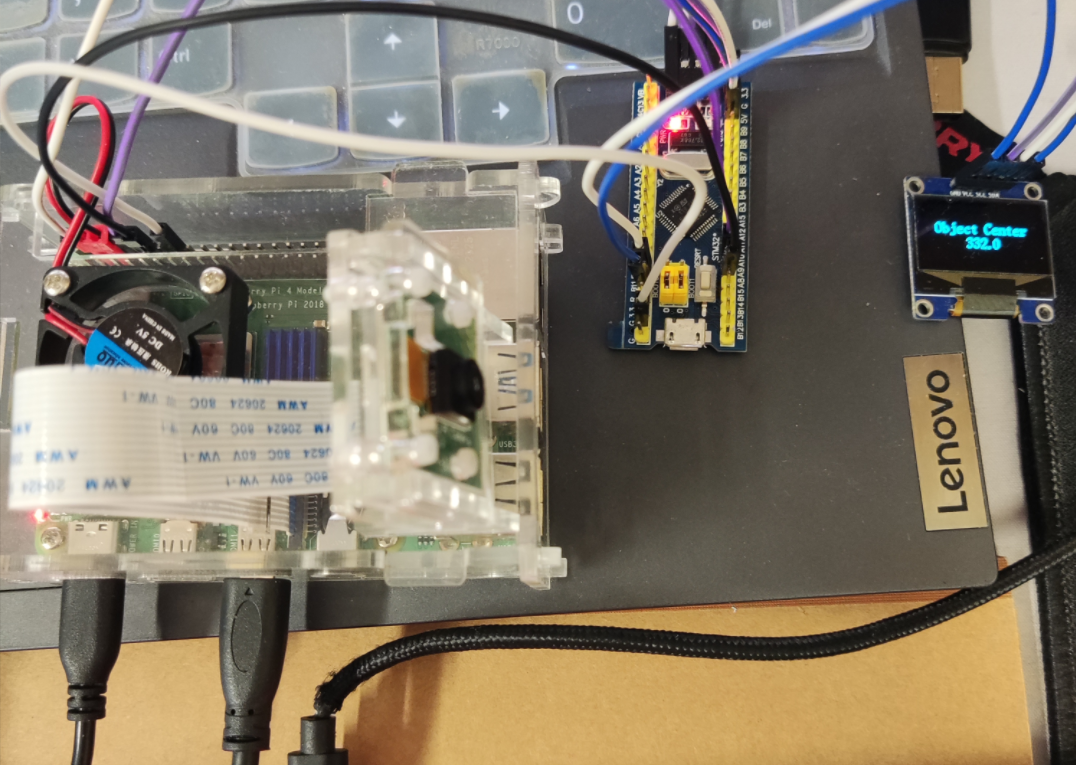
效果图:
一、树莓派4b串口
1.1 树莓派4b的pin
树莓派4b的引脚图:
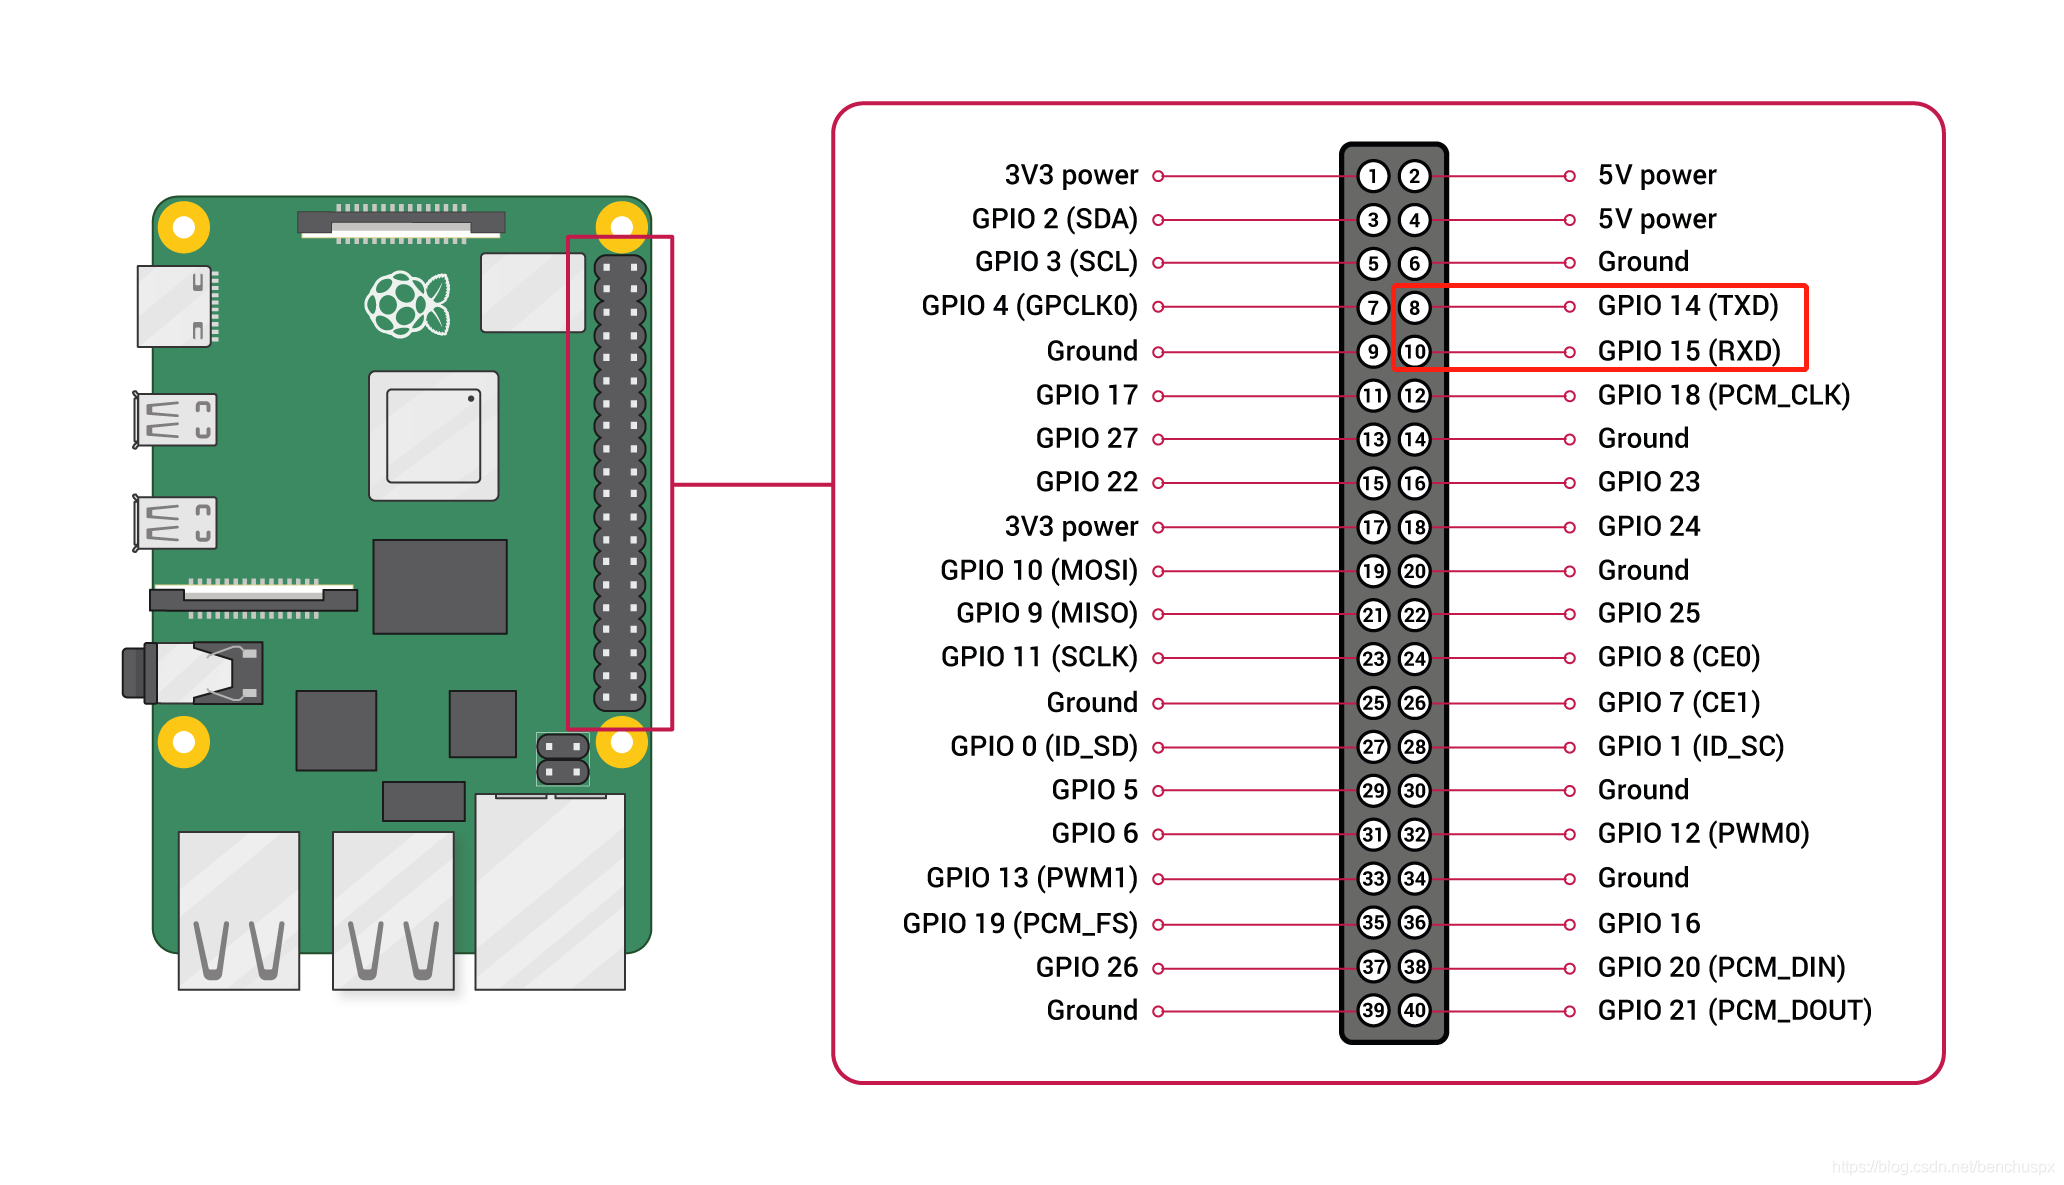
树莓派4b作为一款小型电脑,其提供了额外大量的 pin 引脚适用于嵌入式的日常开发,本次实验我们需要需要实现树莓派4b与stm32f103c8t6之间的uart通讯!
1.2 树莓派4b安装serial与使用
1.2.1 安装serial
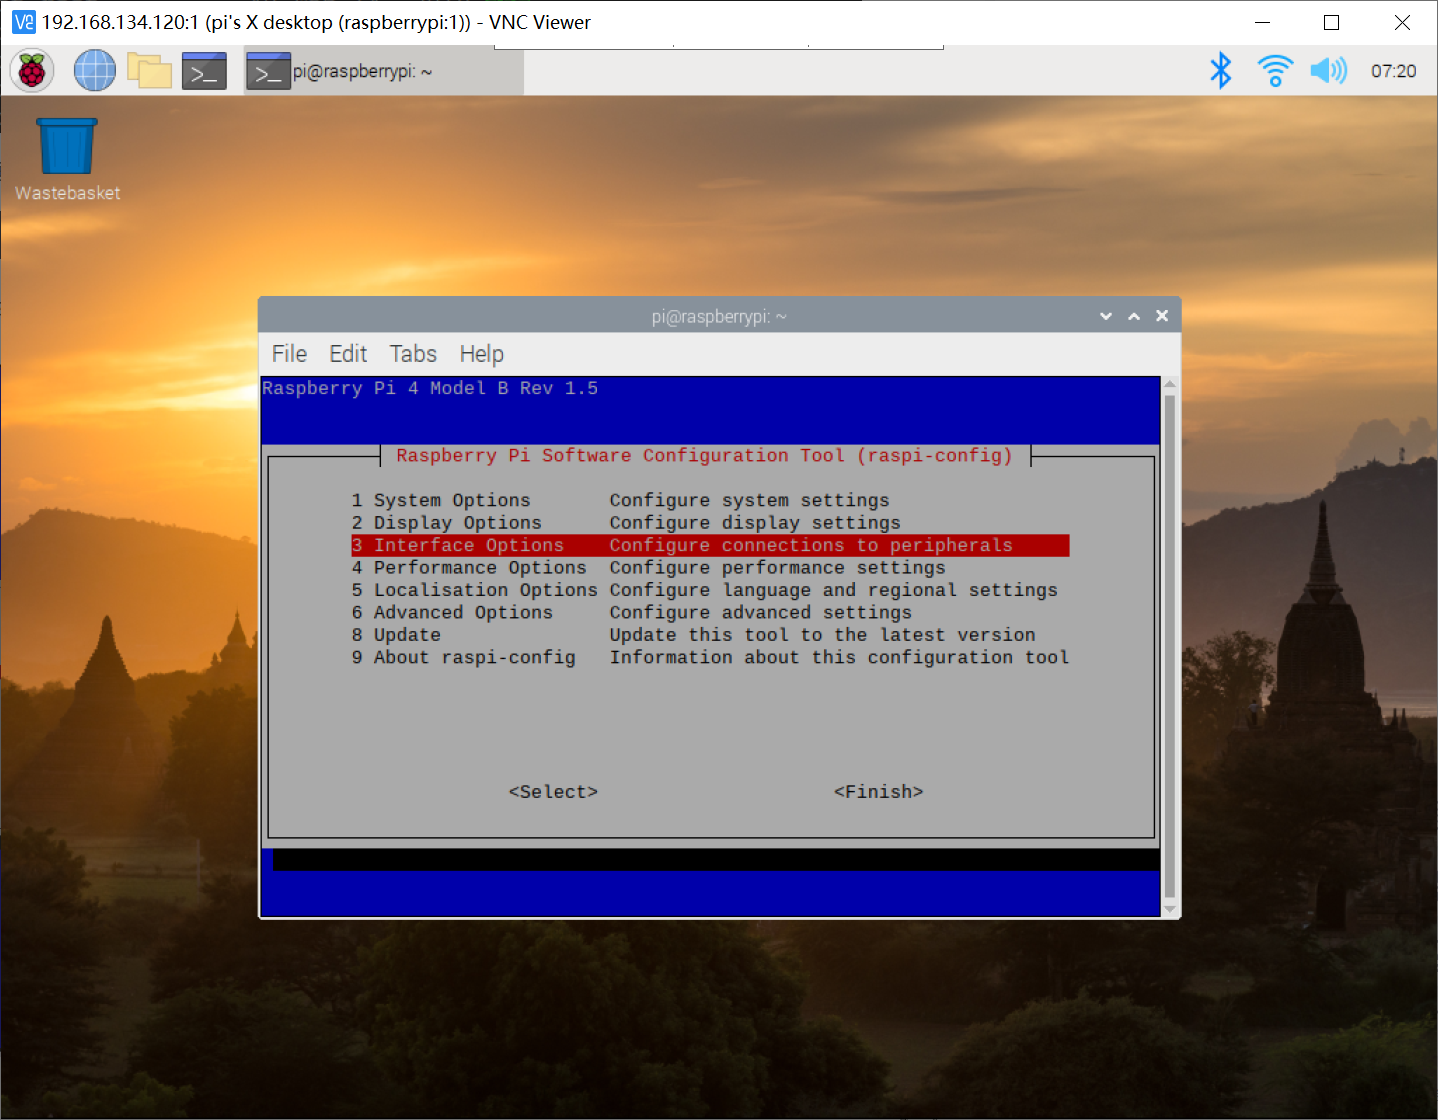
1.2.2 打开树莓派4b串口


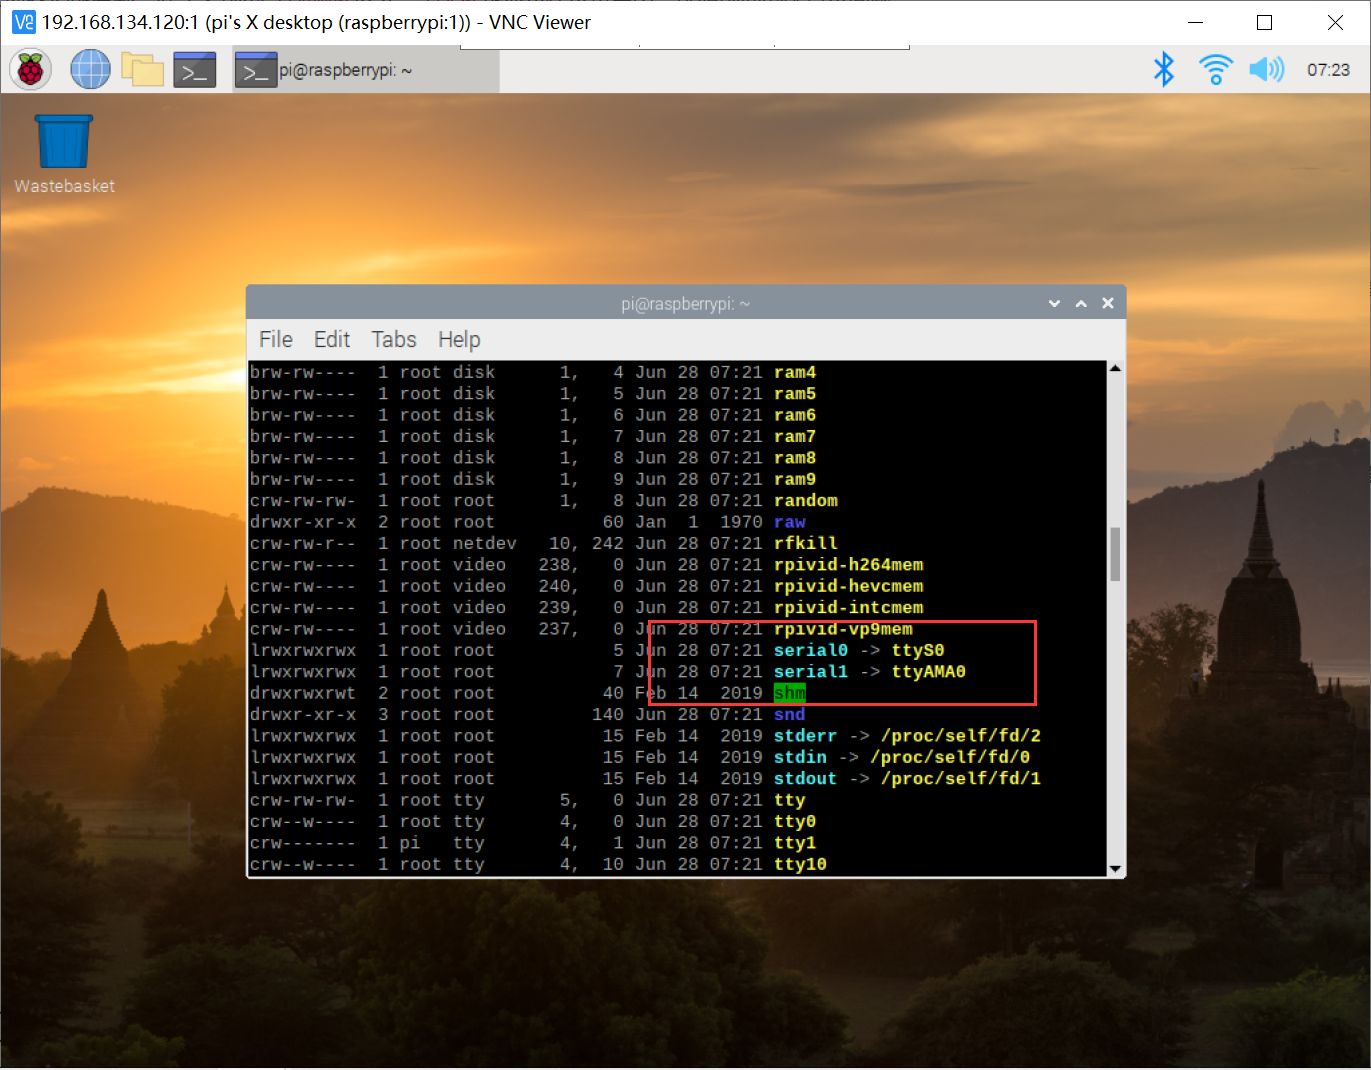
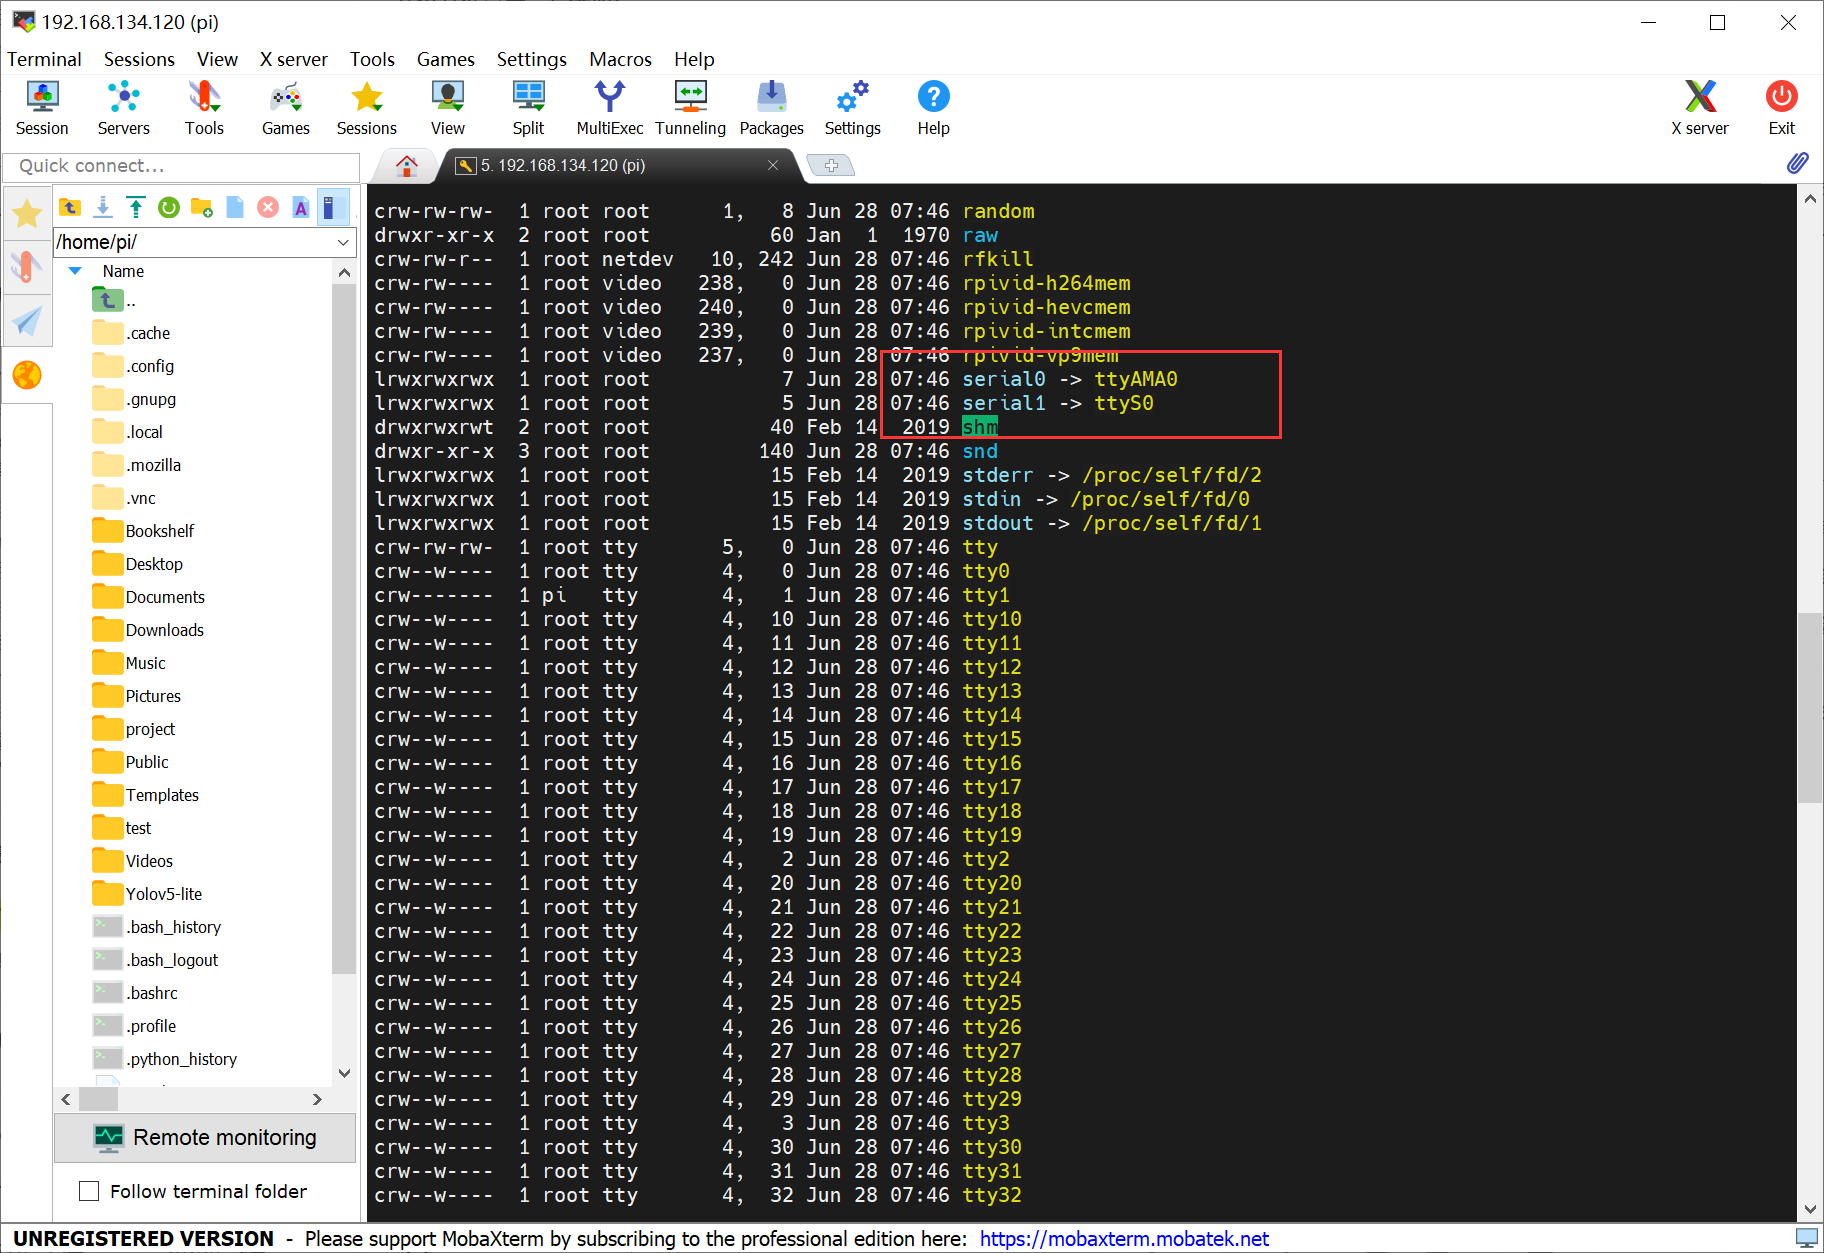
1.2.3 修改串口映射关系
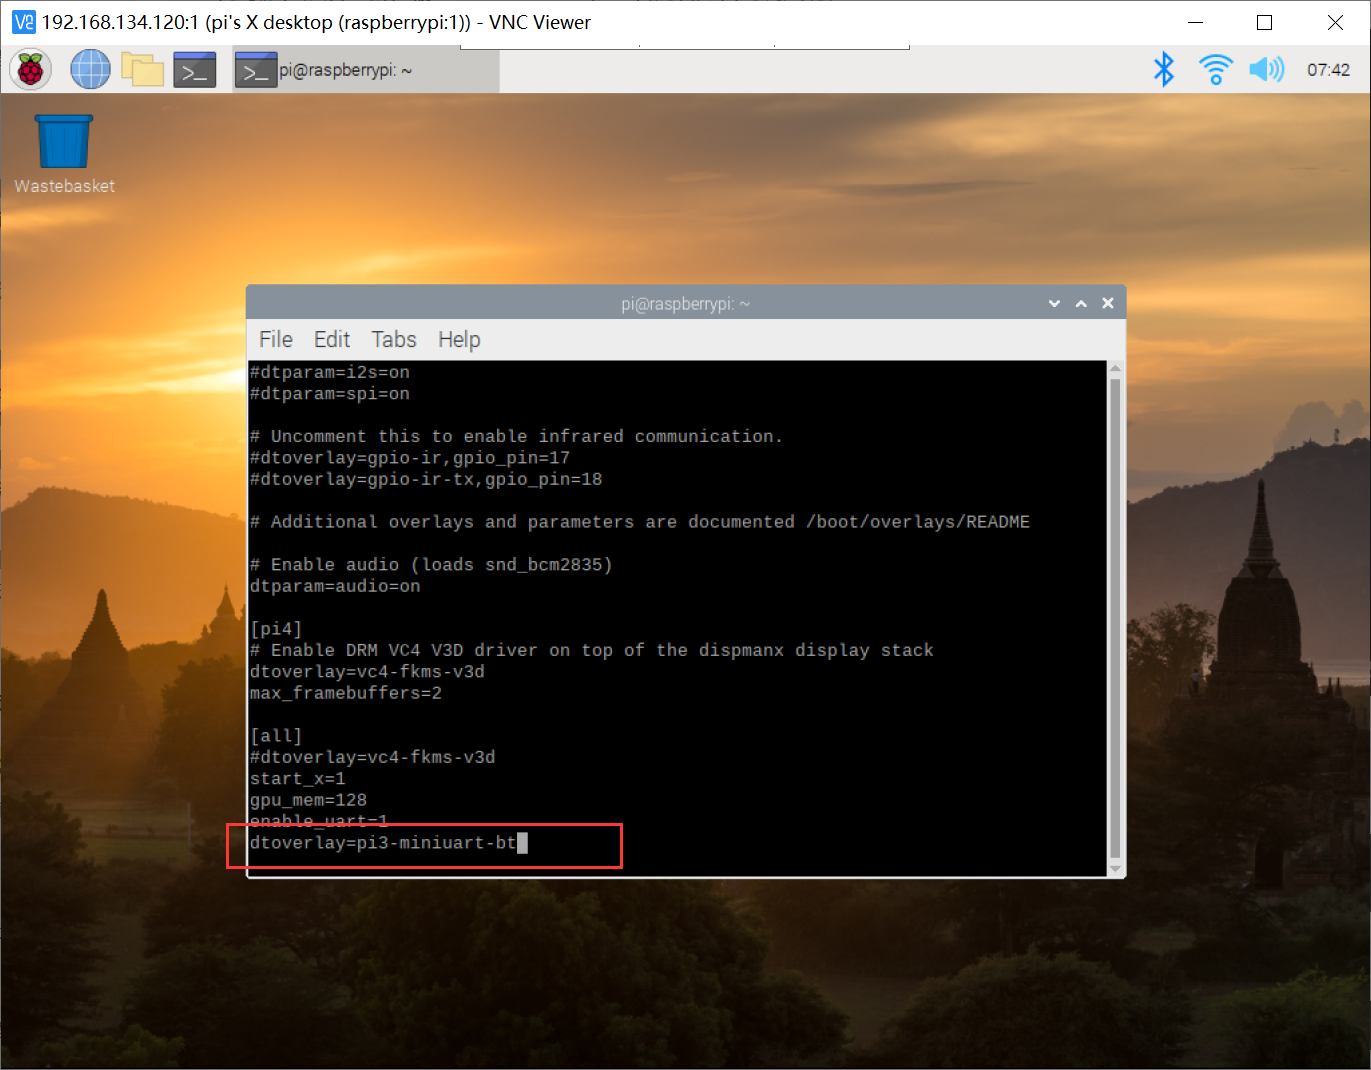
1.2.4 修改配置文件
dwc_otg.lpm_enable=0 console=tty1 root=/dev/mmcblk0p2 rootfstype=ext4 elevator=deadline rootwait二、安装minicom与树莓派4b测试
2.1 minicom安装
sudo apt-get install minicom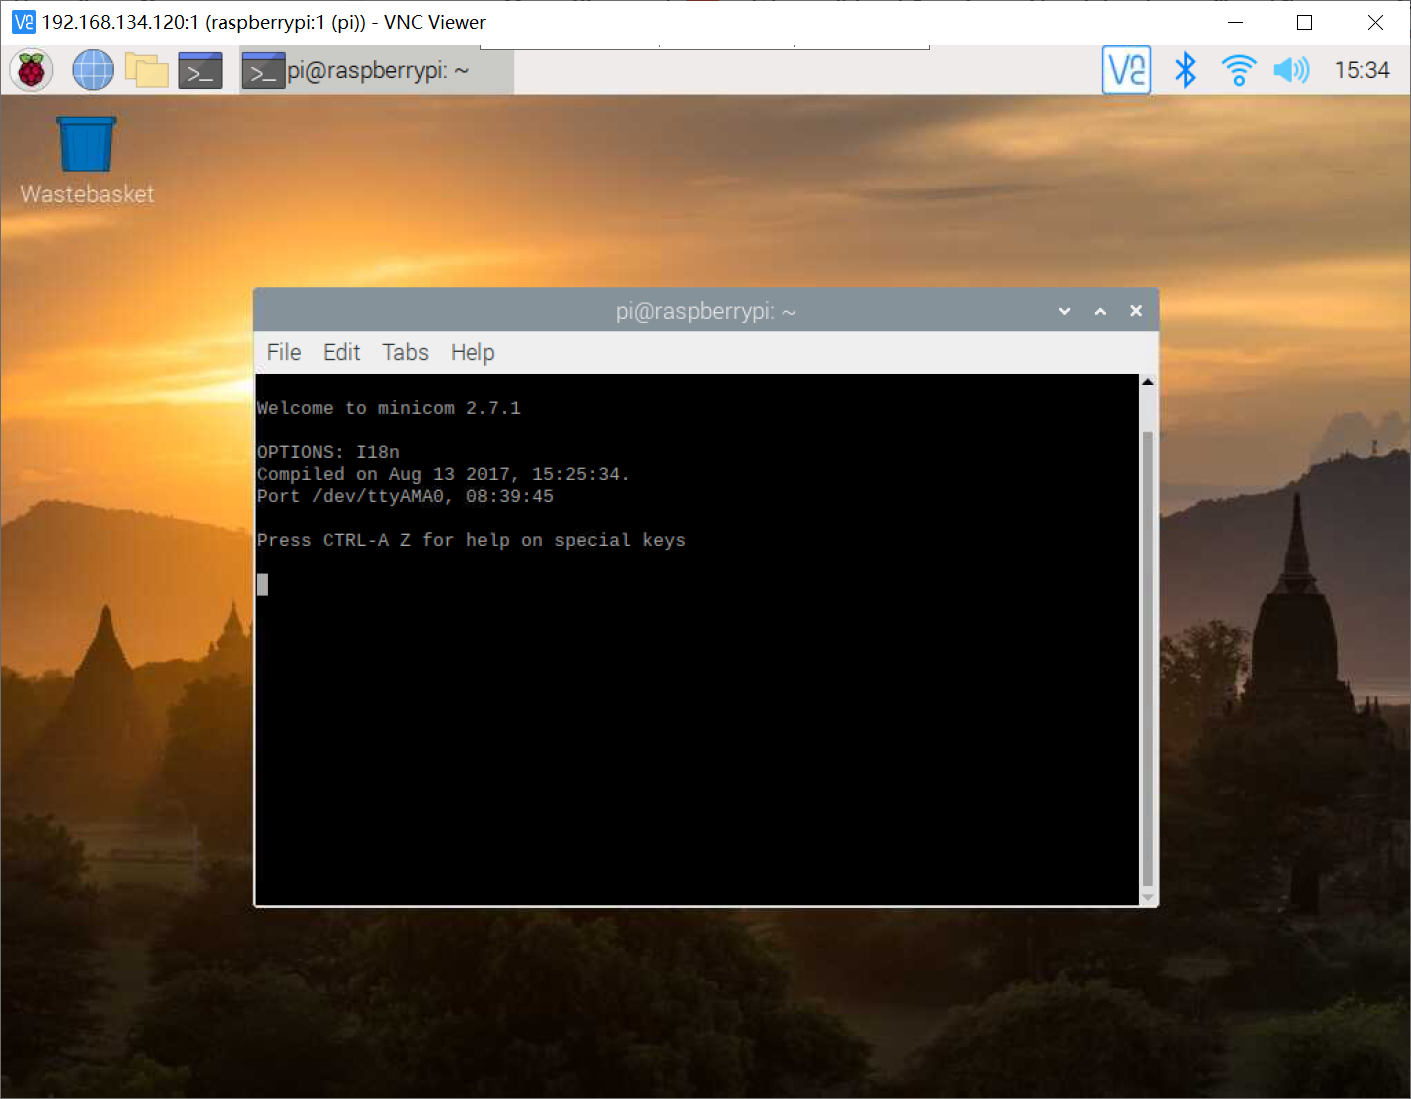
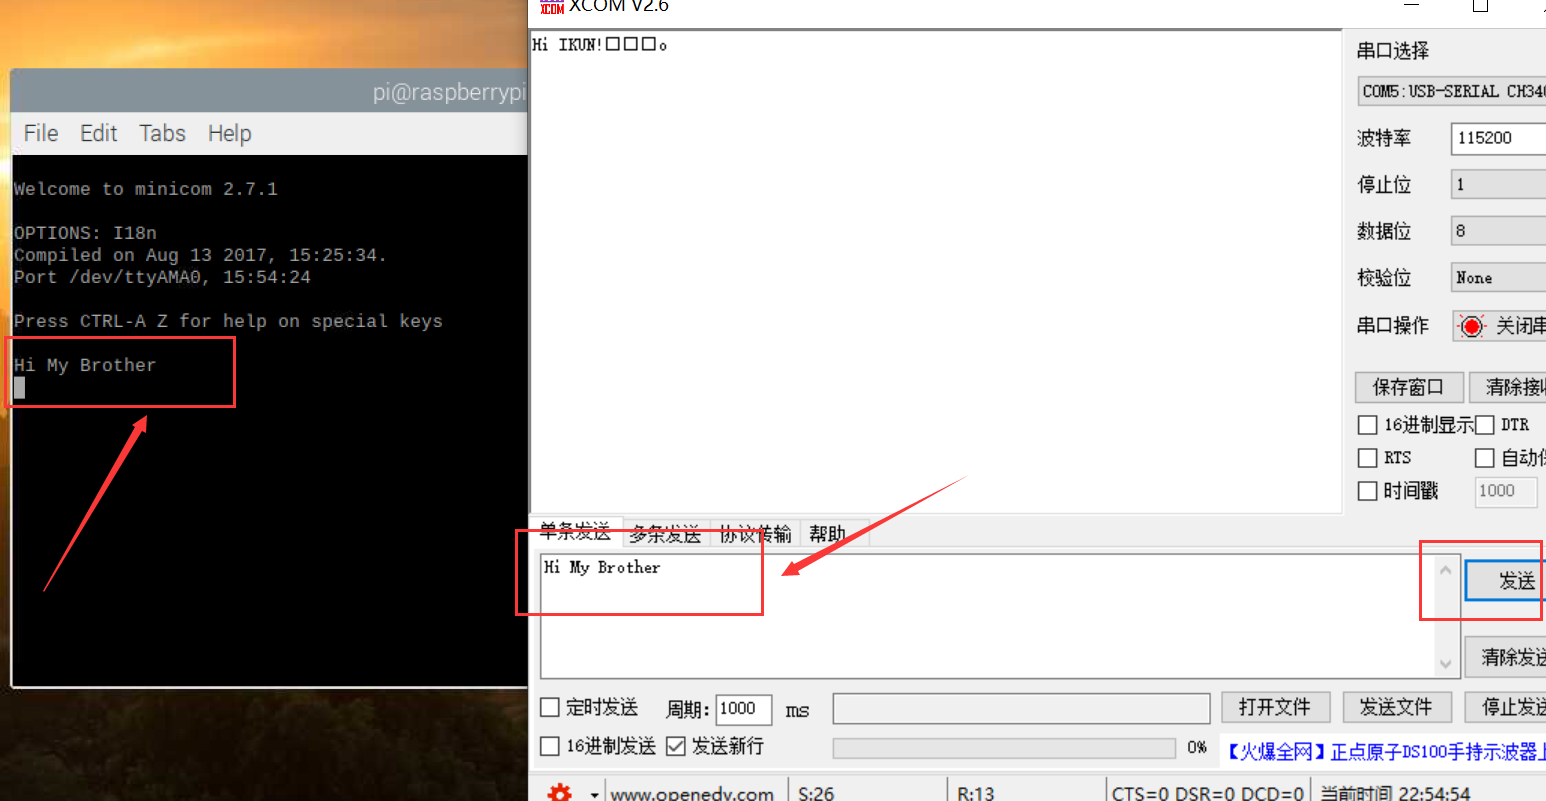
2.2 树莓派4b通信测试
使用usb-ttl模块交叉连接树莓派4b的 uart 的引脚;

我们在下图 minicom 红框区域输入 hi ikun!字样之后,可以在 xcom 的端口处看到字符串成功发送到了 pc 端;
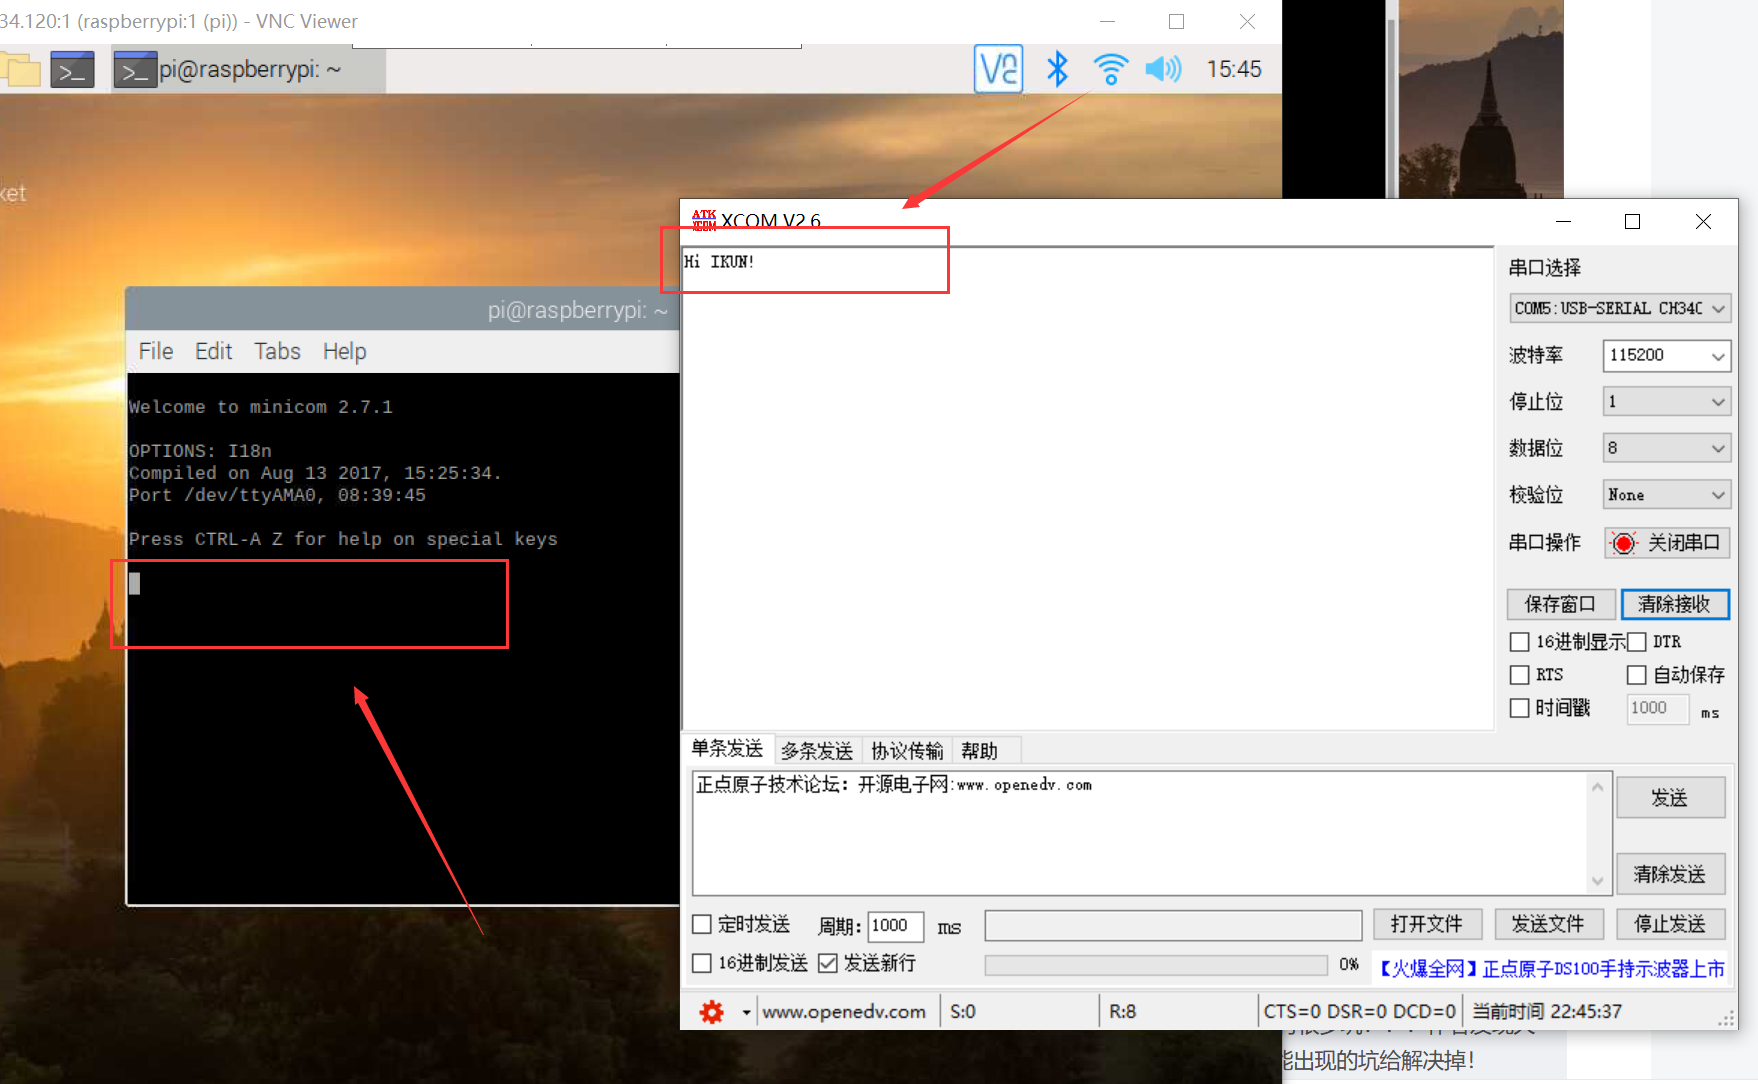
同理,在 xcom 端口发送 hi my brother 字样之后,可以在树莓派4b的 minicom 红框区域成功接收到该信息!
三、树莓派4b与stm32通信
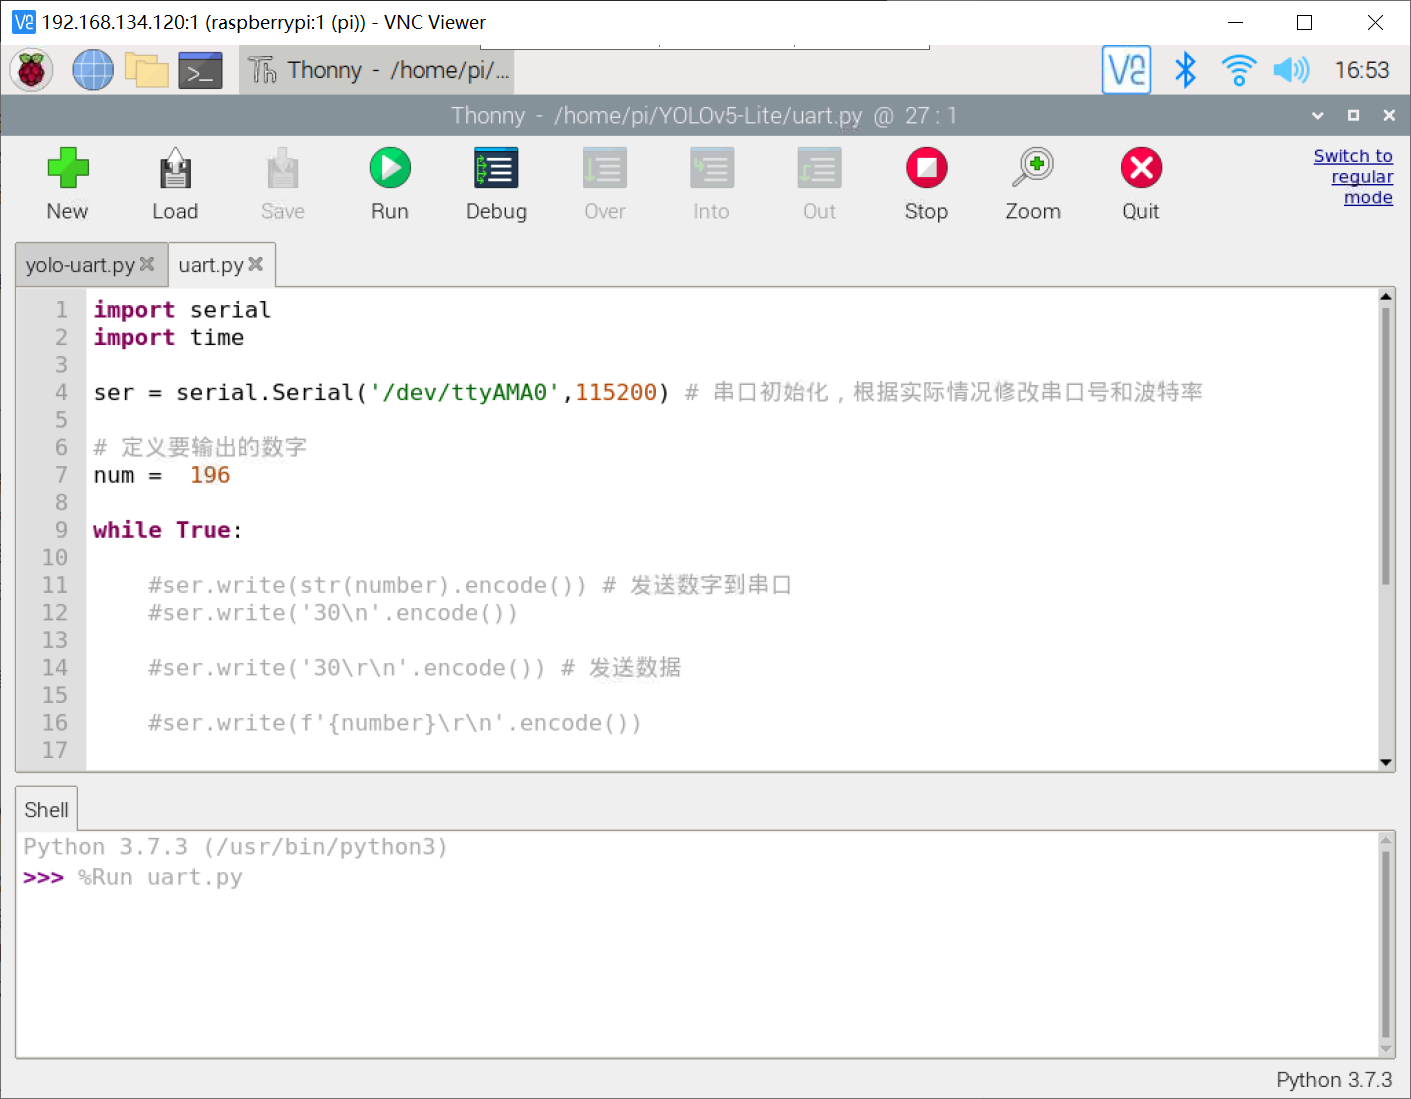
3.1 树莓派4b代码
我们利用 python 代码写一个循环发送数字的代码程序,具体代码如下:
import serial
import time
ser = serial.serial('/dev/ttyama0',115200) # 串口初始化,根据实际情况修改串口号和波特率
# 定义要输出的数字
num = 196
while true:
ser.write(str(int(num)).encode()) # 发送数字到串口
num += 1
if num > 205:
num = 196
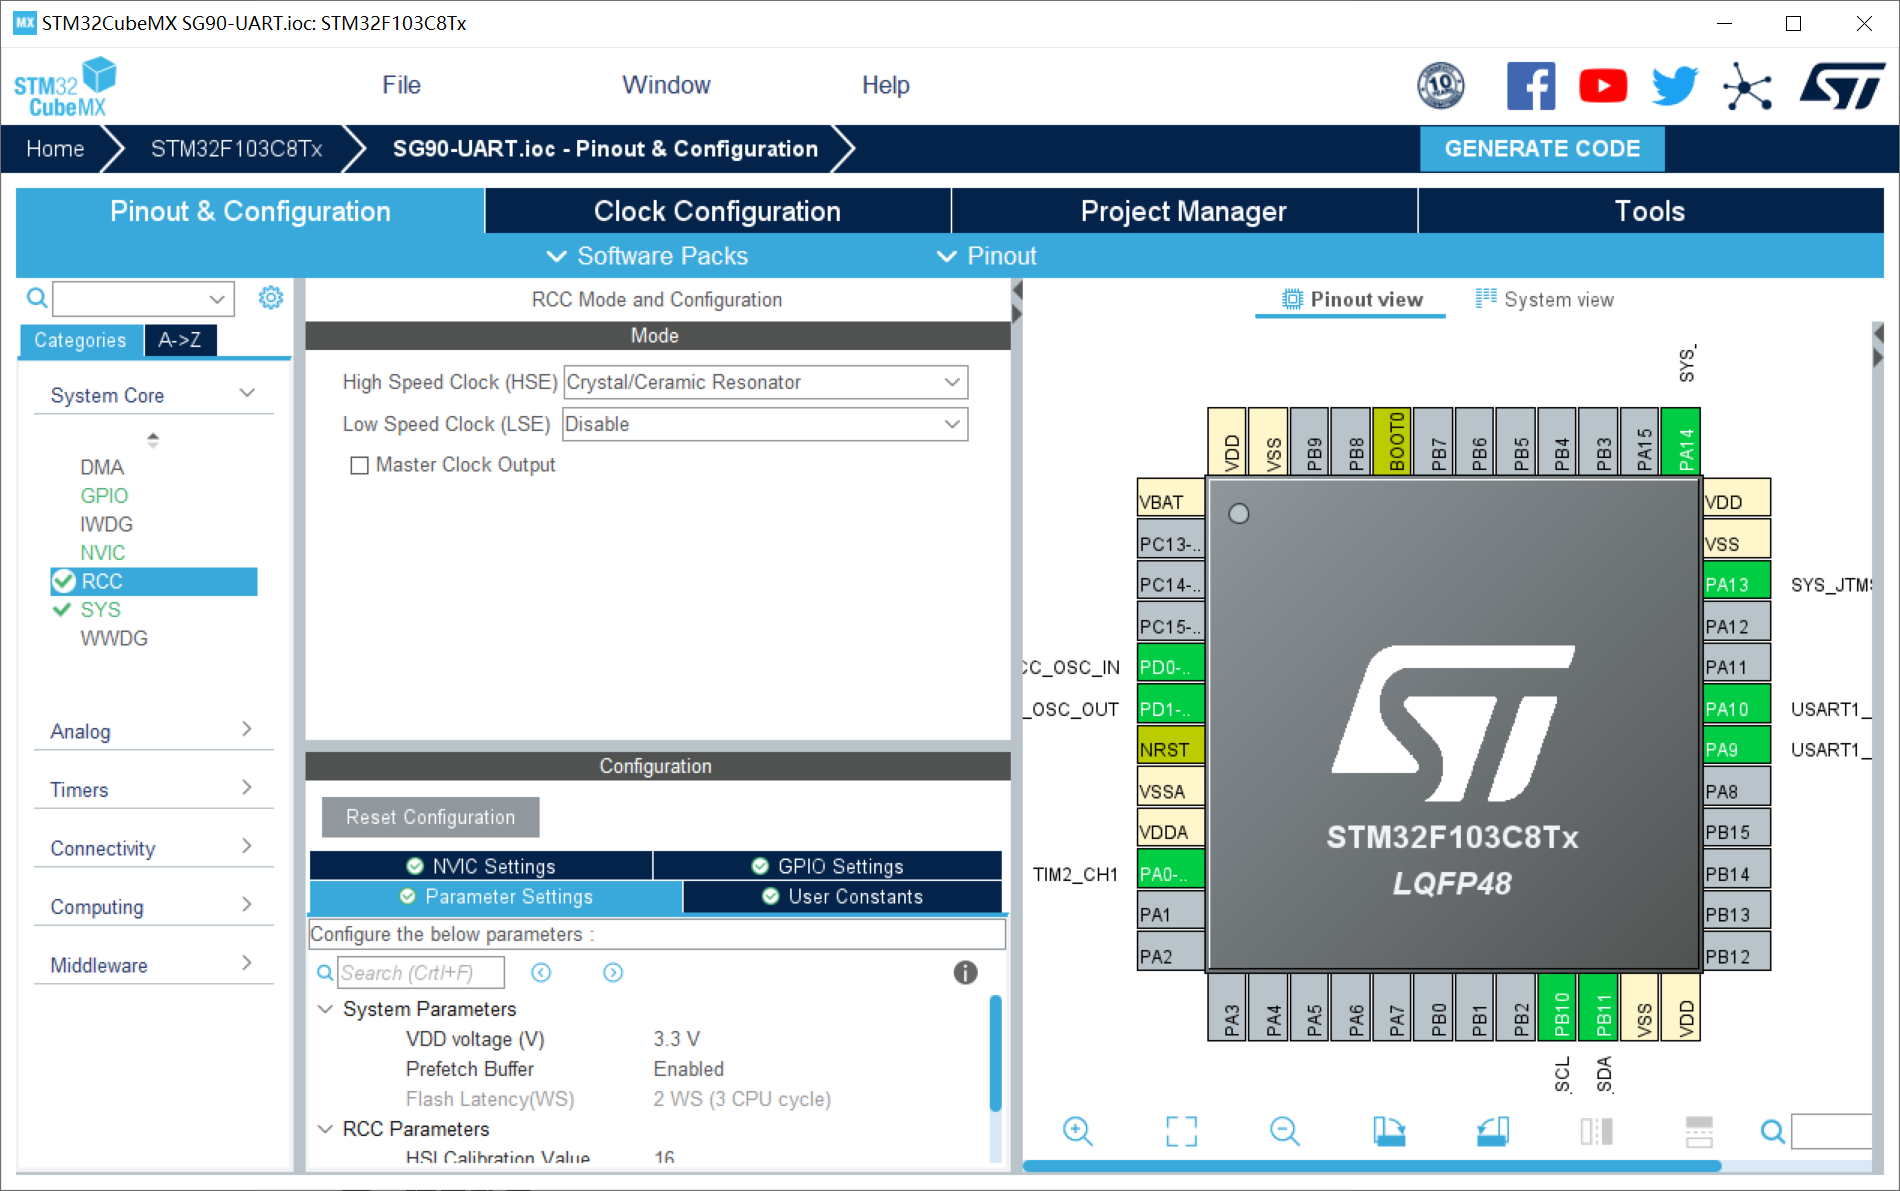
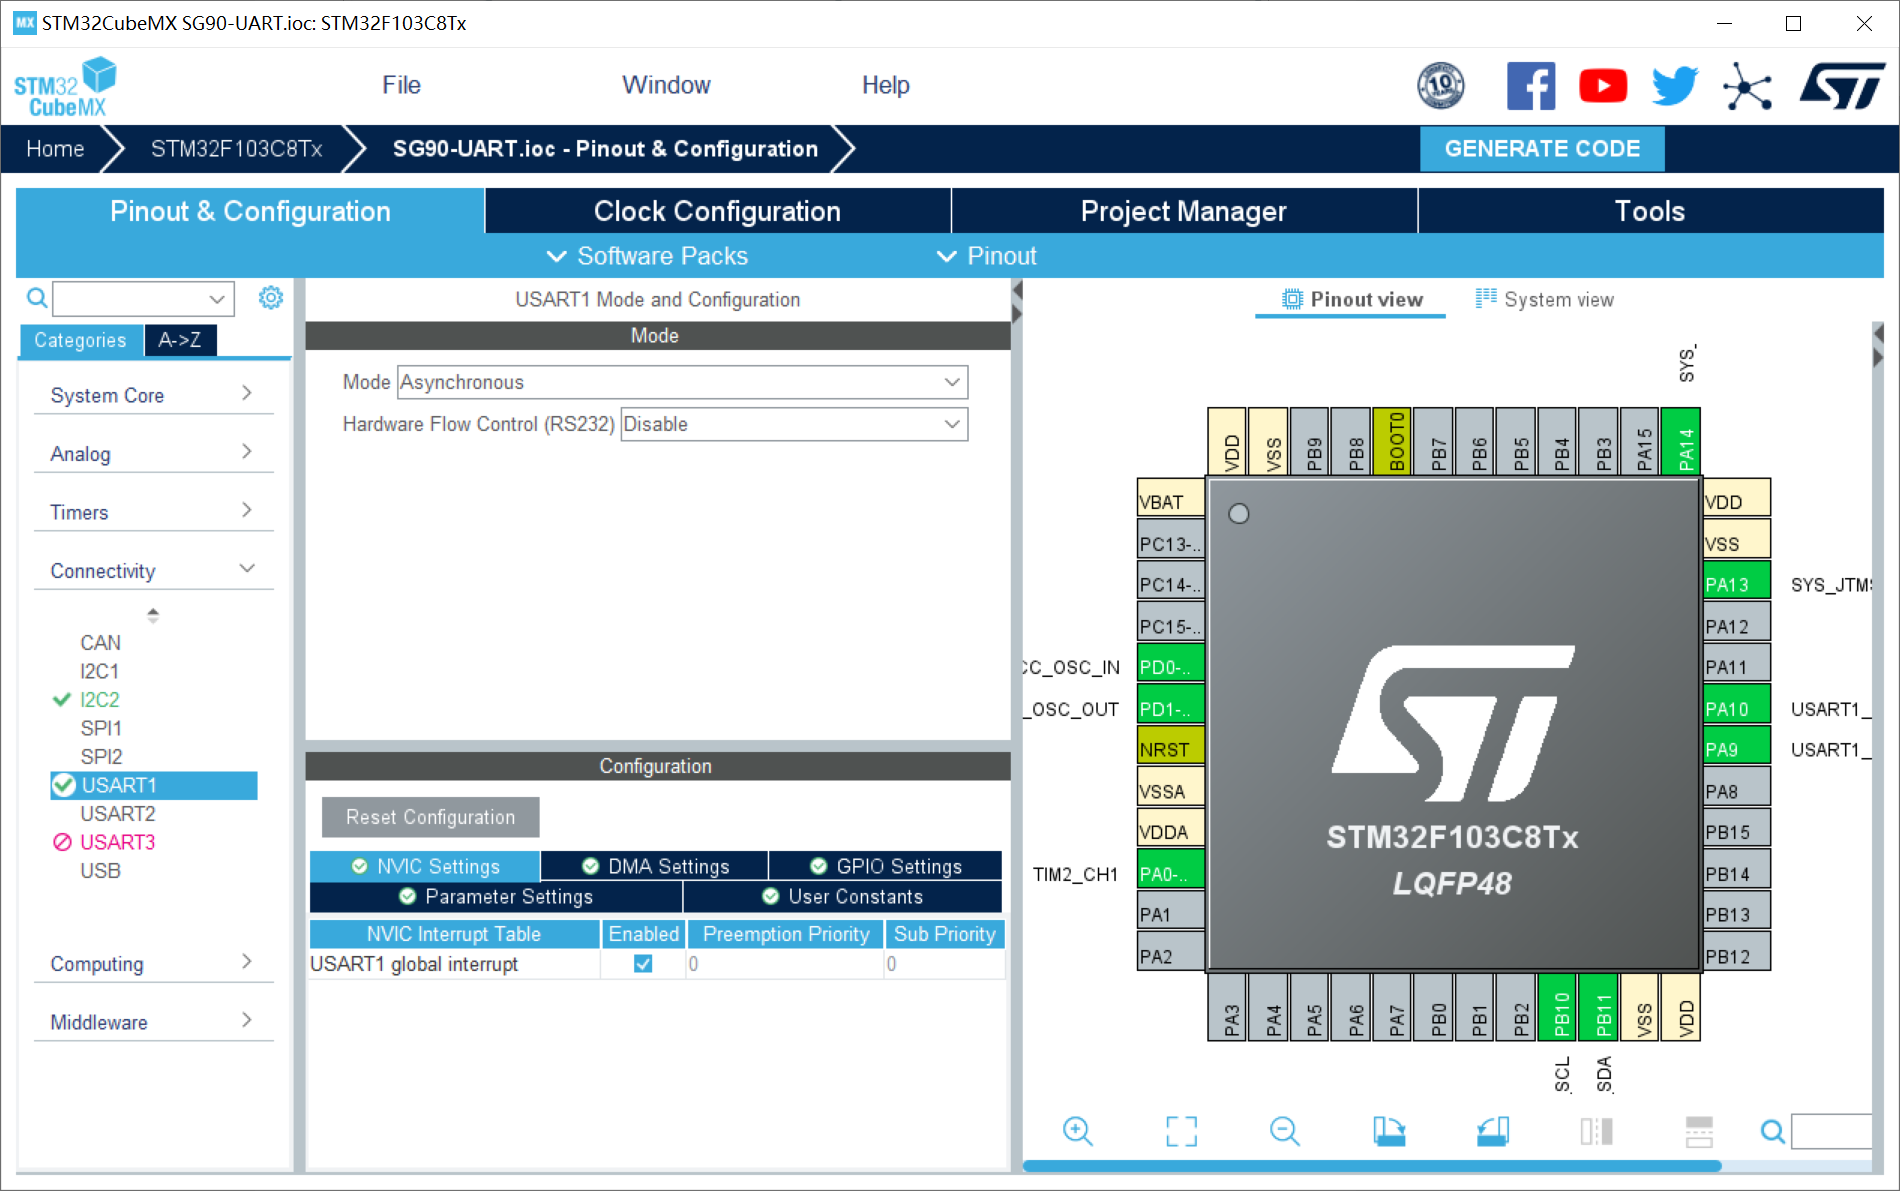
time.sleep(0.2) # 等待1秒钟 3.2 cubemx配置
1、rcc配置外部高速晶振(精度更高)——hse;
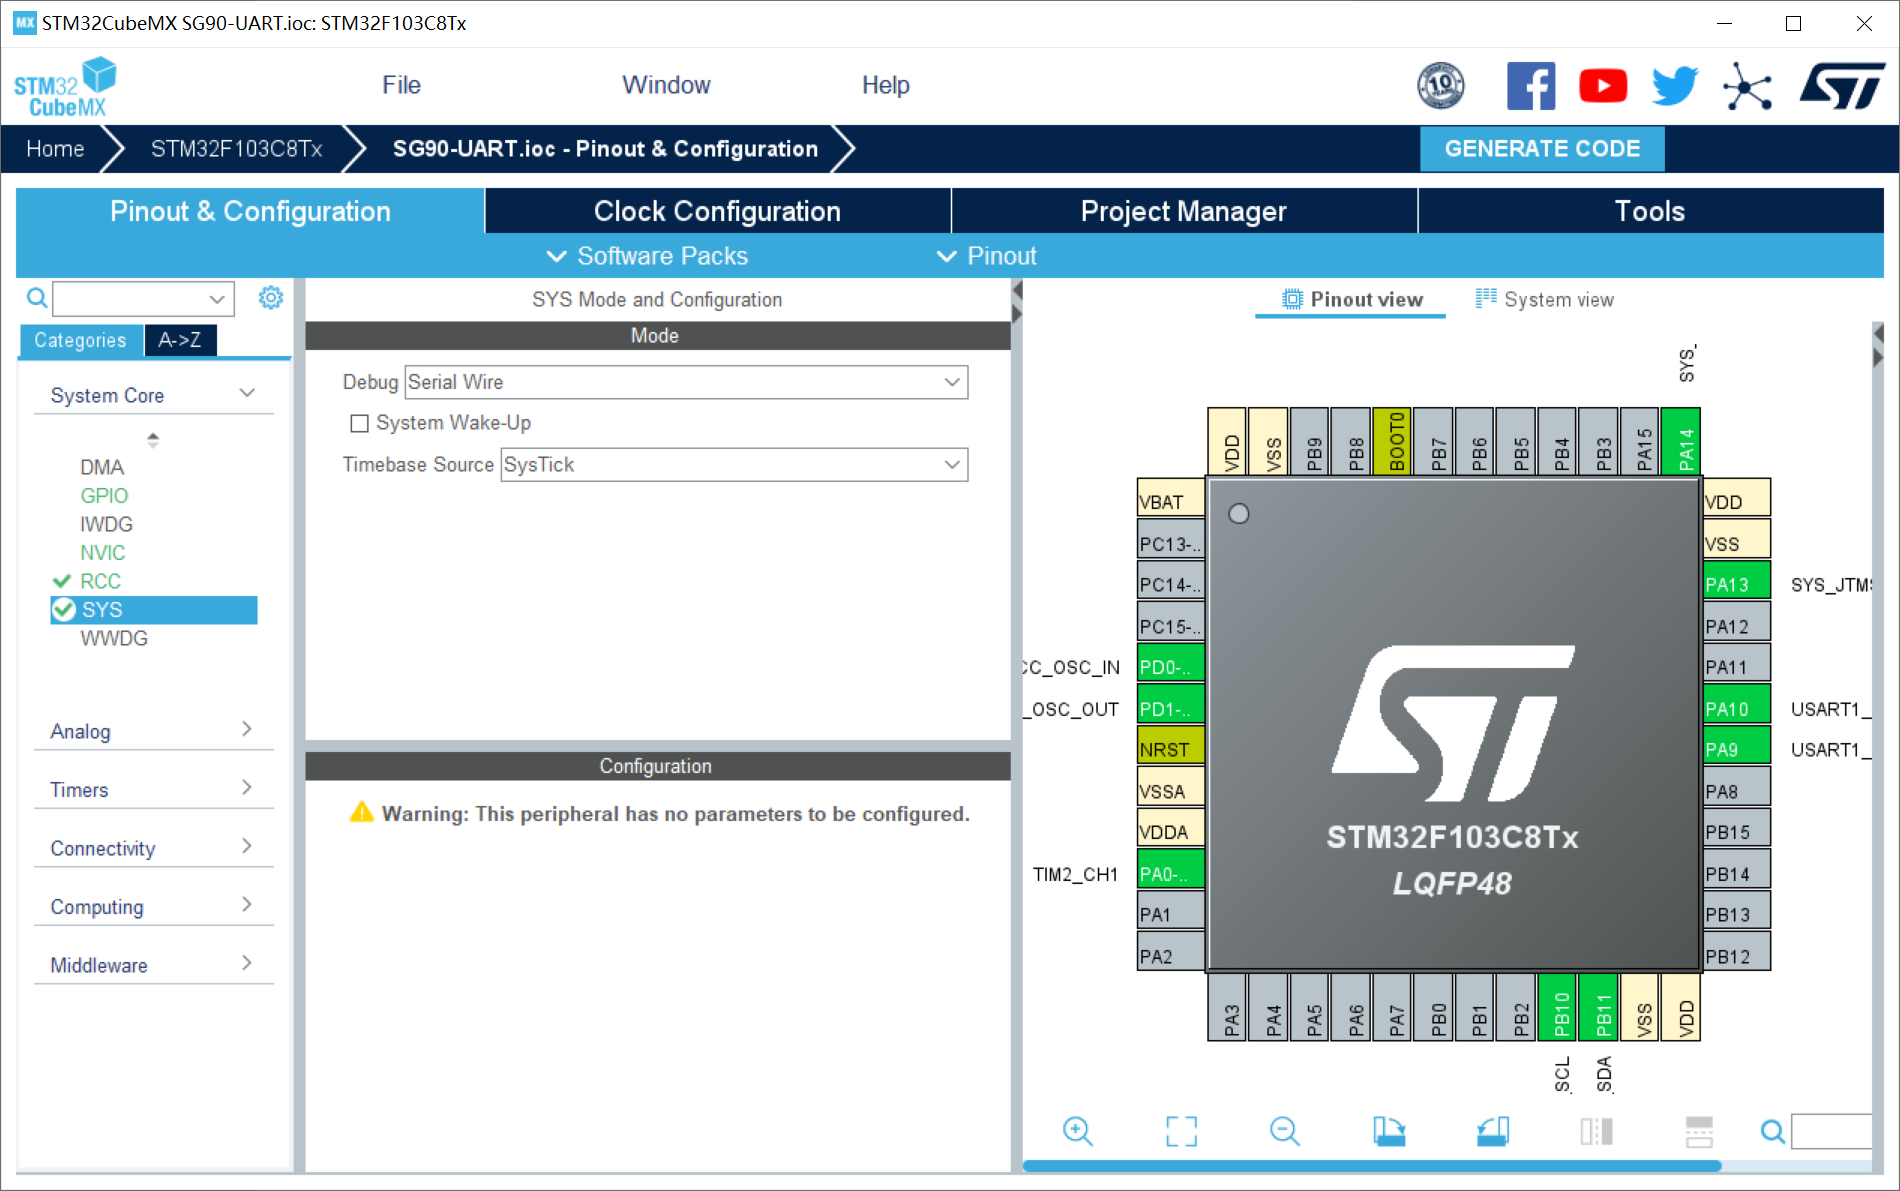
2、sys配置:debug设置成serial wire(否则可能导致芯片自锁);
3、i2c配置:
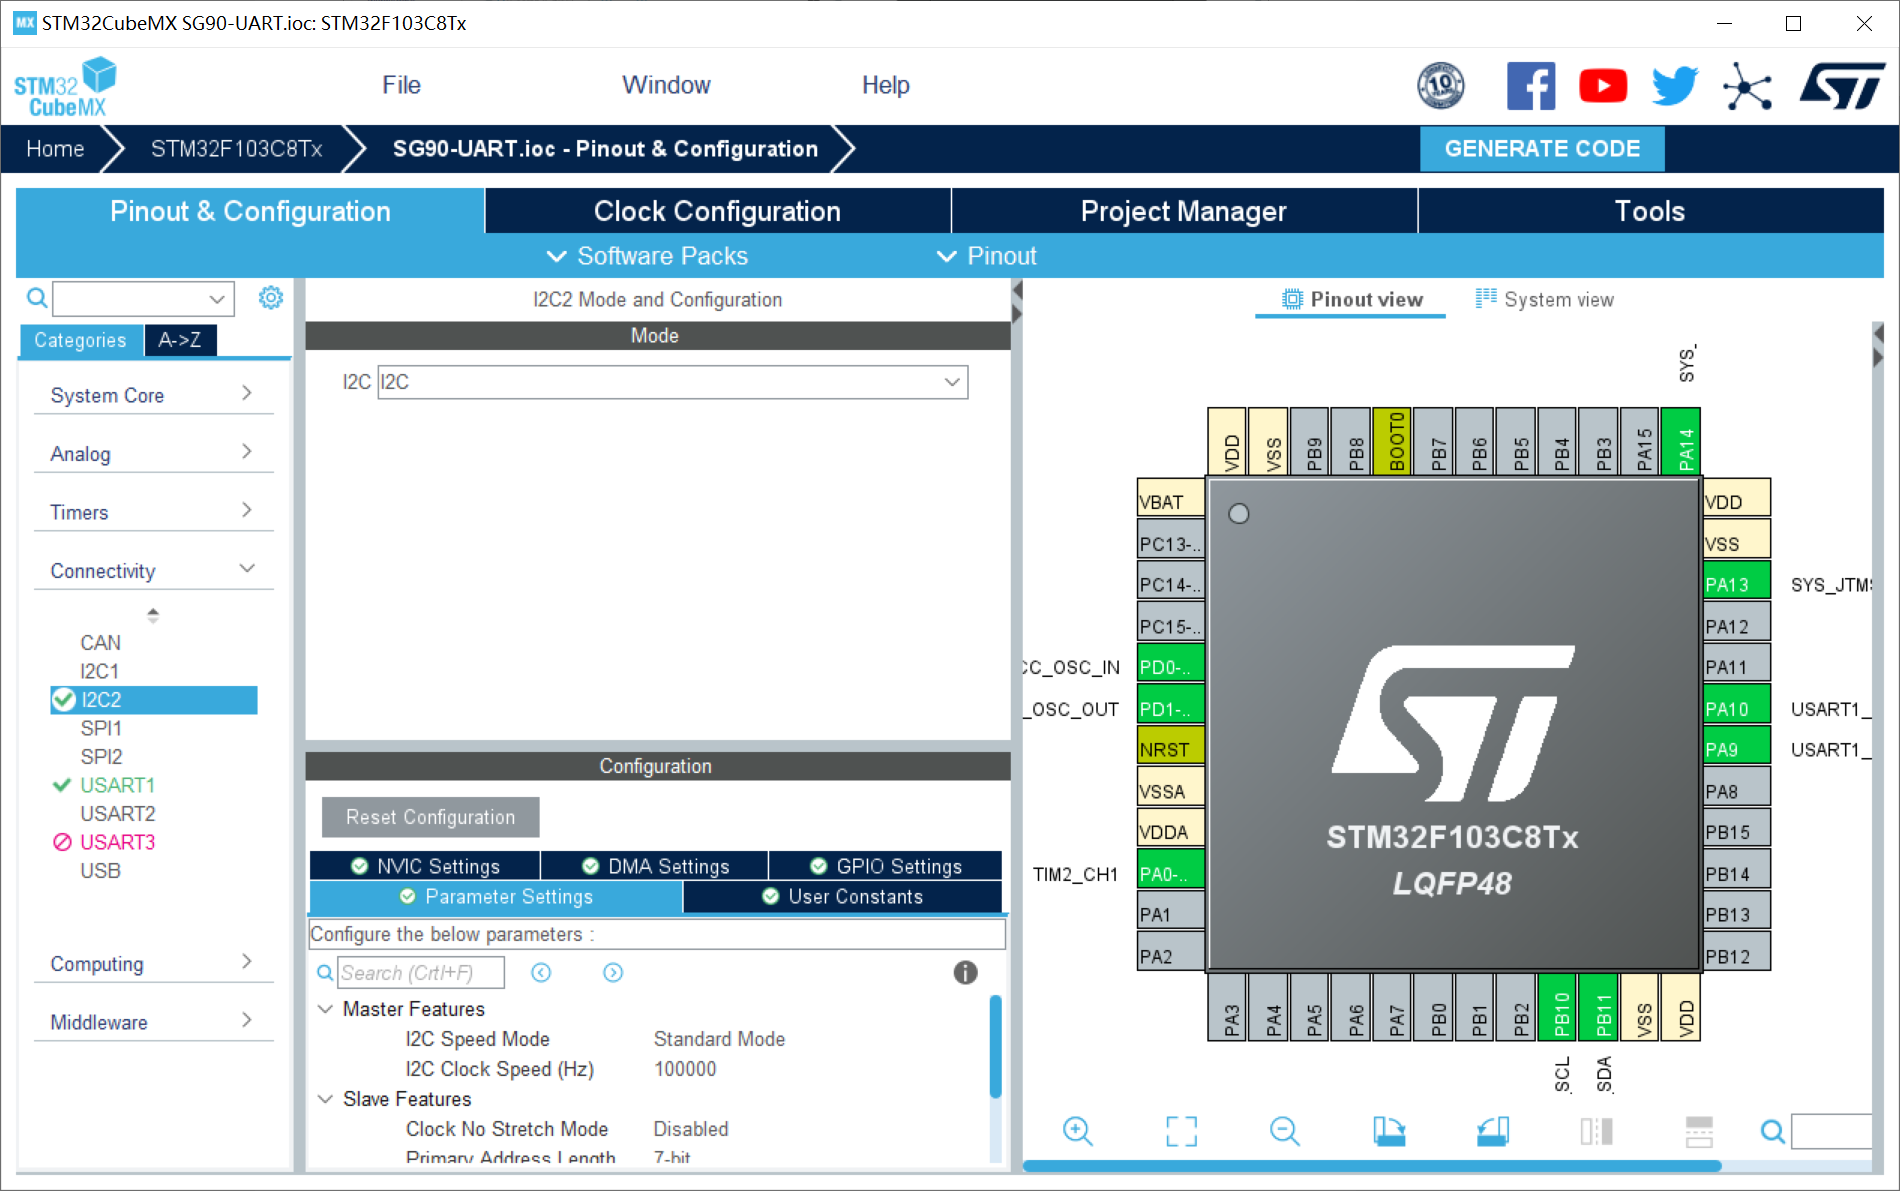
4、usart1配置:设置uart1串口;波特率:115200;开启uart串口中断;
5、时钟树配置

6、工程配置

3.3 stm32代码
3.3.1 oled代码
oled模块主要是方便显示树莓派4b发送给stm32的数据信息!考虑到实际情况,我们一般需要根据树莓派4b发送过来的数字信息,所以,我们这里利用oled进行数字显示!
小数显示api函数:
//z_len为整数显示位数,f_len为小数显示位数,size2为字体大小
void oled_showdecimal(u8 x,u8 y,float num,u8 z_len,u8 f_len,u8 size2)
{
	u8 t,temp;
	u8 enshow;
	int z_temp,f_temp;
	z_temp=(int)num;
	//整数部分
	for(t=0;t<z_len;t++)
	{
		temp=(z_temp/oled_pow(10,z_len-t-1))%10;
		if(enshow==0 && t<(z_len-1))
		{
			if(temp==0)
			{
				oled_showchar(x+(size2/2)*t,y,' ',size2);
				continue;
			}
			else
			enshow=1;
		}
		oled_showchar(x+(size2/2)*t,y,temp+'0',size2);
	}
	//小数点
	oled_showchar(x+(size2/2)*(z_len),y,'.',size2);

	f_temp=(int)((num-z_temp)*(oled_pow(10,f_len)));
  //小数部分
	for(t=0;t<f_len;t++)
	{
		temp=(f_temp/oled_pow(10,f_len-t-1))%10;
		oled_showchar(x+(size2/2)*(t+z_len)+5,y,temp+'0',size2);
	}
}
3.3.2 uart代码
uart.h:
#ifndef __uart_h
#define __uart_h

#include "stm32f1xx_hal.h"

extern uart_handletypedef huart1;

#define usart1_rec_len  600

extern int  usart1_rx_buf[usart1_rec_len];
extern uint16_t usart1_rx_sta;
extern int usart1_newdata;

void  hal_uart_rxcpltcallback(uart_handletypedef  *huart);

#endif
uart.c:
#include "uart.h"
#include "oled.h"

int usart1_rx_buf[usart1_rec_len];		//目标数据
uint16_t usart1_rx_sta=2;
int usart1_newdata;

extern int num;		//百位
extern int num2;    //十位
extern int num3;    //个位


void  hal_uart_rxcpltcallback(uart_handletypedef  *huart)
{
    if(huart ==&huart1)
    {

      usart1_rx_buf[usart1_rx_sta&0x7fff]=usart1_newdata;
      usart1_rx_sta++;


      if(usart1_rx_sta>(usart1_rec_len-1))usart1_rx_sta=0;

			//num = usart1_rx_buf[usart1_rx_sta];

			hal_uart_receive_it(&huart1,(uint8_t *)&usart1_newdata,1);

			num = usart1_rx_buf[usart1_rx_sta-1];
			num2 = usart1_rx_buf[usart1_rx_sta-2];
			num3 = usart1_rx_buf[usart1_rx_sta-3];
    }
}
3.3.3 数据解码代码
control.c:
#include "control.h"
#include "uart.h"
#include "tim.h"
#include "oled.h"
int num;
int num2;
int num3;
int value;
int flag;
int last;
void targettracking()
{
flag = usart1_rx_sta - last;
last = usart1_rx_sta;
value = (num3-48) * 100 + (num2-48) * 10 + (num-48) * 1;
oled_showstr(10,2,"object center",2);
oled_showdecimal(45,4,value,3,1,16);
if(flag == 2)
{
value = (num2-48) * 10 + (num-48) * 1;
oled_showdecimal(40,4,value,3,1,16);
}
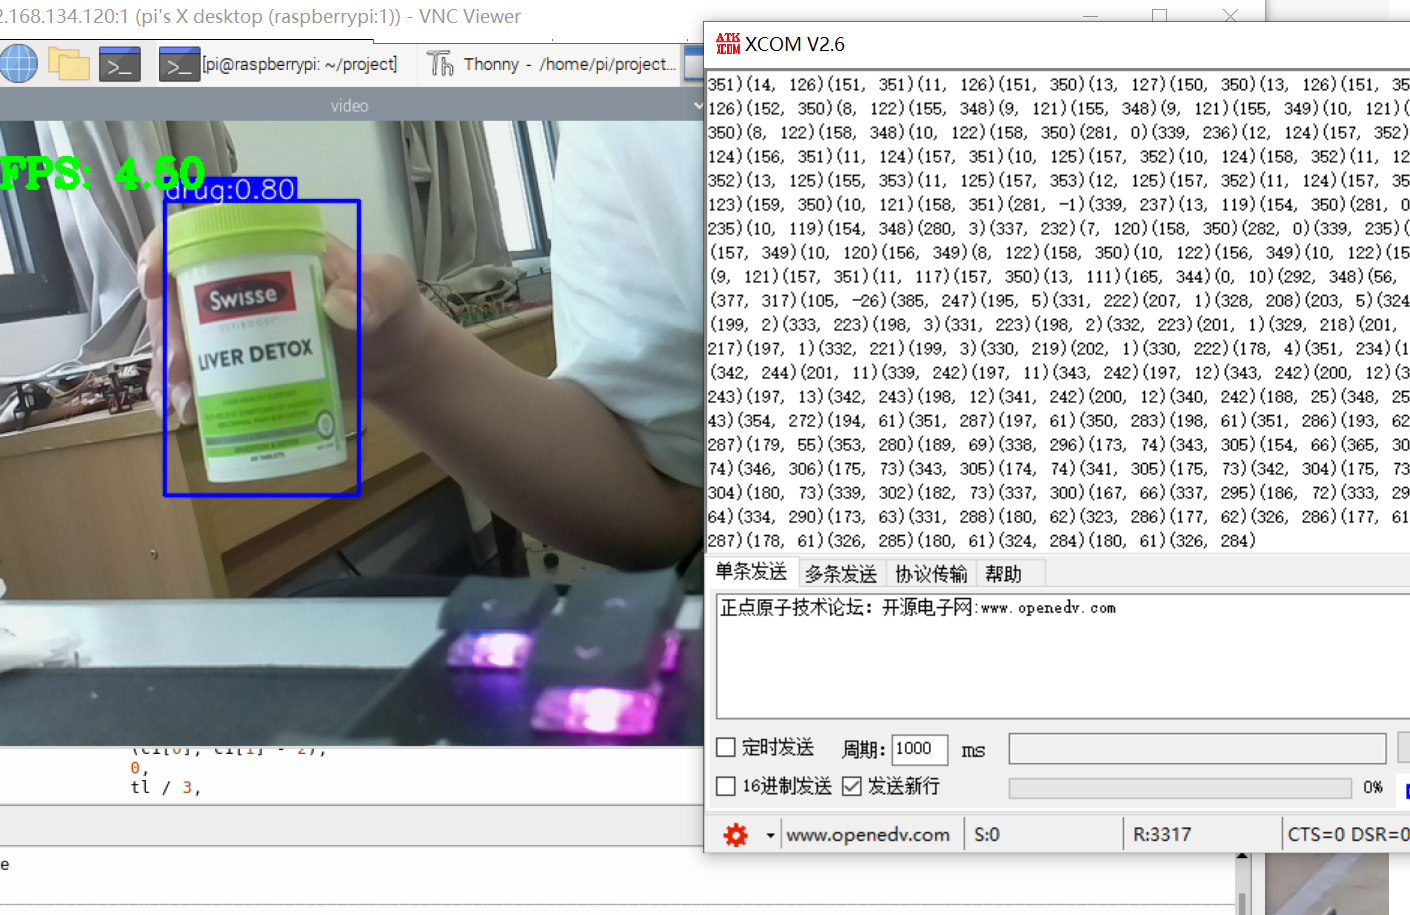
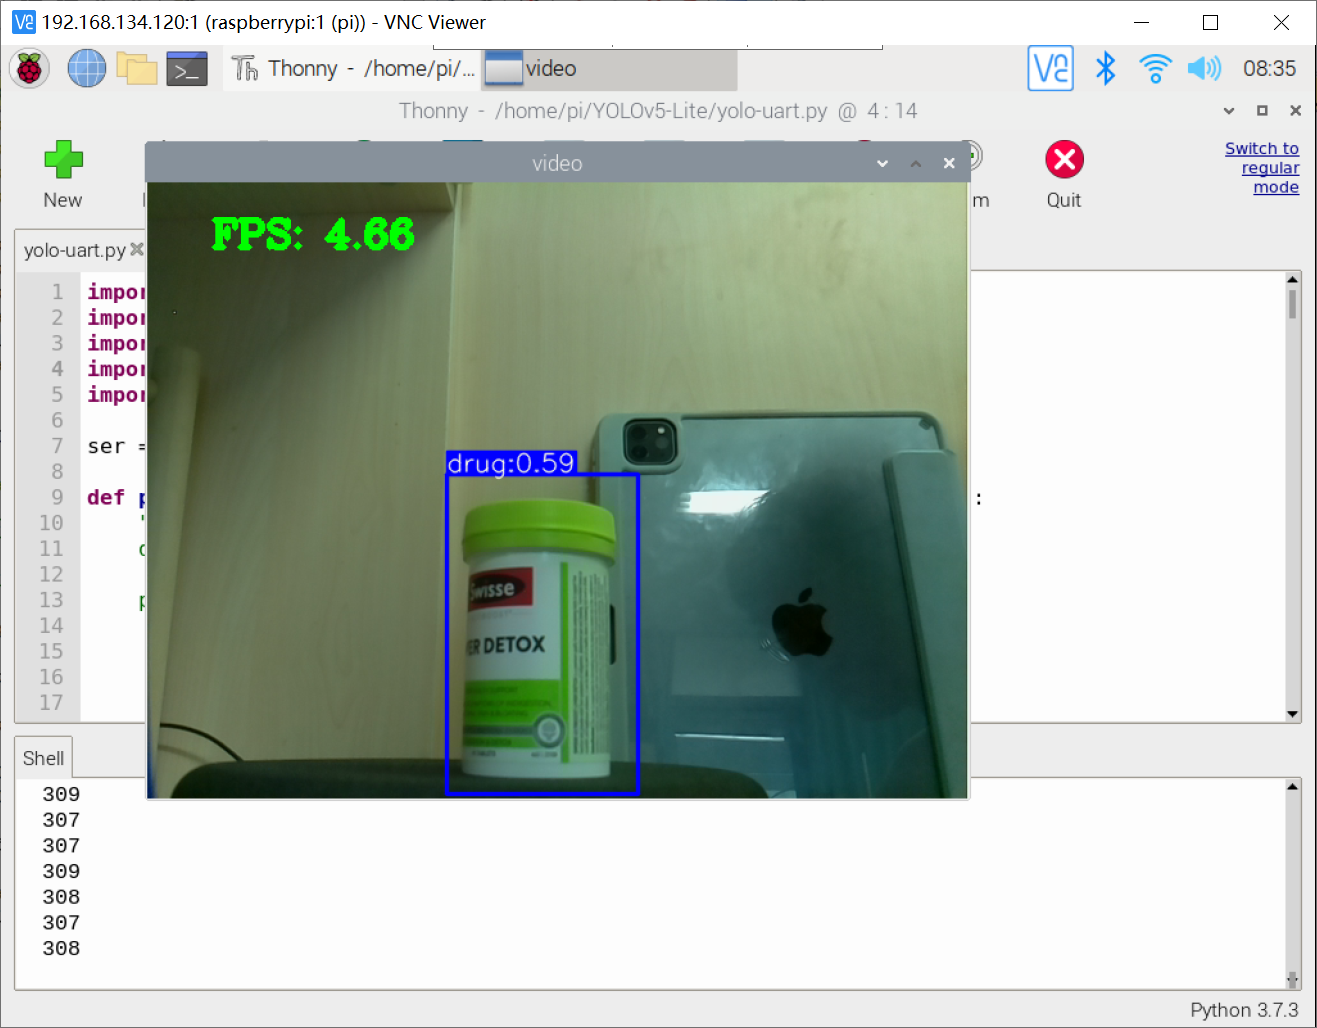
}代码运行之后:

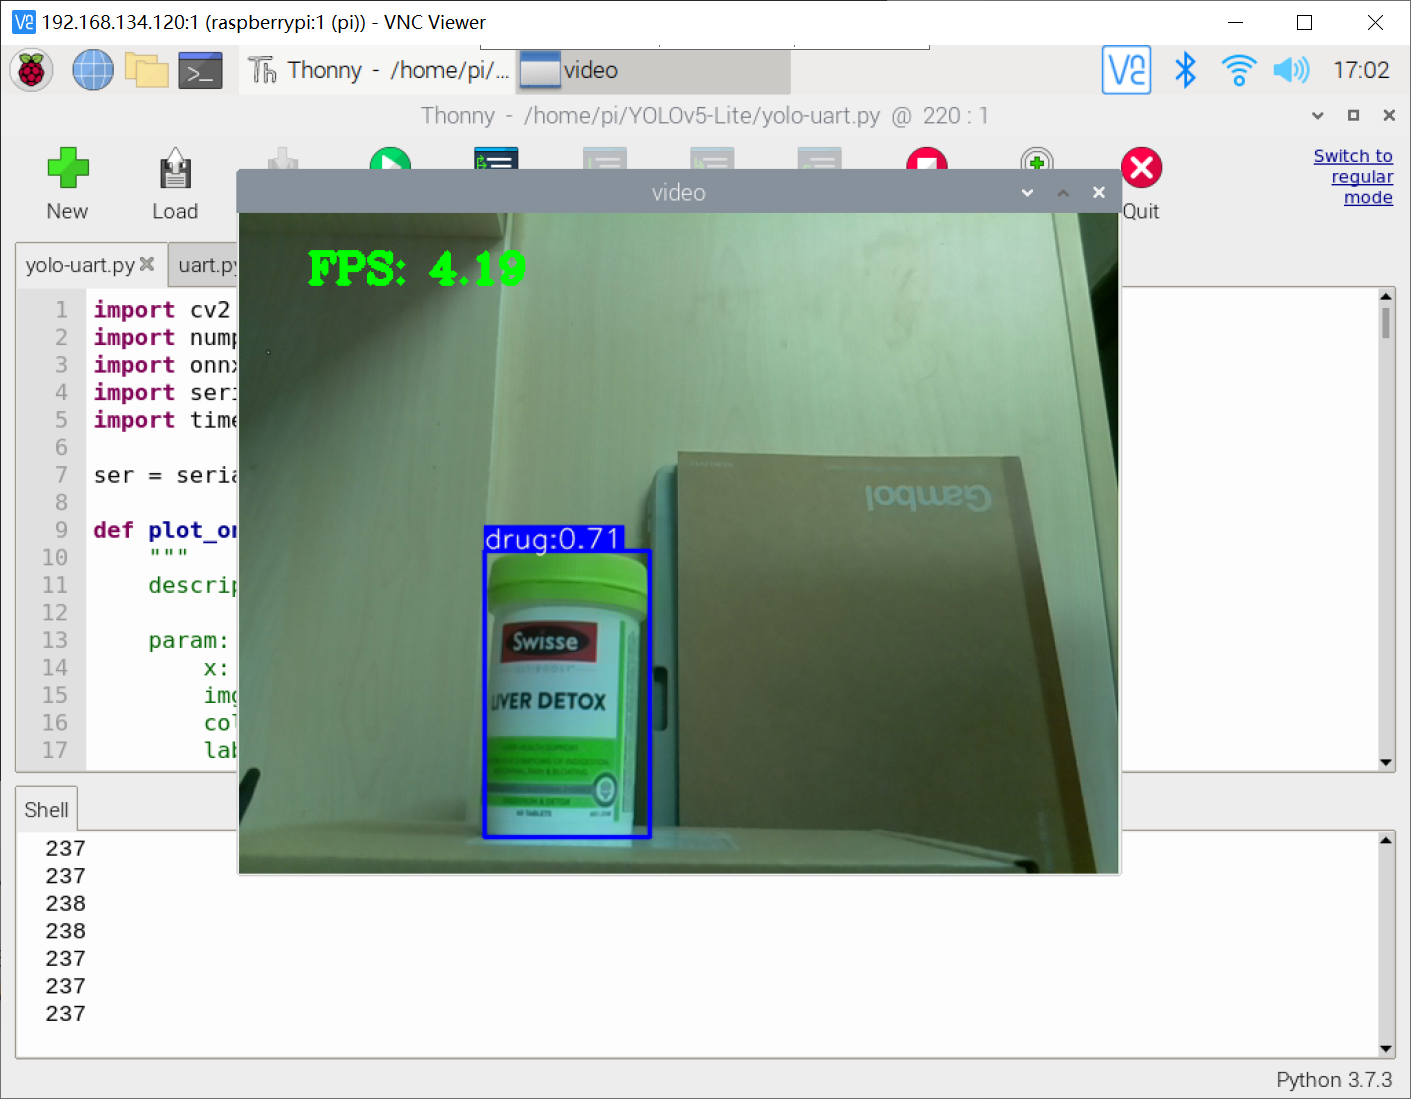
四、高级应用
作者这里以上一篇博客的网络模型检测结果为例,代码如下:
import cv2
import numpy as np
import onnxruntime as ort
import serial
import time

ser = serial.serial('/dev/ttyama0',115200)

def plot_one_box(x, img, color=none, label=none, line_thickness=none):
    """
    description: plots one bounding box on image img,
                 this function comes from yolov5 project.
    param:
        x:      a box likes [x1,y1,x2,y2]
        img:    a opencv image object
        color:  color to draw rectangle, such as (0,255,0)
        label:  str
        line_thickness: int
    return:
        no return
    """
    tl = (
        line_thickness or round(0.002 * (img.shape[0] + img.shape[1]) / 2) + 1
    )  # line/font thickness
    color = color or [random.randint(0, 255) for _ in range(3)]
    c1, c2 = (int(x[0]), int(x[1])), (int(x[2]), int(x[3]))

    ser.write(str(int((int(x[2])-int(x[0]))/2+int(x[0]))).encode())
    print(int((int(x[2])-int(x[0]))/2+int(x[0])))

    cv2.rectangle(img, c1, c2, color, thickness=tl, linetype=cv2.line_aa)
    if label:
        tf = max(tl - 1, 1)  # font thickness
        t_size = cv2.gettextsize(label, 0, fontscale=tl / 3, thickness=tf)[0]
        c2 = c1[0] + t_size[0], c1[1] - t_size[1] - 3
        cv2.rectangle(img, c1, c2, color, -1, cv2.line_aa)  # filled
        cv2.puttext(
            img,
            label,
            (c1[0], c1[1] - 2),
            0,
            tl / 3,
            [225, 255, 255],
            thickness=tf,
            linetype=cv2.line_aa,
        )

def _make_grid( nx, ny):
        xv, yv = np.meshgrid(np.arange(ny), np.arange(nx))
        return np.stack((xv, yv), 2).reshape((-1, 2)).astype(np.float32)

def cal_outputs(outs,nl,na,model_w,model_h,anchor_grid,stride):

    row_ind = 0
    grid = [np.zeros(1)] * nl
    for i in range(nl):
        h, w = int(model_w/ stride[i]), int(model_h / stride[i])
        length = int(na * h * w)
        if grid[i].shape[2:4] != (h, w):
            grid[i] = _make_grid(w, h)

        outs[row_ind:row_ind + length, 0:2] = (outs[row_ind:row_ind + length, 0:2] * 2. - 0.5 + np.tile(
            grid[i], (na, 1))) * int(stride[i])
        outs[row_ind:row_ind + length, 2:4] = (outs[row_ind:row_ind + length, 2:4] * 2) ** 2 * np.repeat(
            anchor_grid[i], h * w, axis=0)
        row_ind += length
    return outs


def post_process_opencv(outputs,model_h,model_w,img_h,img_w,thred_nms,thred_cond):
    conf = outputs[:,4].tolist()
    c_x = outputs[:,0]/model_w*img_w
    c_y = outputs[:,1]/model_h*img_h
    w  = outputs[:,2]/model_w*img_w
    h  = outputs[:,3]/model_h*img_h
    p_cls = outputs[:,5:]
    if len(p_cls.shape)==1:
        p_cls = np.expand_dims(p_cls,1)
    cls_id = np.argmax(p_cls,axis=1)

    p_x1 = np.expand_dims(c_x-w/2,-1)
    p_y1 = np.expand_dims(c_y-h/2,-1)
    p_x2 = np.expand_dims(c_x+w/2,-1)
    p_y2 = np.expand_dims(c_y+h/2,-1)
    areas = np.concatenate((p_x1,p_y1,p_x2,p_y2),axis=-1)

    areas = areas.tolist()
    ids = cv2.dnn.nmsboxes(areas,conf,thred_cond,thred_nms)
    if len(ids)>0:
        return  np.array(areas)[ids],np.array(conf)[ids],cls_id[ids]
    else:
        return [],[],[]
def infer_img(img0,net,model_h,model_w,nl,na,stride,anchor_grid,thred_nms=0.4,thred_cond=0.5):
    # 图像预处理
    img = cv2.resize(img0, [model_w,model_h], interpolation=cv2.inter_area)
    img = cv2.cvtcolor(img, cv2.color_bgr2rgb)
    img = img.astype(np.float32) / 255.0
    blob = np.expand_dims(np.transpose(img, (2, 0, 1)), axis=0)

    # 模型推理
    outs = net.run(none, {net.get_inputs()[0].name: blob})[0].squeeze(axis=0)

    # 输出坐标矫正
    outs = cal_outputs(outs,nl,na,model_w,model_h,anchor_grid,stride)

    # 检测框计算
    img_h,img_w,_ = np.shape(img0)
    boxes,confs,ids = post_process_opencv(outs,model_h,model_w,img_h,img_w,thred_nms,thred_cond)

    return  boxes,confs,ids


if __name__ == "__main__":

    # 模型加载
    model_pb_path = "best.onnx"
    so = ort.sessionoptions()
    net = ort.inferencesession(model_pb_path, so)

    # 标签字典
    dic_labels= {0:'drug',
            1:'glue',
            2:'prime'}

    # 模型参数
    model_h = 320
    model_w = 320
    nl = 3
    na = 3
    stride=[8.,16.,32.]
    anchors = [[10, 13, 16, 30, 33, 23], [30, 61, 62, 45, 59, 119], [116, 90, 156, 198, 373, 326]]
    anchor_grid = np.asarray(anchors, dtype=np.float32).reshape(nl, -1, 2)

    video = 0
    cap = cv2.videocapture(video)
    flag_det = false
    while true:
        success, img0 = cap.read()
        if success:

            if flag_det:
                t1 = time.time()
                det_boxes,scores,ids = infer_img(img0,net,model_h,model_w,nl,na,stride,anchor_grid,thred_nms=0.4,thred_cond=0.5)
                t2 = time.time()


                for box,score,id in zip(det_boxes,scores,ids):
                    label = '%s:%.2f'%(dic_labels[id],score)

                    plot_one_box(box.astype(np.int16), img0, color=(255,0,0), label=label, line_thickness=none)

                str_fps = "fps: %.2f"%(1./(t2-t1))

                cv2.puttext(img0,str_fps,(50,50),cv2.font_hershey_complex,1,(0,255,0),3)


            cv2.imshow("video",img0)
        key=cv2.waitkey(1) & 0xff
        if key == ord('q'):

            break
        elif key & 0xff == ord('s'):
            flag_det = not flag_det
            print(flag_det)

    cap.release()

五、项目效果
基于树莓派4b与stm32通信追踪
六、项目代码
代码地址:基于树莓派4b与stm32的uart串口通信实验代码资源-csdn文库
如果积分不够的朋友,点波关注,评论区留下邮箱,作者无偿提供源码和后续问题解答。求求啦关注一波吧 !!!


发表评论