
既有适合小白学习的零基础资料,也有适合3年以上经验的小伙伴深入学习提升的进阶课程,涵盖了95%以上大数据知识点,真正体系化!
由于文件比较多,这里只是将部分目录截图出来,全套包含大厂面经、学习笔记、源码讲义、实战项目、大纲路线、讲解视频,并且后续会持续更新
public class temperaturereducer extends reducer<text, longwritable,
 text, temperature> {
    @override
    protected void reduce(text key, iterable<longwritable> values,
    		context context) throws ioexception, interruptedexception {
        long maxtemperature = long.min\_value;
        long mintemperature = long.max\_value;
        double avgtemperature = 0.0;
        long temp;
        int count = 0;
        if (values!=null) {
            for (longwritable value: values) {
                temp = value.get();
                maxtemperature = math.max(temp, maxtemperature);
                mintemperature = math.min(temp, mintemperature);
                avgtemperature += temp;
                count++;
            }
            temperature temperature = new temperature(maxtemperature,
            		mintemperature, avgtemperature/count);

            context.write(key, temperature);
        }

    }
}
计算出每日温度的最大值、最小值和平均值,并放入temperature对象中。
2.2.3 jobmain
public class jobmain extends configured implements tool {
    @override
    public int run(string[] strings) throws exception {
        // 创建一个任务对象
        job job = job.getinstance(super.getconf(), "mapreduce\_temperature");

        // 打包放在集群运行时,需要做一个配置
        job.setjarbyclass(jobmain.class);

        // 第一步:设置读取文件的类:k1和v1
        job.setinputformatclass(textinputformat.class);
        textinputformat.addinputpath(job,
        	new path("hdfs://node01:8020/usr/hadoop/in"));

        // 第二步:设置mapper类
        job.setmapperclass(temperaturemapper.class);
        // 设置map阶段的输出类型:k2和v2的类型
        job.setmapoutputkeyclass(text.class);
        job.setmapoutputvalueclass(longwritable.class);

        // 第三、四、五、六步采用默认方式(分区,排序,规约,分组)

        // 第七步:设置reducer类
        job.setreducerclass(temperaturereducer.class);
        // 设置reduce阶段的输出类型
        job.setoutputkeyclass(text.class);
        job.setoutputvalueclass(temperature.class);


        // 第八步:设置输出类
        job.setoutputformatclass(textoutputformat.class);
        // 设置输出路径
        textoutputformat.setoutputpath(job,
        	new path("hdfs://node01:8020/usr/hadoop/temperature"));

        boolean b = job.waitforcompletion(true);

        return b?0:1;
    }

    public static void main(string[] args) throws exception {
        configuration configuration = new configuration();
        // 启动一个任务
        toolrunner.run(configuration, new jobmain(), args);
    }

}
2.3 执行
2.3.1 打包、上传
老套路,不说了。
2.3.2 运行
hadoop jar temperature_test-1.0-snapshot.jar cn.sky.hadoop.jobmain
执行结果:
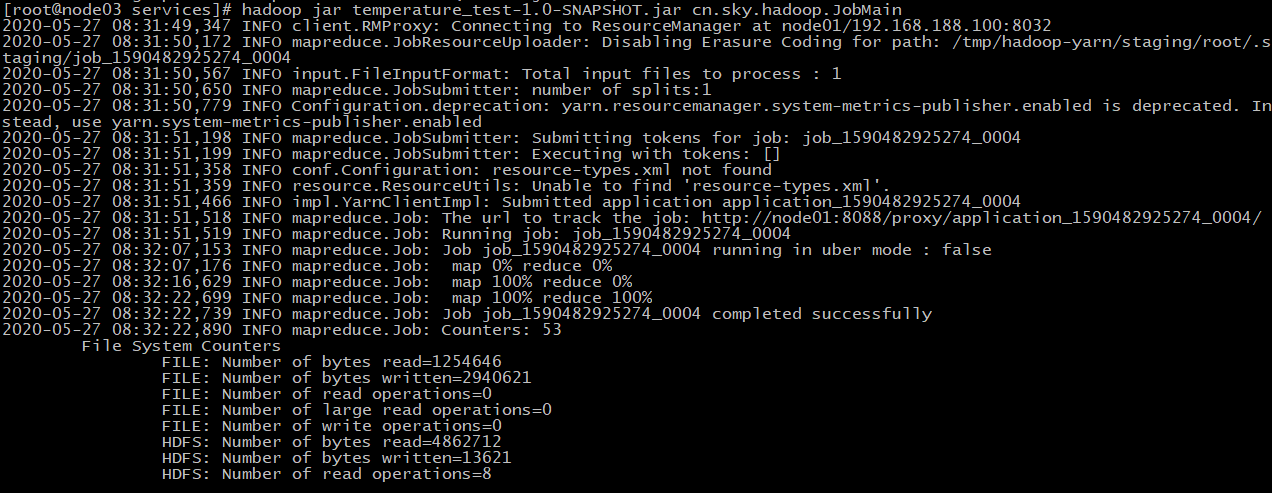
在这里看一眼数据:
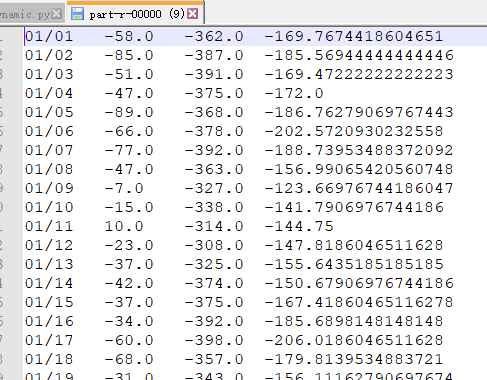
嗯,还行。
3 导入数据到hive
hive详情过程,请参考:大数据学习系列:hadoop3.0苦命学习(五)
有个问题,若直接从hdfs导入数据到hive,hdfs上的数据会丢失。
所以我将数据下载下来,重命名为 temperature_data ,并上传到 node03 上
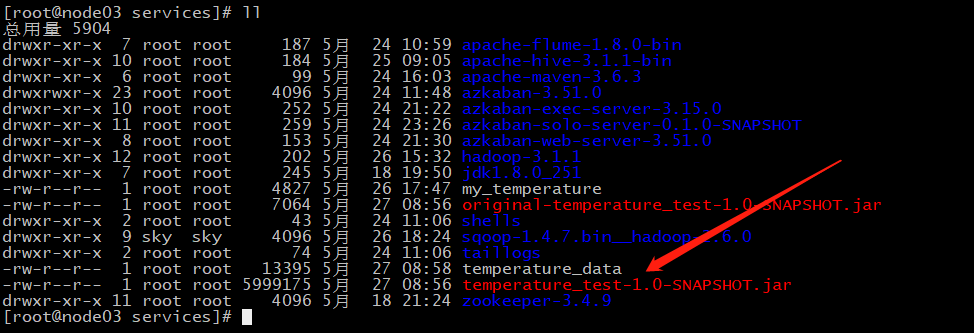
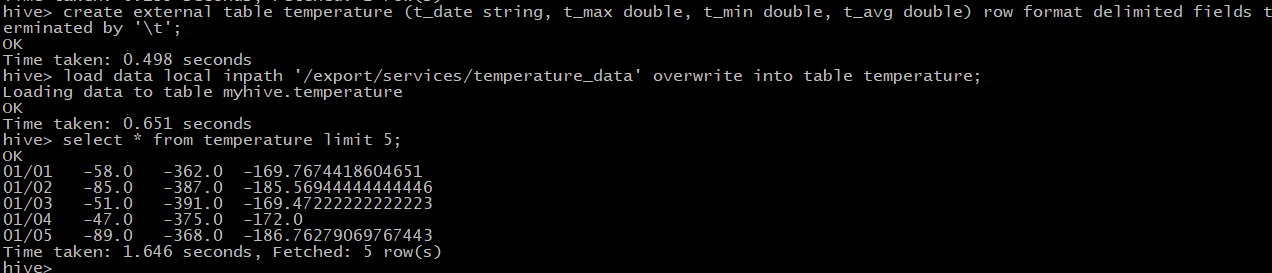
数据有了,开始创建hive表:
 create external table temperature (t_date string, t_max double,
 	t_min double, t_avg double) row format delimited fields terminated by '\t';
加载数据到hive:
load data local inpath '/export/services/temperature_data' overwrite
	into table temperature;
查前面5条数据,看一眼:
select * from temperature limit 5;
4 hive数据分析
弄得简单,就查几个静态数据吧。
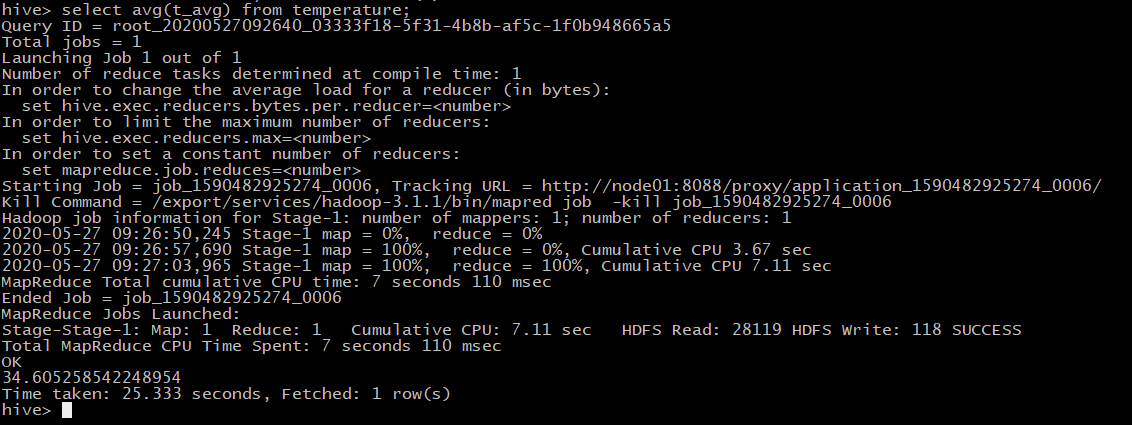
- 查询2019全年平均温度
select avg(t_avg) from temperature;
哇,太慢了,查了25秒,最终结果是3.46(因为数据是被放大了10倍)左右
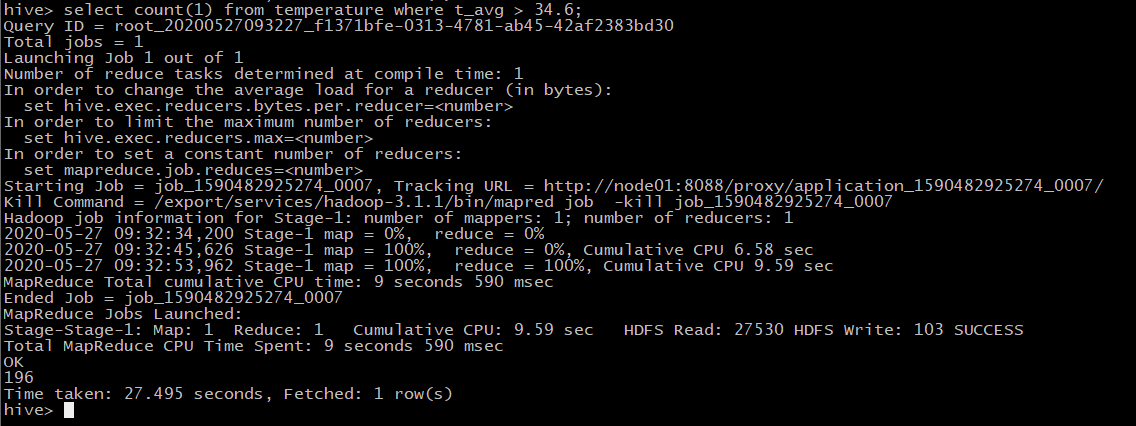
- 查询2019全年高于平均温度的天数
select count(1) from temperature where t_avg > 34.6;
答案是:196天,很显然低于平均气温的天数是169天。
好了,差不多就行了。
5 使用sqoop导入数据到mysql
sqoop详情过程,请参考:大数据学习系列:hadoop3.0苦命学习(七)
5.1 mysql创建数据库
create table `temperature` (
  `tem_date` varchar(10) not null,
  `tem_max` double default null,
  `tem_min` double default null,
  `tem_avg` double default null,
  primary key (`tem_date`)
) engine=innodb default charset=utf8
5.2 开始导入
bin/sqoop export --connect jdbc:mysql://192.168.0.102:3306/userdb
	--username root --password 123456 --table temperature
	--export-dir /usr/hadoop/temperature --input-fields-terminated-by "\t"
经过半分钟的等待,就可以在mysql中查到数据了,见下图:
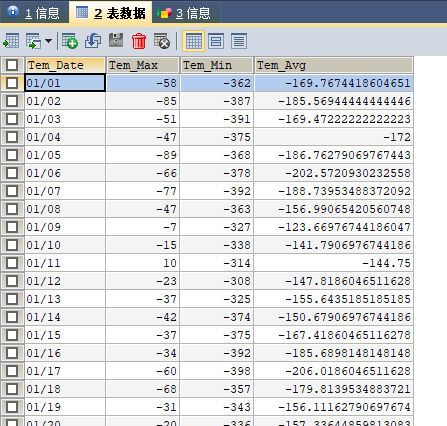
不错,数据很好。
6 展示数据
这里前端使用echart,jsp,后端使用spring、springmvc、mybatis。
代码较多,展示主要的。
6.1 前端代码
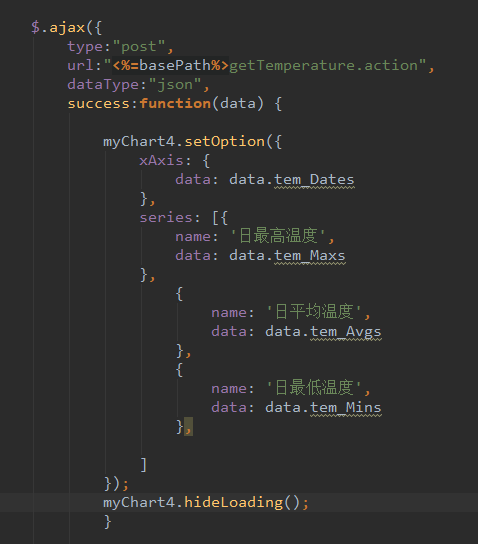
主要是这一段,使用ajax向后台请求数据,然后将数据丢进echart中。
6.2 后端代码
controller层
@autowired
    private temperatureservice tempservice;
    @requestmapping("/gettemperature.action")
    @responsebody
    public temperaturereturnpojo gettemperature(){
        temperaturereturnpojo temperaturepojo =  tempservice.getalltemperature();
        system.out.println(temperaturepojo);
        return temperaturepojo;
    }
service层
public interface temperatureservice {
    temperaturereturnpojo getalltemperature();
}
service实现类
@service
public class temperatureserviceimpl implements temperatureservice {
    @autowired
    private temperaturemapper temperaturemapper;
    @override
    public temperaturereturnpojo getalltemperature() {
        temperaturereturnpojo temperaturereturnpojo
        	= new temperaturereturnpojo();

        arraylist<string> dates = new arraylist<>();
        arraylist<string> maxs = new arraylist<>();
        arraylist<string> mins = new arraylist<>();
        arraylist<string> avgs = new arraylist<>();
        decimalformat df = new decimalformat("#.00");

        list<temperaturepojo> alltemperature
        	= temperaturemapper.getalltemperature();
        for (temperaturepojo pojo : alltemperature) {
            dates.add(pojo.gettem\_date());
            maxs.add(df.format(pojo.gettem\_max()/10.0));
            mins.add(df.format(pojo.gettem\_min()/10.0));
            avgs.add(df.format(pojo.gettem\_avg()/10.0));
        }
        temperaturereturnpojo.settem\_dates(dates);
        temperaturereturnpojo.settem\_maxs(maxs);
        temperaturereturnpojo.settem\_mins(mins);
        temperaturereturnpojo.settem\_avgs(avgs);

        return temperaturereturnpojo;
    }
}
实体类
public class temperaturepojo {
    private string tem\_date;
    private double tem\_max;
    private double tem\_min;
    private double tem\_avg;

	// 省略get()、set()、tostring()方法
}

public class temperaturereturnpojo {
    private list<string> tem\_dates;
    private list<string> tem\_maxs;
    private list<string> tem\_mins;
    private list<string> tem\_avgs;
 	// 省略get()、set()、tostring()方法
}
mapper
public interface temperaturemapper {
    list<temperaturepojo> getalltemperature();
}
<mapper namespace="cn.itcast.weblog.mapper.temperaturemapper" >
    <select id="getalltemperature"
 resulttype="cn.itcast.weblog.pojo.temperaturepojo">
        select * from temperature;
    </select>

</mapper>
运行结果如下:
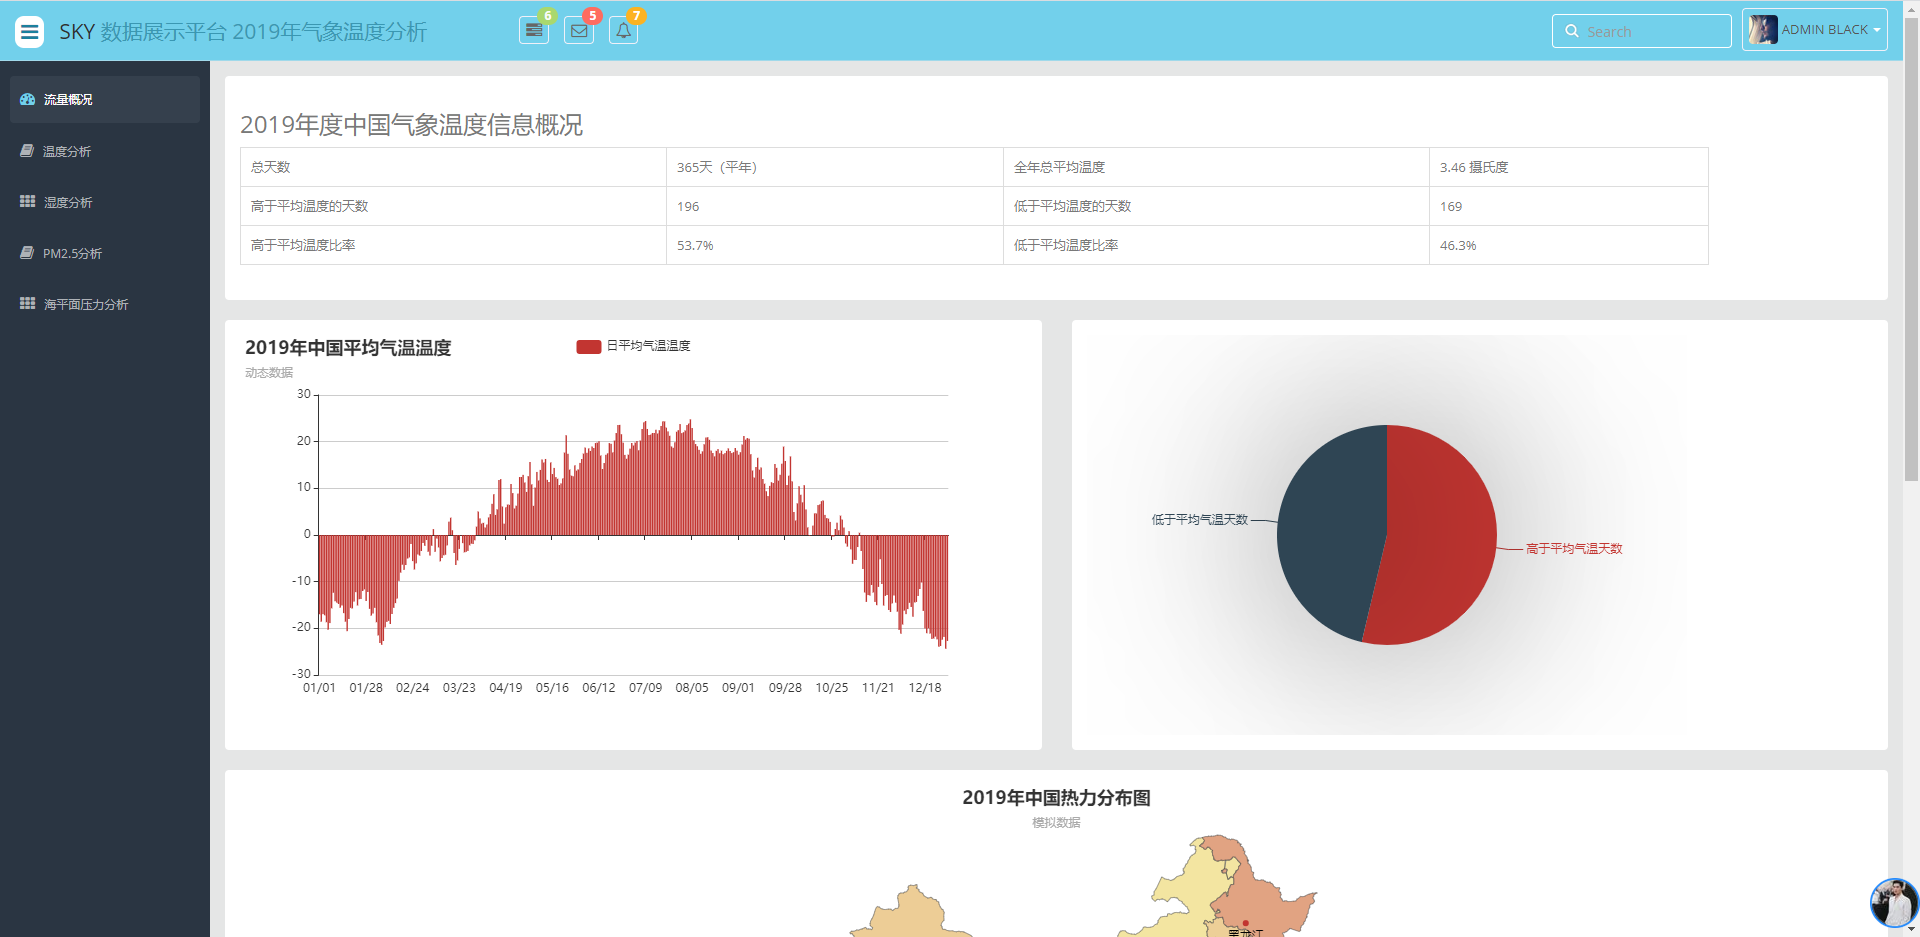
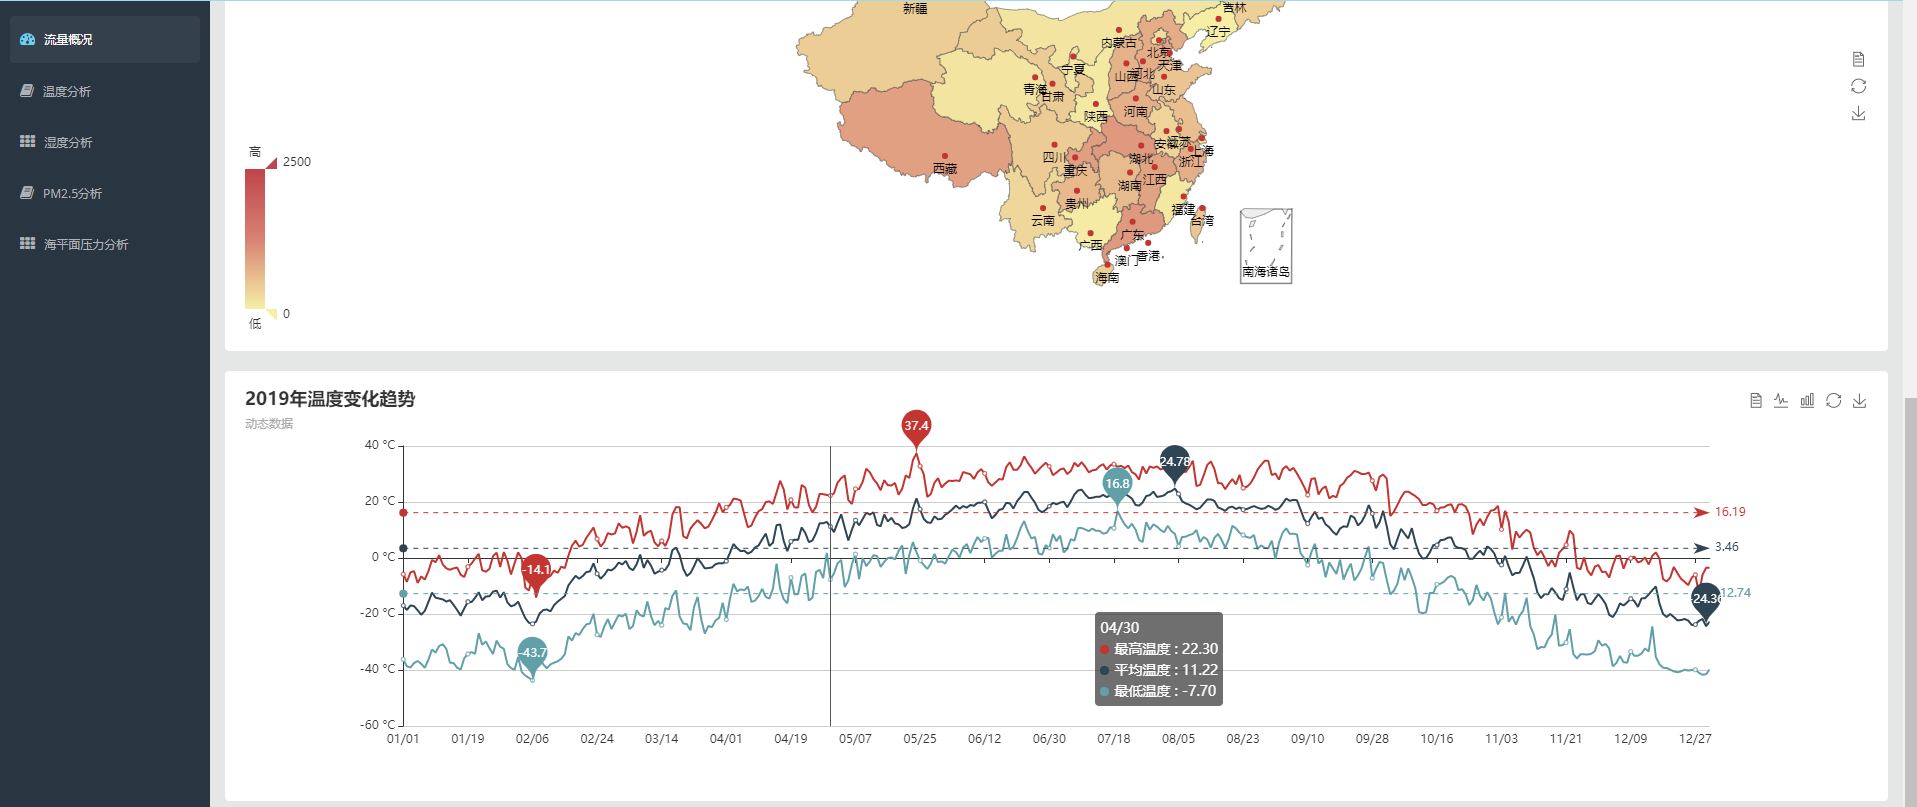
流程完成,撒花~~~
代码:
csdn资源下载从1积分涨到了50积分,可怕。
因此我又把放到了github
既有适合小白学习的零基础资料,也有适合3年以上经验的小伙伴深入学习提升的进阶课程,涵盖了95%以上大数据知识点,真正体系化!
由于文件比较多,这里只是将部分目录截图出来,全套包含大厂面经、学习笔记、源码讲义、实战项目、大纲路线、讲解视频,并且后续会持续更新
2月15日更新:很多同学在问数据在哪在哪,其实在1.1节已经说过了,现在说详细点儿。
[外链图片转存中…(img-2gctpnhn-1715728387085)]
[外链图片转存中…(img-venvhkds-1715728387086)]
[外链图片转存中…(img-abm0uixr-1715728387086)]
既有适合小白学习的零基础资料,也有适合3年以上经验的小伙伴深入学习提升的进阶课程,涵盖了95%以上大数据知识点,真正体系化!
由于文件比较多,这里只是将部分目录截图出来,全套包含大厂面经、学习笔记、源码讲义、实战项目、大纲路线、讲解视频,并且后续会持续更新


发表评论