需要源程序的可以关注评论我 我会给大家邮箱的形式发送~
目录
摘要
针对车辆检测,本文提出了一种基于yolov4车辆检测算法。制作了一个多天侯、多时段、多场景的车辆目标数据集,对车辆数据集进行手工标注,将其划分为训练集和测试集以便模型使用,经过darknet53网络框架进行训练,发现实验结果良好,可满足实际应用的需求。
研究背景
随着经济的发展,交通拥堵问题凸显,严重影响人民生活水平的提高,构建智能化的交通监测系统对减少交通拥堵、 提高交通运输效率具有重要意义。对车辆目标进行准确、实时的检测是智能交通系统的核心,在现有车辆检测算法研究中,基于深度学习的检测算法成功引起了学者们的关注,特别是针对复杂场景中多个车辆的检测更具挑战性。
算法设计及实现过程
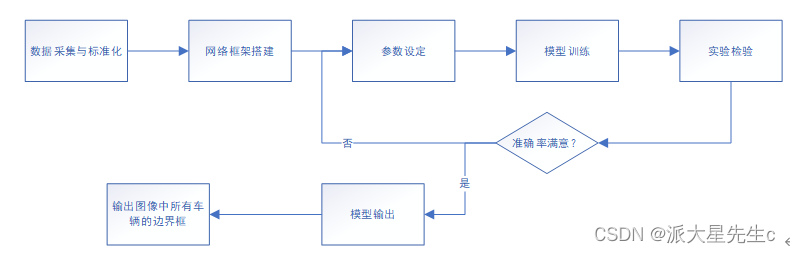
图1 算法设计框图
深度学习技术主要是对输入的图像进行卷积处理,对特征进行提取并确定目标位置,其在目标识别领取有很好的成效。基于深度学习的目标识别算法主要代表算法有r-cnn、ssd、yolo等,本文采用的是yolov4算法,该算法是one-stage检测中是典型代表,实时性表现良好,且检测速度较快,综合以上优点,我们最终选用它。
车辆目标数据集的构建
我们考虑到道路上的车辆以及所处的环境均比较复杂,会影响车辆检测的正确率,所以
我们认为构建一个合适的实时监测数据集是非常重要的。在网上收集到coco的车辆数据集,并从中找到车辆数据集,储存之后进行图像组合和边界框的创建,框标签数据一同储存。
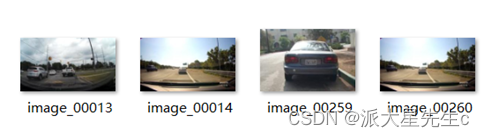
图2 车辆数据集
基于yolov4的目标检测
yolov4算法是在yolo系列先前版本的目标检测算法的基础上面优化而来且在目标识别领域中比较热门,主要采用的是cspdarknet53作为主干特征提取网络,其中共有五个大残差块,每个大残差块中所包含的小残差单元个数为1、2、8、8、4,而spp网络用在yolov4中的目的是增强网络的感受野,panet是在上采样过程之后又加入了下采样的操作,yolov3作为head,最终实现整个yolov4算法。
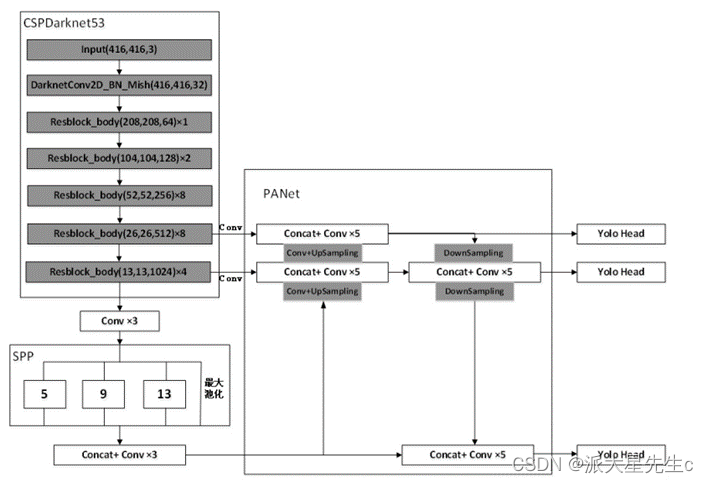
图3 yolov4 网络结构图
设置训练超参数如下,numepochs = 90;minibatchsize = 4;learningrate = 0.001;warmupperiod = 1000;l2regularization = 0.001;penaltythreshold = 0.5;
采用随机梯度下降法(stochastic gradient descent, sgd)。训练过程是在 yolov4 权重下进行微调,对其迭代100次完成训练过程。
之后运行测试集中的图像运行检测器,并收集结果,使用平均精度度量评估对象检测器,得到测试集训练后的平均精准度为86%,并保存训练模型和训练后的参数。
最后创建一个检测文件,下载预先下载好的网络,获取coco数据集的类名和用于训练和预训练模型的anchors,然后进行检测和可视化,结果如下。
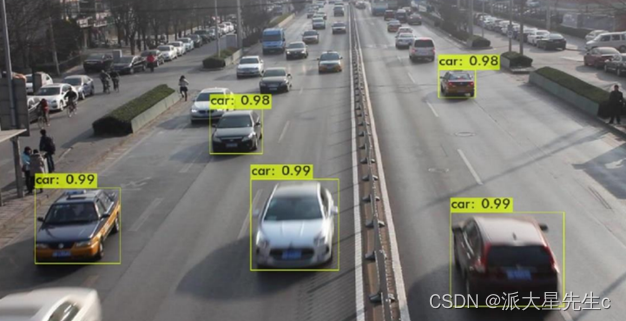
图4 检测结果1
在我们得到结果之后,我们发现在检测过程中检测的速度较慢,在运行程序后30s左右才会出现检测结果,且后面的小型车辆在检测过程中并不能被框选并识别,不能够识别车辆视频流。我们针对发现的问题把模型进行改进。
对yolov4模型进行改进
我们通过第一轮的训练之后,发现在小目标识别的准确率和检测的速度这两个地方,我们的模型会有一些缺陷。所以我们对yolov4模型进行优化改进。
首先是在检测速度这方面,我们想要使yolov4模型轻量化来解决。cspdarknet53是yolov4主干特征提取网络,轻量化该结构中两个卷积层的计算结果直接进行通道融合,再共用一bn层和激活函数,这样可以减少网络的计算量,避免这两个卷积模块都单独的计算激活值和批量归一化。使模型轻量化的同时,不会影响最终的实验结果。
在小目标识别的过程中,我们考虑到可能是在数据集中更多的是单个车辆或者单个环境下导致的,所以我们采用数据增强的方法来进行数据扩充,数据增强是指在图片送入网络前的预处理阶段,通过对输入图片进行一些微小的改变操作如随机擦除、调整饱和度等,使得神经网络认为这是一张全新的图片达到增加数据量的效果。这样做不仅可以增大目标检测的数据量,还能够丰富数据集中检测目标的背景,减少背景被误判为检测目标的概率。
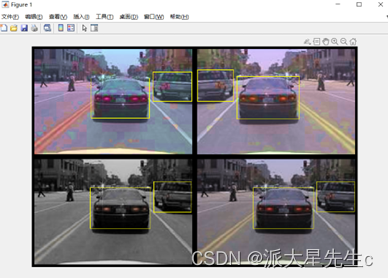
图5 数据增强过程图
实验结果及分析
经过我们的改进,我们在运行程序之后得到测试集的准确率为91%,20s左右即可得到检测结果,并且小型车辆也可以进行较好的识别检测,并且我们将视频按照每帧分开,同样也实现了视频流的识别。通过对模型进行训练并验证发现,改进的模型在精准度和检测速度方面比原模型都要好。
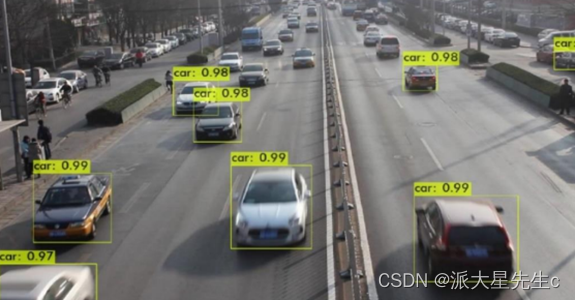
图6 检测结果2
结论与展望
我们完成了对交通视频图片的车辆的识别,对车辆识别原理进行了分析,对车辆检测算法进行了改进,改良后的 yolov4 模型 的性能得到了大幅提升,车辆检测准确性较高。通过试验测试发现可以满足实时检测的要求,但是该车辆检测模型还有改进优化的空间。还可以对以下几个方面进行优化:
用于车辆识别的图片大多为白天拍摄的,对白天车辆统计效果较好, 后续研究方向会将下雪天、雨天、夜晚等环境进行比较分析。
我们在识别过程中发现,很多小型车辆仍有检测不到的情况,需要对模型继续进行优化,训练精度更好的模型才能避免这种情况的发生。
代码实现
clc;
clear;
close all;
warning off;
addpath(genpath(pwd));

%% 下载预训练网络
% 设置上述模型名称以下载该预训练模型。
modelname = 'yolov4-coco';
model = helper.downloadpretrainedyolov4(modelname);
net = model.net;

%% 加载数据
%解压缩车辆图像并加载车辆地面实况数据。
unzip vehicledatasetimages.zip
data = load('vehicledatasetgroundtruth.mat');
vehicledataset = data.vehicledataset;

% 将完整路径添加到本地车辆数据文件夹。
vehicledataset.imagefilename = fullfile(pwd, vehicledataset.imagefilename);


rng('default')
shuffledindices = randperm(height(vehicledataset));
idx = floor(0.6 * length(shuffledindices));
trainingdatatbl = vehicledataset(shuffledindices(1:idx), :);
testdatatbl = vehicledataset(shuffledindices(idx+1:end), :);

% 创建用于加载图像的图像数据存储.
imdstrain = imagedatastore(trainingdatatbl.imagefilename);
imdstest = imagedatastore(testdatatbl.imagefilename);

% 为地面真相边界框创建数据存储。
bldstrain = boxlabeldatastore(trainingdatatbl(:, 2:end));
bldstest = boxlabeldatastore(testdatatbl(:, 2:end));

% 组合图像和框标签数据存储。
trainingdata = combine(imdstrain, bldstrain);
testdata = combine(imdstest, bldstest);

helper.validateinputdata(trainingdata);
helper.validateinputdata(testdata);

%% 数据扩充
augmentedtrainingdata = transform(trainingdata, @helper.augmentdata);

% 增强后的图片
augmenteddata = cell(4,1);
for k = 1:4
    data = read(augmentedtrainingdata);
    augmenteddata{k} = insertshape(data{1,1}, 'rectangle', data{1,2});
    reset(augmentedtrainingdata);
end
figure
montage(augmenteddata, 'bordersize', 10)

%% 预处理训练数据
% 指定网络输入大小。
networkinputsize = net.layers(1).inputsize;


preprocessedtrainingdata = transform(augmentedtrainingdata, @(data)helper.preprocessdata(data, networkinputsize));

% 读取预处理的训练数据。
data = read(preprocessedtrainingdata);

% 显示带有边界框的图像。
i = data{1,1};
bbox = data{1,2};
annotatedimage = insertshape(i, 'rectangle', bbox);
annotatedimage = imresize(annotatedimage,2);
figure
imshow(annotatedimage)

% 重置数据存储。
reset(preprocessedtrainingdata);

%% 修改预训练yolo v4网络

rng(0)
trainingdataforestimation = transform(trainingdata, @(data)helper.preprocessdata(data, networkinputsize));
numanchors = 9;
[anchorboxes, meaniou] = estimateanchorboxes(trainingdataforestimation, numanchors);

% 指定培训中要使用的classname。
classnames = {'vehicle'};


[lgraph, networkoutputs, anchorboxes, anchorboxmasks] = configureyolov4(net, classnames, anchorboxes, modelname);

%% 指定超参数
numepochs = 200;
minibatchsize = 4;
learningrate = 0.01;
warmupperiod = 1000;
l2regularization = 0.001;
penaltythreshold = 0.5;
velocity = [];

%% 训练模型
if canuseparallelpool
   dispatchinbackground = true;
else
   dispatchinbackground = false;
end

mbqtrain = minibatchqueue(preprocessedtrainingdata, 2,...
        "minibatchsize", minibatchsize,...
        "minibatchfcn", @(images, boxes, labels) helper.createbatchdata(images, boxes, labels, classnames), ...
        "minibatchformat", ["sscb", ""],...
        "dispatchinbackground", dispatchinbackground,...
        "outputcast", ["", "double"]);


% 将层图转换为dlnetwork。
net = dlnetwork(lgraph);

% 学习率和batch_size子图。
fig = figure;
[lossplotter, learningrateplotter] = helper.configuretrainingprogressplotter(fig);

iteration = 0;
% 自定义训练循环。
for epoch = 1:numepochs

    reset(mbqtrain);
    shuffle(mbqtrain);

    while(hasdata(mbqtrain))
        iteration = iteration + 1;

        [xtrain, ytrain] = next(mbqtrain);

        % 使用dlfeval和modelgradients函数评估模型梯度和损失。
        [gradients, state, lossinfo] = dlfeval(@modelgradients, net, xtrain, ytrain, anchorboxes, anchorboxmasks, penaltythreshold, networkoutputs);

        % 应用l2正则化。
        gradients = dlupdate(@(g,w) g + l2regularization*w, gradients, net.learnables);

        % 确定当前学习率
        currentlr = helper.piecewiselearningratewithwarmup(iteration, epoch, learningrate, warmupperiod, numepochs);

        % 使用sgdm优化器更新网络可学习参数。
        [net, velocity] = sgdmupdate(net, gradients, velocity, currentlr);

        % 更新dlnetwork的状态参数。
        net.state = state;

        % 显示进度。
        if mod(iteration,10)==1
            helper.displaylossinfo(epoch, iteration, currentlr, lossinfo);
        end

        % 更新训练图。
        helper.updateplots(lossplotter, learningrateplotter, iteration, currentlr, lossinfo.totalloss);
    end
end

% 保存训练模型。
anchors.anchorboxes = anchorboxes;
anchors.anchorboxmasks = anchorboxmasks;

save('yolov4_trained', 'net', 'anchors');

%% 评估模型
confidencethreshold = 0.5;
overlapthreshold = 0.5;

%创建一个表以保存返回的边界框、分数和标签检测器。
numimages = size(testdatatbl, 1);
results = table('size', [0 3], ...
    'variabletypes', {'cell','cell','cell'}, ...
    'variablenames', {'boxes','scores','labels'});

% 对测试集中的图像运行检测器并收集结果。
reset(testdata)
while hasdata(testdata)
    % 读取数据存储并获取图像。
    data = read(testdata);
    image = data{1};

    % 运行预测器
    executionenvironment = 'auto';
    [bboxes, scores, labels] = detectyolov4(net, image, anchors, classnames, executionenvironment);

    % 收集结果。
    tbl = table({bboxes}, {scores}, {labels}, 'variablenames', {'boxes','scores','labels'});
    results = [results; tbl];
end

% 使用平均精度度量评估对象检测器。
[ap, recall, precision] = evaluatedetectionprecision(results, testdata);

%精确召回(pr)曲线显示了检测器在变化时的精度召回水平。理想情况下,所有召回级别的精度均为1。

% 绘制精度召回曲线。
figure
plot(recall, precision)
xlabel('recall')
ylabel('precision')
grid on
title(sprintf('average precision = %.2f', ap))

%% 使用经过训练的yolo v4检测对象
reset(testdata)
data = read(testdata);

% 选取图片
i = data{1};

% 运行预测
executionenvironment = 'auto';
[bboxes, scores, labels] = detectyolov4(net, i, anchors, classnames, executionenvironment);

% 预测图片
if ~isempty(scores)
    i = insertobjectannotation(i, 'rectangle', bboxes, scores);
end
figure
imshow(i)
发表评论