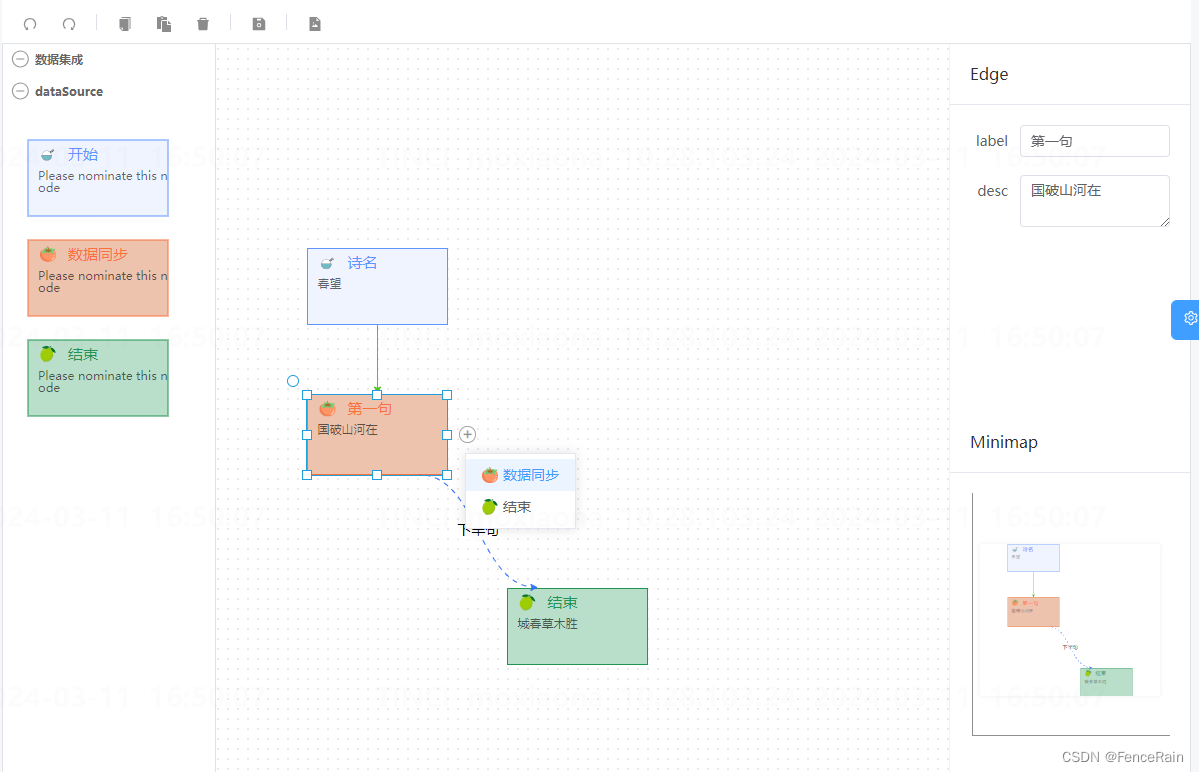
新建流程图
// adddag.vue
<template>
<div class="content-main">
<div class="tool-container">
<div @click="undo" class="command" title="后退">
<icon icon="ant-design:undo-outlined" />
</div>
<div @click="redo" class="command" title="前进">
<icon icon="ant-design:redo-outlined" />
</div>
<el-divider direction="vertical" />
<div @click="copy" class="command" title="复制">
<icon icon="ant-design:copy-filled" />
</div>
<div @click="paste" class="command" title="粘贴">
<icon icon="fa-solid:paste" />
</div>
<div @click="del" class="command" title="删除">
<icon icon="ant-design:delete-filled" />
</div>
<el-divider direction="vertical" />
<div @click="save" class="command" title="保存">
<icon icon="ant-design:save-filled" />
</div>
<el-divider direction="vertical" />
<div @click="exportpng" class="command" title="导出png">
<icon icon="ant-design:file-image-filled" />
</div>
</div>
<div class="content-container" id="">
<div class="content">
<div class="stencil" ref="stencilcontainer"></div>
<div class="graph-content" id="graphcontainer" ref="graphcontainer"> </div>
<div class="editor-sidebar">
<div class="edit-panel">
<el-card shadow="never">
<template #header>
<div class="card-header">
<span>{{ cellfrom.title }}</span>
</div>
</template>
<el-form :model="nodefrom" label-width="50px" v-if="nodefrom.show">
<el-form-item label="label">
<el-input v-model="nodefrom.label" @blur="changelabel" />
</el-form-item>
<el-form-item label="desc">
<el-input type="textarea" v-model="nodefrom.desc" @blur="changedesc" />
</el-form-item>
</el-form>
<el-form :model="cellfrom" label-width="50px" v-if="cellfrom.show">
<el-form-item label="label">
<el-input v-model="cellfrom.label" @blur="changeedgelabel" />
</el-form-item>
<!-- <el-form-item label="连线方式">
<el-select v-model="cellfrom.edgetype" class="m-2" placeholder="select" @change="changeedgetype">
<el-option
v-for="item in edge_type_list"
:key="item.type"
:label="item.name"
:value="item.type"
/>
</el-select>
</el-form-item> -->
</el-form>
</el-card>
</div>
<div>
<el-card shadow="never">
<template #header>
<div class="card-header">
<span>minimap</span>
</div>
</template>
<div class="minimap" ref="minimapcontainer"></div>
</el-card>
</div>
</div>
</div>
</div>
<div v-if="showmenu" class="node-menu" ref="nodemenu">
<div
class="menu-item"
v-for="(item, index) in processing_type_list"
:key="index"
@click="addnodetool(item)"
>
<el-image :src="item.image" style="width: 16px; height: 16px" fit="fill" />
<span>{{ item.name }}</span>
</div>
</div>
</div>
</template>
<script setup lang="ts">
import { graph, path, edge, stringext, node, cell, model, datauri } from '@antv/x6'
import { transform } from '@antv/x6-plugin-transform'
import { selection } from '@antv/x6-plugin-selection'
import { snapline } from '@antv/x6-plugin-snapline'
import { keyboard } from '@antv/x6-plugin-keyboard'
import { clipboard } from '@antv/x6-plugin-clipboard'
import { history } from '@antv/x6-plugin-history'
import { minimap } from '@antv/x6-plugin-minimap'
//import { scroller } from '@antv/x6-plugin-scroller'
import { stencil } from '@antv/x6-plugin-stencil'
import { export } from '@antv/x6-plugin-export'
import { ref, onmounted, reactive, torefs, nexttick, onunmounted } from 'vue'
import '@/styles/animation.less'
import { elmessage, elcard, elform, elformitem, elinput, elimage, eldivider } from 'element-plus'
const stencilcontainer = ref()
const graphcontainer = ref()
const minimapcontainer = ref()
let graph: any = null
const state = reactive({
cellfrom: {
title: 'canvas',
label: '',
desc: '',
show: false,
id: '',
edgetype: 'topbottom'
},
nodefrom: {
title: 'canvas',
label: '',
desc: '',
show: false,
id: ''
},
showmenu: false,
data: {
nodes: [
{
id: 'ac51fb2f-2753-4852-8239-53672a29bb14',
position: {
x: -340,
y: -160
},
data: {
name: '诗名',
type: 'output',
desc: '春望'
}
},
{
id: '81004c2f-0413-4cc6-8622-127004b3befa',
position: {
x: -340,
y: -10
},
data: {
name: '第一句',
type: 'sync',
desc: '国破山河在'
}
},
{
id: '7505da25-1308-4d7a-98fd-e6d5c917d35d',
position: {
x: -140,
y: 180
},
data: {
name: '结束',
type: 'input',
desc: '城春草木胜'
}
}
],
edges: [
{
id: '6eea5dc9-4e15-4e78-959f-ee13ec59d11c',
shape: 'processing-curve',
source: { cell: 'ac51fb2f-2753-4852-8239-53672a29bb14', port: '-out' },
target: { cell: '81004c2f-0413-4cc6-8622-127004b3befa', port: '-in' },
zindex: -1,
data: {
source: 'ac51fb2f-2753-4852-8239-53672a29bb14',
target: '81004c2f-0413-4cc6-8622-127004b3befa'
}
},
{
id: '8cbce713-54be-4c07-8efa-59c505f74ad7',
labels: ['下半句'],
shape: 'processing-curve',
source: { cell: '81004c2f-0413-4cc6-8622-127004b3befa', port: '-out' },
target: { cell: '7505da25-1308-4d7a-98fd-e6d5c917d35d', port: '-in' },
data: {
source: '81004c2f-0413-4cc6-8622-127004b3befa',
target: '7505da25-1308-4d7a-98fd-e6d5c917d35d'
}
}
]
},
// 节点状态列表
nodestatuslist: [
{
id: 'ac51fb2f-2753-4852-8239-53672a29bb14',
status: 'success'
},
{
id: '81004c2f-0413-4cc6-8622-127004b3befa',
status: 'success'
}
],
// 边状态列表
edgestatuslist: [
{
id: '6eea5dc9-4e15-4e78-959f-ee13ec59d11c',
status: 'success'
},
{
id: '8cbce713-54be-4c07-8efa-59c505f74ad7',
status: 'executing'
}
],
// 加工类型列表
processing_type_list: [
{
type: 'sync',
name: '数据同步',
image: new url('@/assets/imgs/persimmon.png', import.meta.url).href
},
{
type: 'input',
name: '结束',
image: new url('@/assets/imgs/lime.png', import.meta.url).href
}
],
//边类型
edge_type_list: [
{
type: 'topbottom',
name: '上下'
},
{
type: 'leftright',
name: '左右'
}
]
})
const { cellfrom, nodefrom, showmenu, processing_type_list } = torefs(state)
let nodemenu = ref()
// 节点类型
enum nodetype {
input = 'input', // 数据输入
filter = 'filter', // 数据过滤
join = 'join', // 数据连接
union = 'union', // 数据合并
agg = 'agg', // 数据聚合
output = 'output', // 数据输出
sync = 'sync' //数据同步
}
// 元素校验状态
// enum cellstatus {
// default = 'default',
// success = 'success',
// error = 'error'
// }
// 节点位置信息
interface position {
x: number
y: number
}
function init() {
graph = new graph({
container: graphcontainer.value,
grid: true,
panning: {
enabled: true,
eventtypes: ['leftmousedown', 'mousewheel']
},
mousewheel: {
enabled: true,
modifiers: 'ctrl',
factor: 1.1,
maxscale: 1.5,
minscale: 0.5
},
highlighting: {
magnetadsorbed: {
name: 'stroke',
args: {
attrs: {
fill: '#fff',
stroke: '#31d0c6',
strokewidth: 4
}
}
}
},
connecting: {
snap: true,
allowblank: false,
allowloop: false,
highlight: true,
// sourceanchor: {
// name: 'bottom',
// args: {
// dx: 0,
// },
// },
// targetanchor: {
// name: 'top',
// args: {
// dx: 0,
// },
// },
createedge() {
return graph.createedge({
shape: 'processing-curve',
attrs: {
line: {
strokedasharray: '5 5'
}
},
zindex: -1
})
},
// 连接桩校验
validateconnection({ sourcemagnet, targetmagnet }) {
// 只能从输出链接桩创建连接
if (!sourcemagnet || sourcemagnet.getattribute('port-group') === 'in') {
return false
}
// 只能连接到输入链接桩
if (!targetmagnet || targetmagnet.getattribute('port-group') === 'out') {
return false
}
return true
}
}
})
graph.centercontent()
// #region 使用插件
graph
.use(
new transform({
resizing: true,
rotating: true
})
)
.use(
new selection({
rubberband: true,
shownodeselectionbox: true
})
)
.use(
new minimap({
container: minimapcontainer.value,
width: 200,
height: 260,
padding: 10
})
)
.use(new snapline())
.use(new keyboard())
.use(new clipboard())
.use(new history())
.use(new export())
//.use(new scroller({
// enabled: true,
// pagevisible: true,
// pagebreak: false,
// pannable: true,
// }))
// #endregion
// #region 初始化图形
const ports = {
groups: {
in: {
position: 'top',
attrs: {
circle: {
r: 4,
magnet: true,
stroke: '#5f95ff',
strokewidth: 1,
fill: '#fff',
style: {
visibility: 'hidden'
}
}
}
},
out: {
position: 'bottom',
attrs: {
circle: {
r: 4,
magnet: true,
stroke: '#31d0c6',
strokewidth: 1,
fill: '#fff',
style: {
visibility: 'hidden'
}
}
}
},
left: {
position: 'left',
attrs: {
circle: {
r: 4,
magnet: true,
stroke: '#5f95ff',
strokewidth: 1,
fill: '#fff',
style: {
visibility: 'hidden'
}
}
}
},
right: {
position: 'right',
attrs: {
circle: {
r: 4,
magnet: true,
stroke: '#5f95ff',
strokewidth: 1,
fill: '#fff',
style: {
visibility: 'hidden'
}
}
}
}
}
// items: [
// {
// id: state.currentcode + '-in',
// group: 'top',
// },
// {
// id: state.currentcode + '-out',
// group: 'out',
// }
// ],
}
graph.registernode(
'custom-node',
{
inherit: 'rect',
width: 140,
height: 76,
attrs: {
body: {
strokewidth: 1
},
image: {
width: 16,
height: 16,
x: 12,
y: 6
},
text: {
refx: 40,
refy: 15,
fontsize: 15,
'text-anchor': 'start'
},
label: {
text: 'please nominate this node',
refx: 10,
refy: 30,
fontsize: 12,
fill: 'rgba(0,0,0,0.6)',
'text-anchor': 'start',
textwrap: {
width: -10, // 宽度减少 10px
height: '70%', // 高度为参照元素高度的一半
ellipsis: true, // 文本超出显示范围时,自动添加省略号
breakword: true // 是否截断单词
}
}
},
markup: [
{
tagname: 'rect',
selector: 'body'
},
{
tagname: 'image',
selector: 'image'
},
{
tagname: 'text',
selector: 'text'
},
{
tagname: 'text',
selector: 'label'
}
],
data: {},
relation: {},
ports: { ...ports }
},
true
)
const stencil = new stencil({
//新建节点库
title: '数据集成',
target: graph,
search: false, // 搜索
collapsable: true,
stencilgraphwidth: 300, //容器宽度
stencilgraphheight: 600, //容器长度
groups: [
//分组
{
name: 'processlibrary',
title: 'datasource'
}
],
layoutoptions: {
dx: 30,
dy: 20,
columns: 1, //列数(行内节点数)
columnwidth: 130, //列宽
rowheight: 100 //行高
}
})
stencilcontainer.value.appendchild(stencil.container)
// 控制连接桩显示/隐藏
// eslint-disable-next-line no-undef
const showports = (ports: nodelistof<svgelement>, show: boolean) => {
for (let i = 0, len = ports.length; i < len; i += 1) {
ports[i].style.visibility = show ? 'visible' : 'hidden'
}
}
graph.on('node:mouseenter', () => {
const container = graphcontainer.value
const ports = container.queryselectorall('.x6-port-body')
showports(ports, true)
})
graph.on('node:mouseleave', () => {
const container = graphcontainer.value
const ports = container.queryselectorall(
'.x6-port-body'
// eslint-disable-next-line no-undef
) as nodelistof<svgelement>
showports(ports, false)
})
// #region 快捷键与事件
graph.bindkey(['meta+c', 'ctrl+c'], () => {
// const cells = graph.getselectedcells()
// if (cells.length) {
// graph.copy(cells)
// }
// return false
copy()
})
graph.bindkey(['meta+x', 'ctrl+x'], () => {
const cells = graph.getselectedcells()
if (cells.length) {
graph.cut(cells)
}
return false
})
graph.bindkey(['meta+v', 'ctrl+v'], () => {
// if (!graph.isclipboardempty()) {
// const cells = graph.paste({ offset: 32 })
// graph.cleanselection()
// graph.select(cells)
// }
// return false
paste()
})
// undo redo
graph.bindkey(['meta+z', 'ctrl+z'], () => {
// if (graph.canundo()) {
// graph.undo()
// }
// return false
undo()
})
graph.bindkey(['meta+y', 'ctrl+y'], () => {
// if (graph.canredo()) {
// graph.redo()
// }
// return false
redo()
})
// select all
graph.bindkey(['meta+a', 'ctrl+a'], () => {
const nodes = graph.getnodes()
if (nodes) {
graph.select(nodes)
}
})
// delete
graph.bindkey('backspace', () => {
// const cells = graph.getselectedcells()
// if (cells.length) {
// graph.removecells(cells)
// }
del()
})
// zoom
graph.bindkey(['ctrl+1', 'meta+1'], () => {
const zoom = graph.zoom()
if (zoom < 1.5) {
graph.zoom(0.1)
}
})
graph.bindkey(['ctrl+2', 'meta+2'], () => {
const zoom = graph.zoom()
if (zoom > 0.5) {
graph.zoom(-0.1)
}
})
// 节点移入画布事件
graph.on('node:added', ({ node }: any) => {
// console.log(node,cell);
addnodeinfo(node)
})
// 节点单击事件
graph.on('node:click', ({ node }: any) => {
// console.log(node,cell)
addnodeinfo(node)
})
//节点被选中时显示添加节点按钮
graph.on('node:selected', (args: { cell: cell; node: node; options: model.setoptions }) => {
if (nodetype.input != args.node.data.type) {
args.node.removetools()
args.node.addtools({
name: 'button',
args: {
x: 0,
y: 0,
offset: { x: 160, y: 40 },
markup: [
//自定义的删除按钮样式
{
tagname: 'circle',
selector: 'button',
attrs: {
r: 8,
stroke: 'rgba(0,0,0,.25)',
strokewidth: 1,
fill: 'rgba(255, 255, 255, 1)',
cursor: 'pointer'
}
},
{
tagname: 'text',
textcontent: '+',
selector: 'icon',
attrs: {
fill: 'rgba(0,0,0,.25)',
fontsize: 15,
textanchor: 'middle',
pointerevents: 'none',
y: '0.3em',
stroke: 'rgba(0,0,0,.25)'
}
}
],
onclick({ e, view }: any) {
// console.log(e,cell);
shownodetool(e, view)
}
}
})
}
// code here
})
//节点被取消选中时触发。
graph.on('node:unselected', (args: { cell: cell; node: node; options: model.setoptions }) => {
args.node.removetools()
})
// 添加边事件
graph.on('edge:added', ({ edge }: any) => {
// console.log(edge);
addedgeinfo(edge)
edge.data = {
source: edge.source.cell,
target: edge.target.cell
}
})
// 线单击事件
graph.on('edge:click', ({ edge }: any) => {
// console.log(node,cell)
addedgeinfo(edge)
})
//边选中事件
graph.on('edge:selected', (args: { cell: cell; edge: edge; options: model.setoptions }) => {
args.edge.attr('line/strokewidth', 3)
})
//边被取消选中时触发。
graph.on('edge:unselected', (args: { cell: cell; edge: edge; options: model.setoptions }) => {
args.edge.attr('line/strokewidth', 1)
})
const nodeshapes = [
{
label: '开始',
nodetype: 'output' as nodetype
},
{
label: '数据同步',
nodetype: 'sync' as nodetype
},
{
label: '结束',
nodetype: 'input' as nodetype
}
]
const nodes = nodeshapes.map((item) => {
const id = stringext.uuid()
const node = {
id: id,
shape: 'custom-node',
// label: item.label,
ports: getportsbytype(item.nodetype, id),
data: {
name: `${item.label}`,
type: item.nodetype
},
attrs: getnodeattrs(item.nodetype)
}
const newnode = graph.addnode(node)
return newnode
})
//#endregion
stencil.load(nodes, 'processlibrary')
}
// 根据节点的类型获取ports
const getportsbytype = (type: nodetype, nodeid: string) => {
let ports = [] as any
switch (type) {
case nodetype.input:
ports = [
{
id: `${nodeid}-in`,
group: 'in'
},
{
id: `${nodeid}-left`,
group: 'left'
},
{
id: `${nodeid}-right`,
group: 'right'
}
]
break
case nodetype.output:
ports = [
{
id: `${nodeid}-out`,
group: 'out'
},
{
id: `${nodeid}-left`,
group: 'left'
},
{
id: `${nodeid}-right`,
group: 'right'
}
]
break
default:
ports = [
{
id: `${nodeid}-in`,
group: 'in'
},
{
id: `${nodeid}-out`,
group: 'out'
},
{
id: `${nodeid}-left`,
group: 'left'
},
{
id: `${nodeid}-right`,
group: 'right'
}
]
break
}
return ports
}
// 注册连线 --上下
graph.registerconnector(
'curveconnectortb',
(s, e) => {
const offset = 4
const deltay = math.abs(e.y - s.y)
const control = math.floor((deltay / 3) * 2)
const v1 = { x: s.x, y: s.y + offset + control }
const v2 = { x: e.x, y: e.y - offset - control }
return path.normalize(
`m ${s.x} ${s.y}
l ${s.x} ${s.y + offset}
c ${v1.x} ${v1.y} ${v2.x} ${v2.y} ${e.x} ${e.y - offset}
l ${e.x} ${e.y}
`
)
},
true
)
// 注册连线--左右
graph.registerconnector(
'curveconnectorlr',
(sourcepoint, targetpoint) => {
const hgap = math.abs(targetpoint.x - sourcepoint.x)
const path = new path()
path.appendsegment(path.createsegment('m', sourcepoint.x - 4, sourcepoint.y))
path.appendsegment(path.createsegment('l', sourcepoint.x + 12, sourcepoint.y))
// 水平三阶贝塞尔曲线
path.appendsegment(
path.createsegment(
'c',
sourcepoint.x < targetpoint.x ? sourcepoint.x + hgap / 2 : sourcepoint.x - hgap / 2,
sourcepoint.y,
sourcepoint.x < targetpoint.x ? targetpoint.x - hgap / 2 : targetpoint.x + hgap / 2,
targetpoint.y,
targetpoint.x - 6,
targetpoint.y
)
)
path.appendsegment(path.createsegment('l', targetpoint.x + 2, targetpoint.y))
return path.serialize()
},
true
)
graph.registeredge(
'processing-curve',
{
inherit: 'edge',
markup: [
{
tagname: 'path',
selector: 'wrap',
attrs: {
fill: 'none',
cursor: 'pointer',
stroke: 'transparent',
strokelinecap: 'round'
}
},
{
tagname: 'path',
selector: 'line',
attrs: {
fill: 'none',
pointerevents: 'none'
}
}
],
connector: { name: 'smooth' }, //curveconnectortb
attrs: {
wrap: {
connection: true,
strokewidth: 10,
strokelinejoin: 'round'
},
line: {
connection: true,
stroke: '#a2b1c3',
strokewidth: 1,
targetmarker: {
name: 'classic',
size: 6
}
}
}
},
true
)
// graph.registeredge(
// 'processing-curve-lr',
// {
// inherit: 'edge',
// markup: [
// {
// tagname: 'path',
// selector: 'wrap',
// attrs: {
// fill: 'none',
// cursor: 'pointer',
// stroke: 'transparent',
// strokelinecap: 'round',
// },
// },
// {
// tagname: 'path',
// selector: 'line',
// attrs: {
// fill: 'none',
// pointerevents: 'none',
// },
// },
// ],
// connector: { name: 'curveconnectorlr' },
// attrs: {
// wrap: {
// connection: true,
// strokewidth: 10,
// strokelinejoin: 'round',
// },
// line: {
// connection: true,
// stroke: '#a2b1c3',
// strokewidth: 1,
// targetmarker: {
// name: 'classic',
// size: 6,
// },
// },
// },
// },
// true,
// )
//保存
function save() {
console.log('save')
const graphdata = graph.tojson()
console.log(graphdata)
}
//撤销
function undo() {
if (graph.canundo()) {
graph.undo()
}
return false
}
//取消撤销
function redo() {
if (graph.canredo()) {
graph.redo()
}
return false
}
//复制
function copy() {
const cells = graph.getselectedcells()
if (cells.length) {
graph.copy(cells)
}
return false
}
//粘贴
function paste() {
if (!graph.isclipboardempty()) {
const cells = graph.paste({ offset: 32 })
graph.cleanselection()
graph.select(cells)
}
return false
}
//删除
function del() {
const cells = graph.getselectedcells()
if (cells.length) {
graph.removecells(cells)
}
}
//导出png
function exportpng() {
graph.topng(
(datauri: string) => {
// 下载
datauri.downloaddatauri(datauri, 'chart.png')
},
{
padding: {
top: 20,
right: 20,
bottom: 20,
left: 20
}
}
)
//graph.exportpng('a.png',{padding:'20px'});
}
function addnodeinfo(node: any) {
state.nodefrom.title = 'node'
state.nodefrom.label = node.label
state.nodefrom.desc = node.attrs.label.text
state.nodefrom.show = true
state.nodefrom.id = node.id
state.cellfrom.show = false
}
function addedgeinfo(edge: any) {
state.nodefrom.show = false
state.cellfrom.title = 'edge'
if (edge.labels[0]) {
state.cellfrom.label = edge.labels[0].attrs.label.text
} else {
state.cellfrom.label = ''
}
state.cellfrom.edgetype = edge.data ? edge.data.edgetype : ''
state.cellfrom.show = true
state.cellfrom.id = edge.id
}
//修改文本
function changelabel() {
const nodes = graph.getnodes()
nodes.foreach((node: any) => {
if (state.nodefrom.id == node.id) {
node.label = state.nodefrom.label
}
})
}
//修改描述
function changedesc() {
const nodes = graph.getnodes()
nodes.foreach((node: any) => {
if (state.nodefrom.id == node.id) {
node.attr('label/text', state.nodefrom.desc)
}
})
}
//修改边文本
function changeedgelabel() {
const edges = graph.getedges()
edges.foreach((edge: any) => {
if (state.cellfrom.id == edge.id) {
edge.setlabels(state.cellfrom.label)
console.log(edge)
}
})
}
//修改边的类型
// function changeedgetype() {
// const edges = graph.getedges()
// edges.foreach((edge: any) => {
// if (state.cellfrom.id == edge.id) {
// // console.log(state.cellfrom.edgetype);
// if (state.cellfrom.edgetype == 'topbottom') {
// edge.setconnector('curveconnectortb')
// } else {
// edge.setconnector('curveconnectorlr')
// // console.log(edge);
// }
// edge.data.edgetype = state.cellfrom.edgetype
// }
// })
// }
const getnodeattrs = (nodetype: string) => {
let attr = {} as any
switch (nodetype) {
case nodetype.input:
attr = {
image: {
'xlink:href': new url('@/assets/imgs/lime.png', import.meta.url).href
},
//左侧拖拽样式
body: {
fill: '#b9dec9',
stroke: '#229453'
},
text: {
text: '结束',
fill: '#229453'
}
}
break
case nodetype.sync:
attr = {
image: {
'xlink:href': new url('@/assets/imgs/persimmon.png', import.meta.url).href
},
//左侧拖拽样式
body: {
fill: '#edc3ae',
stroke: '#f9723d'
},
text: {
text: '数据同步',
fill: '#f9723d'
}
}
break
case nodetype.output:
attr = {
image: {
'xlink:href': new url('@/assets/imgs/rice.png', import.meta.url).href
},
//左侧拖拽样式
body: {
fill: '#eff4ff',
stroke: '#5f95ff'
},
text: {
text: '开始',
fill: '#5f95ff'
}
}
break
}
return attr
}
//加载初始节点
function getdata() {
let cells = [] as any
const location = state.data
location.nodes.map((node) => {
let attr = getnodeattrs(node.data.type)
if (node.data.desc) {
attr.label = { text: node.data.desc }
}
if (node.data.name) {
let temp = attr.text
if (temp) {
temp.text = node.data.name
}
}
cells.push(
graph.addnode({
id: node.id,
x: node.position.x,
y: node.position.y,
shape: 'custom-node',
attrs: attr,
ports: getportsbytype(node.data.type as nodetype, node.id),
data: node.data
})
)
})
location.edges.map((edge) => {
cells.push(
graph.addedge({
id: edge.id,
source: edge.source,
target: edge.target,
zindex: edge.zindex,
shape: 'processing-curve',
// connector: { name: 'curveconnector' },
labels: edge.labels,
attrs: { line: { strokedasharray: '5 5' } },
data: edge.data
})
)
})
graph.resetcells(cells)
}
// 开启边的运行动画
const excuteanimate = (edge: any) => {
edge.attr({
line: {
stroke: '#3471f9'
}
})
edge.attr('line/strokedasharray', 5)
edge.attr('line/style/animation', 'running-line 30s infinite linear')
}
// 显示边状态
const showedgestatus = () => {
state.edgestatuslist.foreach((item) => {
const edge = graph.getcellbyid(item.id)
if (item.status == 'success') {
edge.attr('line/strokedasharray', 0)
edge.attr('line/stroke', '#52c41a')
} else if ('error' == item.status) {
edge.attr('line/stroke', '#ff4d4f')
} else if ('executing' == item.status) {
excuteanimate(edge)
}
})
}
// 显示添加按钮菜单
function shownodetool(e: any, _view: any) {
// console.log(view);
state.showmenu = true
nexttick(() => {
nodemenu.value.style.top = e.offsety + 60 + 'px'
nodemenu.value.style.left = e.offsetx + 210 + 'px'
})
}
// 点击添加节点按钮
function addnodetool(item: any) {
// console.log(item);
createdownstream(item.type)
state.showmenu = false
}
/**
* 根据起点初始下游节点的位置信息
* @param node 起始节点
* @param graph
* @returns
*/
const getdownstreamnodeposition = (node: node, graph: graph, dx = 250, dy = 100) => {
// 找出画布中以该起始节点为起点的相关边的终点id集合
const downstreamnodeidlist: string[] = []
graph.getedges().foreach((edge) => {
const originedge = edge.tojson()?.data
console.log(node)
if (originedge.source === node.id) {
downstreamnodeidlist.push(originedge.target)
}
})
// 获取起点的位置信息
const position = node.getposition()
let minx = infinity
let maxy = -infinity
graph.getnodes().foreach((graphnode) => {
if (downstreamnodeidlist.indexof(graphnode.id) > -1) {
const nodeposition = graphnode.getposition()
// 找到所有节点中最左侧的节点的x坐标
if (nodeposition.x < minx) {
minx = nodeposition.x
}
// 找到所有节点中最x下方的节点的y坐标
if (nodeposition.y > maxy) {
maxy = nodeposition.y
}
}
})
return {
x: minx !== infinity ? minx : position.x + dx,
y: maxy !== -infinity ? maxy + dy : position.y
}
}
// 创建下游的节点和边
const createdownstream = (type: nodetype) => {
// console.log(graph.getselectedcells());
const cells = graph.getselectedcells()
if (cells.length == 1) {
const node = cells[0]
//console.log(node,"node");
if (graph) {
// 获取下游节点的初始位置信息
const position = getdownstreamnodeposition(node, graph)
// 创建下游节点
const newnode = createnode(type, graph, position)
const source = node.id
const target = newnode.id
// 创建该节点出发到下游节点的边
createedge(source, target, graph)
}
} else {
elmessage({
message: '请选择一个节点',
type: 'warning'
})
}
}
const createnode = (type: nodetype, graph: graph, position?: position): node => {
let newnode = {} as node
const typename = state.processing_type_list?.find((item) => item.type === type)?.name
const id = stringext.uuid()
const node = {
id,
shape: 'custom-node',
x: position?.x,
y: position?.y,
ports: getportsbytype(type, id),
data: {
name: `${typename}`,
type
},
attrs: getnodeattrs(type)
}
newnode = graph.addnode(node)
return newnode
}
const createedge = (source: string, target: string, graph: graph) => {
const edge = {
id: stringext.uuid(),
shape: 'processing-curve',
source: {
cell: source
// port: `${source}-out`,
},
target: {
cell: target
// port: `${target}-in`,
},
zindex: -1,
data: {
source,
target
},
attrs: { line: { strokedasharray: '5 5' } }
}
// console.log(edge);
if (graph) {
graph.addedge(edge)
}
}
onmounted(() => {
init()
// graph.fromjson(state.data);
getdata()
showedgestatus()
})
onunmounted(() => {
graph.dispose()
})
</script>
<style lang="less" scoped>
.content-main {
display: flex;
width: 100%;
flex-direction: column;
height: calc(100vh - 85px - 40px);
background-color: #ffffff;
position: relative;
.tool-container {
padding: 8px;
display: flex;
align-items: center;
color: rgba(0, 0, 0, 0.45);
.command {
display: inline-block;
width: 27px;
height: 27px;
margin: 0 6px;
padding-top: 6px;
text-align: center;
cursor: pointer;
}
}
}
.content-container {
position: relative;
width: 100%;
height: 100%;
.content {
width: 100%;
height: 100%;
position: relative;
min-width: 400px;
min-height: 600px;
display: flex;
border: 1px solid #dfe3e8;
flex-direction: row;
// flex-wrap: wrap;
flex: 1 1;
.stencil {
width: 250px;
height: 100%;
border-right: 1px solid #dfe3e8;
position: relative;
:deep(.x6-widget-stencil) {
background-color: #fff;
}
:deep(.x6-widget-stencil-title) {
background-color: #fff;
}
:deep(.x6-widget-stencil-group-title) {
background-color: #fff !important;
}
}
.graph-content {
width: calc(100% - 180px);
height: 100%;
}
.editor-sidebar {
display: flex;
flex-direction: column;
border-left: 1px solid #e6f7ff;
background: #fafafa;
z-index: 9;
.el-card {
border: none;
}
.edit-panel {
flex: 1 1;
background-color: #fff;
}
:deep(.x6-widget-minimap-viewport) {
border: 1px solid #8f8f8f;
}
:deep(.x6-widget-minimap-viewport-zoom) {
border: 1px solid #8f8f8f;
}
}
}
}
:deep(.x6-widget-transform) {
margin: -1px 0 0 -1px;
padding: 0px;
border: 1px solid #239edd;
}
:deep(.x6-widget-transform > div) {
border: 1px solid #239edd;
}
:deep(.x6-widget-transform > div:hover) {
background-color: #3dafe4;
}
:deep(.x6-widget-transform-active-handle) {
background-color: #3dafe4;
}
:deep(.x6-widget-transform-resize) {
border-radius: 0;
}
:deep(.x6-widget-selection-inner) {
border: 1px solid #239edd;
}
:deep(.x6-widget-selection-box) {
opacity: 0;
}
.topic-image {
visibility: hidden;
cursor: pointer;
}
.x6-node:hover .topic-image {
visibility: visible;
}
.x6-node-selected rect {
stroke-width: 2px;
}
.node-menu {
position: absolute;
box-shadow: var(--el-box-shadow-light);
background: var(--el-bg-color-overlay);
border: 1px solid var(--el-border-color-light);
padding: 5px 0px;
.menu-item {
display: flex;
align-items: center;
white-space: nowrap;
list-style: none;
line-height: 22px;
padding: 5px 16px;
margin: 0;
font-size: var(--el-font-size-base);
color: var(--el-text-color-regular);
cursor: pointer;
outline: none;
box-sizing: border-box;
}
.menu-item .el-image {
margin-right: 5px;
}
.menu-item:hover {
background-color: var(--el-color-primary-light-9);
color: var(--el-color-primary);
}
}
</style>
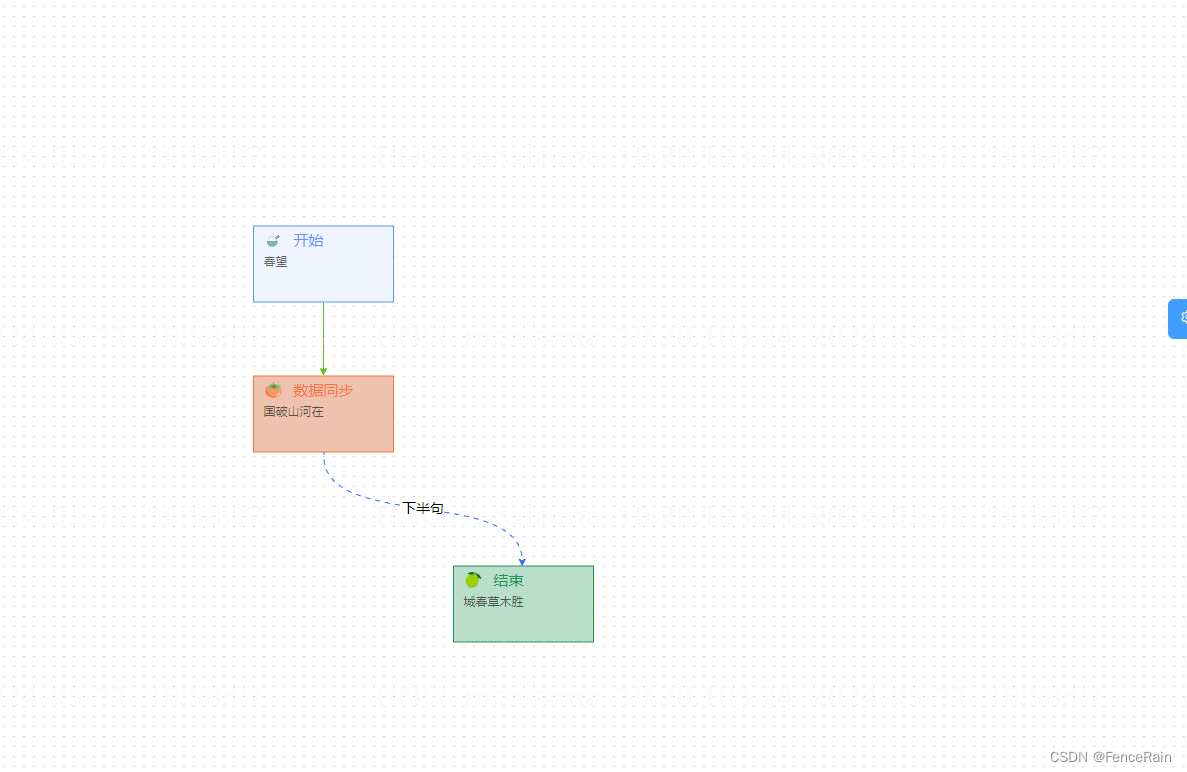
显示流程图
<template>
  <div class="content-main">
    <div class="content-container" id="">
      <div class="content">
        <div class="graph-content" id="graphcontainer" ref="graphcontainer"></div>
      </div>
    </div>
  </div>
</template>

<script setup lang="ts">
import { graph, path, edge } from '@antv/x6'
import { ref, onmounted, reactive } from 'vue'
import '@/styles/animation.less'

const graphcontainer = ref()

let graph: any = null

const state = reactive({
  data: {
    nodes: [
      {
        id: 'ac51fb2f-2753-4852-8239-53672a29bb14',
        x: -340,
        y: -160,
        ports: [
          {
            id: 'ac51fb2f-2753-4852-8239-53672a29bb14_out',
            group: 'out'
          }
        ],
        data: {
          name: '数据输入_1',
          type: 'output',
          checkstatus: 'sucess'
        },
        attrs: {
          body: {
            fill: '#eff4ff',
            stroke: '#5f95ff'
          },
          image: {
            'xlink:href': 'http://localhost:20002/src/assets/imgs/rice.png'
          },
          label: {
            text: '春望'
          },
          text: {
            fill: '#5f95ff',
            text: '开始'
          }
        }
      },
      {
        id: '81004c2f-0413-4cc6-8622-127004b3befa',
        x: -340,
        y: -10,
        ports: [
          {
            id: '81004c2f-0413-4cc6-8622-127004b3befa_in',
            group: 'in'
          },
          {
            id: '81004c2f-0413-4cc6-8622-127004b3befa_out',
            group: 'out'
          }
        ],
        data: {
          name: '数据输入_1',
          type: 'syan',
          checkstatus: 'sucess'
        },
        attrs: {
          body: {
            fill: '#edc3ae',
            stroke: '#f9723d'
          },
          image: {
            'xlink:href': 'http://localhost:20002/src/assets/imgs/persimmon.png'
          },
          label: {
            text: '国破山河在'
          },
          text: {
            fill: '#f9723d',
            text: '数据同步'
          }
        }
      },
      {
        id: '7505da25-1308-4d7a-98fd-e6d5c917d35d',
        x: -140,
        y: 180,
        ports: [
          {
            id: '7505da25-1308-4d7a-98fd-e6d5c917d35d_in',
            group: 'in'
          }
        ],
        data: {
          name: '数据输入_1',
          type: 'input',
          checkstatus: 'sucess'
        },
        attrs: {
          body: {
            fill: '#b9dec9',
            stroke: '#229453'
          },
          image: {
            'xlink:href': 'http://localhost:20002/src/assets/imgs/lime.png'
          },
          label: {
            text: '城春草木胜'
          },
          text: {
            fill: '#229453',
            text: '结束'
          }
        }
      }
    ],
    edges: [
      {
        attrs: { line: { strokedasharray: '5 5' } },
        connector: { name: 'curveconnector' },
        id: '6eea5dc9-4e15-4e78-959f-ee13ec59d11c',
        shape: 'data-processing-curve',
        source: { cell: 'ac51fb2f-2753-4852-8239-53672a29bb14', port: '_out' },
        target: { cell: '81004c2f-0413-4cc6-8622-127004b3befa', port: '_in' },
        zindex: -1
      },
      {
        attrs: { line: { strokedasharray: '5 5' } },
        connector: { name: 'curveconnector' },
        id: '8cbce713-54be-4c07-8efa-59c505f74ad7',
        labels: ['下半句'],
        shape: 'data-processing-curve',
        source: { cell: '81004c2f-0413-4cc6-8622-127004b3befa', port: '_out' },
        target: { cell: '7505da25-1308-4d7a-98fd-e6d5c917d35d', port: '_in' }
      }
    ]
  },
  // 节点状态列表
  nodestatuslist: [
    {
      id: 'ac51fb2f-2753-4852-8239-53672a29bb14',
      status: 'success'
    },
    {
      id: '81004c2f-0413-4cc6-8622-127004b3befa',
      status: 'success'
    }
  ],

  // 边状态列表
  edgestatuslist: [
    {
      id: '6eea5dc9-4e15-4e78-959f-ee13ec59d11c',
      status: 'success'
    },
    {
      id: '8cbce713-54be-4c07-8efa-59c505f74ad7',
      status: 'executing'
    }
  ]
})

// const { data } = torefs(state)

// // 节点类型
// enum nodetype {
//   input = 'input', // 数据输入
//   filter = 'filter', // 数据过滤
//   join = 'join', // 数据连接
//   union = 'union', // 数据合并
//   agg = 'agg', // 数据聚合
//   output = 'output' // 数据输出
// }

function init() {
  graph = new graph({
    container: graphcontainer.value,
    interacting: function () {
      return { nodemovable: false }
    },
    grid: true,
    panning: {
      enabled: false,
      eventtypes: ['leftmousedown', 'mousewheel']
    },
    mousewheel: {
      enabled: true,
      modifiers: 'ctrl',
      factor: 1.1,
      maxscale: 1.5,
      minscale: 0.5
    },
    highlighting: {
      magnetadsorbed: {
        name: 'stroke',
        args: {
          attrs: {
            fill: '#fff',
            stroke: '#31d0c6',
            strokewidth: 4
          }
        }
      }
    },
    connecting: {
      snap: true,
      allowblank: false,
      allowloop: false,
      highlight: true,
      sourceanchor: {
        name: 'bottom',
        args: {
          dx: 0
        }
      },
      targetanchor: {
        name: 'top',
        args: {
          dx: 0
        }
      },
      createedge() {
        return graph.createedge({
          shape: 'data-processing-curve',
          attrs: {
            line: {
              strokedasharray: '5 5'
            }
          },
          zindex: -1
        })
      },
      // 连接桩校验
      validateconnection({ sourcemagnet, targetmagnet }) {
        // 只能从输出链接桩创建连接
        if (!sourcemagnet || sourcemagnet.getattribute('port-group') === 'in') {
          return false
        }
        // 只能连接到输入链接桩
        if (!targetmagnet || targetmagnet.getattribute('port-group') === 'out') {
          return false
        }
        return true
      }
    }
  })
  graph.centercontent()

  // #region 初始化图形
  const ports = {
    groups: {
      in: {
        position: 'top',
        attrs: {
          circle: {
            r: 4,
            magnet: true,
            stroke: '#5f95ff',
            strokewidth: 1,
            fill: '#fff',
            style: {
              visibility: 'hidden'
            }
          }
        }
      },
      out: {
        position: 'bottom',
        attrs: {
          circle: {
            r: 4,
            magnet: true,
            stroke: '#31d0c6',
            strokewidth: 1,
            fill: '#fff',
            style: {
              visibility: 'hidden'
            }
          }
        }
      },
      left: {
        position: 'left',
        attrs: {
          circle: {
            r: 4,
            magnet: true,
            stroke: '#5f95ff',
            strokewidth: 1,
            fill: '#fff',
            style: {
              visibility: 'hidden'
            }
          }
        }
      },
      right: {
        position: 'right',
        attrs: {
          circle: {
            r: 4,
            magnet: true,
            stroke: '#5f95ff',
            strokewidth: 1,
            fill: '#fff',
            style: {
              visibility: 'hidden'
            }
          }
        }
      }
    }
    // items: [
    //   {
    //     id: state.currentcode + '_in',
    //     group: 'top',
    //   },
    //   {
    //     id: state.currentcode + '_out',
    //     group: 'out',
    //   }
    // ],
  }

  graph.registernode(
    'custom-node',
    {
      inherit: 'rect',
      width: 140,
      height: 76,
      attrs: {
        body: {
          strokewidth: 1
        },
        image: {
          width: 16,
          height: 16,
          x: 12,
          y: 6
        },
        text: {
          refx: 40,
          refy: 15,
          fontsize: 15,
          'text-anchor': 'start'
        },
        label: {
          text: 'please nominate this node',
          refx: 10,
          refy: 30,
          fontsize: 12,
          fill: 'rgba(0,0,0,0.6)',
          'text-anchor': 'start',
          textwrap: {
            width: -10, // 宽度减少 10px
            height: '70%', // 高度为参照元素高度的一半
            ellipsis: true, // 文本超出显示范围时,自动添加省略号
            breakword: true // 是否截断单词
          }
        }
      },
      markup: [
        {
          tagname: 'rect',
          selector: 'body'
        },
        {
          tagname: 'image',
          selector: 'image'
        },
        {
          tagname: 'text',
          selector: 'text'
        },
        {
          tagname: 'text',
          selector: 'label'
        }
      ],
      data: {},
      relation: {},
      ports: { ...ports }
    },
    true
  )

  // 注册连线
  graph.registerconnector(
    'curveconnector',
    (s, e) => {
      const offset = 4
      const deltay = math.abs(e.y - s.y)
      const control = math.floor((deltay / 3) * 2)

      const v1 = { x: s.x, y: s.y + offset + control }
      const v2 = { x: e.x, y: e.y - offset - control }

      return path.normalize(
        `m ${s.x} ${s.y}
         l ${s.x} ${s.y + offset}
         c ${v1.x} ${v1.y} ${v2.x} ${v2.y} ${e.x} ${e.y - offset}
         l ${e.x} ${e.y}
        `
      )
    },
    true
  )
}

edge.config({
  markup: [
    {
      tagname: 'path',
      selector: 'wrap',
      attrs: {
        fill: 'none',
        cursor: 'pointer',
        stroke: 'transparent',
        strokelinecap: 'round'
      }
    },
    {
      tagname: 'path',
      selector: 'line',
      attrs: {
        fill: 'none',
        pointerevents: 'none'
      }
    }
  ],
  connector: { name: 'curveconnector' },
  attrs: {
    wrap: {
      connection: true,
      strokewidth: 10,
      strokelinejoin: 'round'
    },
    line: {
      connection: true,
      stroke: '#a2b1c3',
      strokewidth: 1,
      targetmarker: {
        name: 'classic',
        size: 6
      }
    }
  }
})

graph.registeredge('data-processing-curve', edge, true)

function getdata() {
  let cells = [] as any
  const location = state.data
  location.nodes.map((node) => {
    cells.push(
      graph.addnode({
        id: node.id,
        x: node.x,
        y: node.y,
        shape: 'custom-node',
        attrs: node.attrs,
        ports: node.ports,
        data: node.data
      })
    )
  })
  location.edges.map((edge) => {
    cells.push(
      graph.addedge({
        id: edge.id,
        source: edge.source,
        target: edge.target,
        zindex: edge.zindex,
        shape: 'data-processing-curve',
        connector: { name: 'curveconnector' },
        labels: edge.labels,
        attrs: edge.attrs
      })
    )
  })
  graph.resetcells(cells)
}

// 开启边的运行动画
const excuteanimate = (edge: any) => {
  edge.attr({
    line: {
      stroke: '#3471f9'
    }
  })
  edge.attr('line/strokedasharray', 5)
  edge.attr('line/style/animation', 'running-line 30s infinite linear')
}

// 显示边状态
const showedgestatus = () => {
  state.edgestatuslist.foreach((item) => {
    const edge = graph.getcellbyid(item.id)
    if (item.status == 'success') {
      edge.attr('line/strokedasharray', 0)
      edge.attr('line/stroke', '#52c41a')
    } else if ('error' == item.status) {
      edge.attr('line/stroke', '#ff4d4f')
    } else if ('executing' == item.status) {
      excuteanimate(edge)
    }
  })
}

onmounted(() => {
  init()
  // graph.fromjson(state.data);
  getdata()
  showedgestatus()
})
</script>

<style lang="less" scoped>
.content-main {
  display: flex;
  width: 100%;
  flex-direction: column;
  height: calc(100vh - 85px - 40px);
  background-color: #ffffff;
  position: relative;
}
.content-container {
  position: relative;
  width: 100%;
  height: 100%;
  .content {
    width: 100%;
    height: 100%;
    position: relative;

    min-width: 400px;
    min-height: 600px;
    display: flex;
    border: 1px solid #dfe3e8;
    flex-direction: row;
    //   flex-wrap: wrap;
    flex: 1 1;

    .graph-content {
      width: calc(100%);
      height: 100%;
    }
  }
}

:deep(.x6-widget-transform) {
  margin: -1px 0 0 -1px;
  padding: 0px;
  border: 1px solid #239edd;
}
:deep(.x6-widget-transform > div) {
  border: 1px solid #239edd;
}
:deep(.x6-widget-transform > div:hover) {
  background-color: #3dafe4;
}
:deep(.x6-widget-transform-active-handle) {
  background-color: #3dafe4;
}
:deep(.x6-widget-transform-resize) {
  border-radius: 0;
}
:deep(.x6-widget-selection-inner) {
  border: 1px solid #239edd;
}
:deep(.x6-widget-selection-box) {
  opacity: 0;
}

.topic-image {
  visibility: hidden;
  cursor: pointer;
}
.x6-node:hover .topic-image {
  visibility: visible;
}
.x6-node-selected rect {
  stroke-width: 2px;
}
</style>
总结
到此这篇关于vue3 + antv/x6实现流程图的文章就介绍到这了,更多相关vue3+antv/x6流程图内容请搜索代码网以前的文章或继续浏览下面的相关文章希望大家以后多多支持代码网!


发表评论