由于工作需要,项目中要求实现一个功能—在视频或者图片上进行图形标注,支持矩形、多边形、线段、圆形、折线,已绘制的图形可以进行缩放,移动。
完整功能源代码在这个仓库,感兴趣的可以clone下来跑一下。
接下来我将实现一个dmeo来展示其中最简单的图形—矩形的创建。
初始化页面
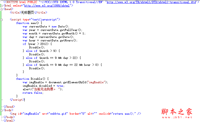
<!doctype html>
<html lang="en">
  <head>
    <meta charset="utf-8" />
    <meta http-equiv="x-ua-compatible" content="ie=edge" />
    <meta name="viewport" content="width=device-width, initial-scale=1.0" />
    <title>document</title>

    <style>
      body {
        margin: 0;
        padding: 0;
        height: 100vh;
        display: flex;
        align-items: center;
        justify-content: center;
      }

      canvas {
        border: 1px solid saddlebrown;
        background-color: beige;
      }
    </style>
  </head>
  <body>
    <canvas id="canvasidchart" class="canvas">您的浏览器不支持canvas1元素</canvas>
    <script src="./drawclass.js"></script>
    <script>
      const chart = new chart('canvasidchart')
    </script>
  </body>
</html>
该页面只有一个canvas,而功能的实现在drawclass里面,这里我实现了一个chart类,需要传入一个canvas的id,表示后续的绘制功能都是在这个canvas上实现的。
创建基础类chart
首先梳理下要实现一个图形标注需要涉及到什么事件
用户在canvas上按下鼠标,说明用户想要开始画一个矩形进行标注了,所以canvas上需要绑定一个onmousedown 事件。相应的绘制过程也涉及到了onmousemove 事件,而用户松开鼠标表示绘制已完成,即需要onmouseup事件。同时为了兼容这样一种情况—用户在绘制过程中鼠标移出了canvas的范围(此时的鼠标事件都是绑定在canvas上的),这种情况无法触发canvas的onmouseup事件,所以为canvas加上onmouseout,鼠标移出默认代表绘制完成。

初始化代码如下
class chart {
  constructor(canvasid) {
    this.cvs = document.getelementbyid(canvasid)
    this.ctx = this.cvs.getcontext('2d')
    this.shapes = [] // 保存图形数据的数组
    this.init() // 初始化canvas得宽高
    this.bindevent() // 为canvas绑定鼠标事件
    this.draw() // canvas的绘制
    this.isclickdown = false // 当前鼠标是否按下
    this.currentshape = null // 当前选中的图形
  }
  init() {
    const w = 1000,
      h = 600
    this.cvs.width = w
    this.cvs.height = h
  }
  bindevent() {
    this.cvs.onmousedown = (e) => {
      this.isclickdown = true
			// 鼠标按下的时候创建其他鼠标事件
      that.cvs.onmousemove = function (e){}
      that.cvs.onmouseup = function (e){}
      that.cvs.onmouseout = function (e){}
    }
  }
  draw() {}
}
为了后续拓展,我将各种图形封装成一个个类,如矩形封装成class **rectangle 。这样做的好处是我们只需要规定这样的图形类内部都有某些属性和方法给chart中的draw调用就行,比如我们可以把绘制矩形的实现写在rectangle类的draw函数上,而在chart中的draw上只需调用new rectangle().draw() 即可。要注意的是,draw方法是随着mousemove而要不断的刷新canvas重新绘制的,此时最好使用requestanimationframe方法让浏览在合适的时机调用draw。此时chart的draw方法如下:**
class chart {
	....
	draw() {
    requestanimationframe(this.draw.bind(this))
    this.ctx.clearrect(0, 0, this.cvs.width, this.cvs.height) // 首先清空canvas
    // 将shapes里面的图形重新绘制
    for (const s of this.shapes) {
      s.draw()
    }
  }
}
实现rectangle类
首先看一下矩形需要的几点要素
- 填充的颜色
- 矩形的初始位置(即鼠标按下的位置)
- 矩形的终点位置(即鼠标抬起的位置,也是鼠标移动的最后位置)
- 矩形需要绘制在哪里(此时需要绘制在canvas上)
- 矩形的初始位置可能会大于终点位置(鼠标按下后往左上角绘制),此时可用class语法中的get方法获取minx、maxx、miny、maxy
- 因为同类几何图形的实例可能会有很多,所以每个实例需要一个id
初始代码如下:
/**
 * 生成唯一id
 * @param {number} length  生成id的长度
 * @returns
 */
const genid = (length = 3) => {
  return number(math.random().tostring().substr(3, length) + date.now()).tostring(36)
}

class rectangle {
  constructor(el,color, startx, starty) {
    this.el = el // 保存需要绘制的载体
    this.shapetype = 'rect' // 当前几何图形的类别
    this.color = color // 填充的颜色
    // 初始化起点,默认起点和终点一样
    this.startx = startx
    this.starty = starty
    this.endx = startx
    this.endy = starty
    this.action = 'create'  // 当前的操作类型
    this.id = genid() // 当前实例的唯一id
  }

  get minx() {
    return math.min(this.startx, this.endx)
  }

  get maxx() {
    return math.max(this.startx, this.endx)
  }

  get miny() {
    return math.min(this.starty, this.endy)
  }

  get maxy() {
    return math.max(this.starty, this.endy)
  }

  draw() {}
}
实现rectangle类的draw函数 幸运的是canvas得api中已经有了绘制矩形的方法,不用我们一条线一条线的自己画了。该方法是 canvas.rect(startx,starty,width,height) 四个参数分别是矩形的起点横坐标和纵坐标,矩形的宽高,这也是为什么需要minx和miny。代码如下:
class rectangle {
	...
	 draw() {
    this.el.beginpath()  // 画笔起始点
    this.el.rect(
      this.minx,
      this.miny,
      (this.maxx - this.minx),
      (this.maxy - this.miny)
    )
    this.el.fillstyle = this.color // 填充颜色
    this.el.fill()
    this.el.strokestyle = '#fff' // 边框的颜色
    this.el.linecap = 'square'
    this.el.linewidth = 3 // 边框粗细
    this.el.stroke() // 画笔终点
  }
}
判断鼠标是否点击在矩形内部,用来判断是新建还是拖动矩形。 判断一个坐标点是否落在矩形的内部很好判断,就是通过minx、miny、maxx、maxy和传入的x、y对比就可以了
class rectangle {
	...

  isinside(x, y) {
    return x >= this.minx && x <= this.maxx && y >= this.miny && y <= this.maxy
  }
}
实现鼠标事件
在鼠标事件中,获取鼠标的坐标点属性有好几种,例如clientx/screenx/offsetx/pagex等,如需分别这几个属性的不同,可参考,目前我用的是offsetx,因为这个属性是获取相对于事件对象的位置,此时事件对象就是canvas。

onmousedown事件 在mousedown事件我们需要做两件事
判断鼠标落点是否在已有矩形的内部,如果有就是当前矩形的拖拽事件,如果不是则是新建矩形。 判断是否落在集合图形的内部前面我们在几何图形类中已经约定好了一个isinside方法,此时只需遍历shapes数组,依次调用每一项的isinside 方法就好。
...
// 遍历数组
getshapes(x, y) {
    for (let i = this.shapes.length - 1; i >= 0; i--) {
      const s = this.shapes[i]
      if (s.isinside(x, y)) {
        return s
      }
    }
    return null
  }
如果返回的是null,则进入新建逻辑。新建一个矩形的操作很简单,就是创建一个rectangle的实例,new rectangle(...) 并把new出来的实例添加进shapes数组中。并且此时的onmousemove事件也很简单,只需把实例中的endx、endy修改成当前move的坐标点。
// 新建
const shape = new rectangle(that.ctx, '#f00', clickx, clicky)
that.shapes.push(shape)
that.cvs.onmousemove = function (e) {
  shape.endx = e.offsetx
  shape.endy = e.offsety
}
此时如果返回的不是null,说明找到了当前鼠标点击的图形,执行的是拖拽逻辑。而拖拽逻辑需要计算矩形被拖拽的偏移量,如下图所示:

此时该矩形的四个坐标都要进行相应的同步修改,并且还要判断是否移动超出了边界。
完整代码如下所示:
class chart{
	...
	bindevent() {
		const that = this
    this.cvs.onmousedown = function (e) {
			this.isclickdown = true
      const [clickx, clicky] = [e.offsetx, e.offsety]
      const shape = that.getshapes(clickx, clicky)
			if (shape) {
        // 如果找到图形,说明是拖拽
        shape.action = 'move'
        const { startx, starty, endx, endy } = shape
        that.cvs.onmousemove = function (e) {
          const disx = e.offsetx - clickx
          const disy = e.offsety - clicky

          const newstartx = startx + disx
          const newendx = endx + disx
          const newstarty = starty + disy
          const newendy = endy + disy
          // 判断是否超出边界(矩形)
          if (newstartx < 0 || newendx > that.cvs.width || newstarty < 0 || newendy > that.cvs.height) {
            return
          }
          shape.startx = newstartx
          shape.endx = newendx
          shape.starty = newstarty
          shape.endy = newendy
        }
      } else {
        // 没找到,则是新建图形
        const shape = new rectangle(that.ctx, '#f00', clickx, clicky)
        that.shapes.push(shape)
        that.cvs.onmousemove = function (e) {
          shape.endx = e.offsetx
          shape.endy = e.offsety
        }
		}
	}

	getshapes(x, y) {
    for (let i = this.shapes.length - 1; i >= 0; i--) {
      const s = this.shapes[i]
      if (s.isinside(x, y)) {
        return s
      }
    }
    return null
  }
}
鼠标按下初始化onmousemove和onmouseup等事件。 onmousemove、onmouseup和onmouseout事件其实很简单,只需要取消鼠标移动事件和鼠标抬起事件即可
    that.cvs.onmouseup = function () {
      this.isclickdown = false
      that.cvs.onmousemove = null
      that.cvs.onmouseup = null
    }
    that.cvs.onmouseout = function () {
      this.isclickdown = false
      that.cvs.onmousemove = null
      that.cvs.onmouseup = null
    }
最终代码
此时,一个矩形的简单绘制和拖拽就完成了,后续的缩放需要的还可以单独开一篇文章讲讲。按照这种方式,其他几何图形我们可以新建相对应地类就行了,拓展起来就很方便了。
完整代码
// drawclass.js
/**
 * 生成唯一id
 * @param {number} length  生成id的长度
 * @returns
 */
const genid = (length = 3) => {
  return number(math.random().tostring().substr(3, length) + date.now()).tostring(36)
}

class chart {
  constructor(canvasid) {
    this.cvs = document.getelementbyid(canvasid)
    this.ctx = this.cvs.getcontext('2d')
    this.shapes = [] // 保存图形数据的数组
    this.init() // 初始化canvas得宽高
    this.bindevent() // 为canvas绑定鼠标事件
    this.draw() // canvas的绘制
    this.isclickdown = false // 当前鼠标是否按下
    this.ispolygon = false
    this.currentshape = null // 当前选中的图形
  }

  init() {
    const w = 1000,
      h = 600
    this.cvs.width = w
    this.cvs.height = h
  }

  bindevent() {
    const that = this
    this.cvs.onmousedown = function (e) {
      this.isclickdown = true
      const [clickx, clicky] = [e.offsetx, e.offsety]
      const shape = that.getshapes(clickx, clicky)
      if (shape) {
        // 如果找到图形,说明是拖拽
        shape.action = 'move'
        const { startx, starty, endx, endy } = shape
        that.cvs.onmousemove = function (e) {
          const disx = e.offsetx - clickx
          const disy = e.offsety - clicky

          const newstartx = startx + disx
          const newendx = endx + disx
          const newstarty = starty + disy
          const newendy = endy + disy
          // 判断是否超出边界(矩形)
          if (newstartx < 0 || newendx > that.cvs.width || newstarty < 0 || newendy > that.cvs.height) {
            return
          }
          shape.startx = newstartx
          shape.endx = newendx
          shape.starty = newstarty
          shape.endy = newendy
        }
      } else {
        // 没找到,则是新建图形
        const shape = new rectangle(that.ctx, '#f00', clickx, clicky)
        that.shapes.push(shape)
        that.cvs.onmousemove = function (e) {
          shape.endx = e.offsetx
          shape.endy = e.offsety
          const radius = math.sqrt(
            math.pow(e.offsetx - clickx, 2) + math.pow(e.offsety - clicky, 2)
          )
          shape.radius = radius
        }
      }
      that.cvs.onmouseup = function () {
        this.isclickdown = false
        that.cvs.onmousemove = null
        that.cvs.onmouseup = null
      }
      that.cvs.onmouseout = function () {
        this.isclickdown = false
        that.cvs.onmousemove = null
        that.cvs.onmouseup = null
      }
    }
  }

  getshapes(x, y) {
    for (let i = this.shapes.length - 1; i >= 0; i--) {
      const s = this.shapes[i]
      if (s.isinside(x, y)) {
        return s
      }
    }
    return null
  }

  draw() {
    requestanimationframe(this.draw.bind(this))
    this.ctx.clearrect(0, 0, this.cvs.width, this.cvs.height) // 首先清空canvas
    // 将shapes里面的图形重新绘制
    for (const s of this.shapes) {
      s.draw()
    }
  }
}

class rectangle {
  constructor(el,color, startx, starty) {
    this.el = el // 保存需要绘制的载体
    this.shapetype = 'rect' // 当前几何图形的类别
    this.color = color // 填充的颜色
    // 初始化起点,默认起点和终点一样
    this.startx = startx
    this.starty = starty
    this.endx = startx
    this.endy = starty
    this.action = 'create'  // 当前的操作类型
    this.id = genid() // 当前实例的唯一id
  }

  get minx() {
    return math.min(this.startx, this.endx)
  }

  get maxx() {
    return math.max(this.startx, this.endx)
  }

  get miny() {
    return math.min(this.starty, this.endy)
  }

  get maxy() {
    return math.max(this.starty, this.endy)
  }

  draw() {
    this.el.beginpath()  // 画笔起始点
    this.el.rect(
      this.minx,
      this.miny,
      (this.maxx - this.minx),
      (this.maxy - this.miny)
    )
    this.el.fillstyle = this.color // 填充颜色
    this.el.fill()
    this.el.strokestyle = '#fff' // 边框的颜色
    this.el.linecap = 'square'
    this.el.linewidth = 3 // 边框粗细
    this.el.stroke() //画笔的终点
  }

  isinside(x, y) {
    return x >= this.minx && x <= this.maxx && y >= this.miny && y <= this.maxy
  }
}
到此这篇关于js利用原生canvas实现图形标注功能的文章就介绍到这了,更多相关js canvas图形标注内容请搜索代码网以前的文章或继续浏览下面的相关文章希望大家以后多多支持代码网!


发表评论