netstat是控制台命令,是一个监控tcp/ip网络的非常有用的工具,它可以显示路由表、实际的网络连接以及每一个网络接口设备的状态信息。netstat用于显示与ip、tcp、udp和icmp协议相关的统计数据,一般用于检验本机各端口的网络连接情况。
linux上面排查某个端口号是否被占用
1.netstat -anp |grep 端口号
如下,我以3306为例,netstat -anp |grep 3306(此处备注下,我是以普通用户操作,故加上了sudo,如果是以root用户操作,不用加sudo即可查看)

主要看监控状态为listen表示已经被占用,最后一列显示被服务mysqld占用,查看具体端口号,只要有如图这一行就表示被占用了。
2.netstat -nultp(此处不用加端口号)
该命令是查看当前所有已经使用的端口情况:
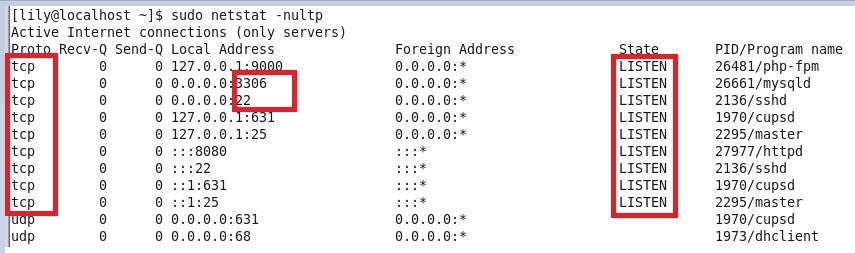
可以看出我的82端口没有被占用
3.netstat -anp |grep 82查看82端口的使用情况,如图3
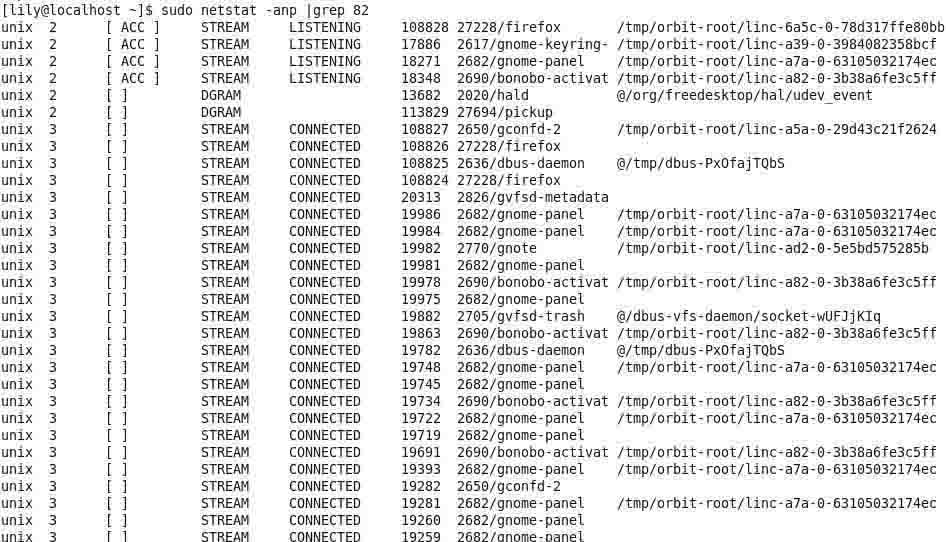
图3
可以看出并没有listen那一行,所以就表示没有被占用。此处注意,图中显示的listening并不表示端口被占用,不要和listen混淆哦,查看具体端口时候,必须要看到tcp,端口号,listen那一行,才表示端口被占用了
下面是一些常用的命令
常见参数
- -a (all)显示所有选项,默认不显示listen相关
- -t (tcp)仅显示tcp相关选项
- -u (udp)仅显示udp相关选项
- -n 拒绝显示别名,能显示数字的全部转化成数字。
- -l 仅列出有在 listen (监听) 的服務状态
- -p 显示建立相关链接的程序名
- -r 显示路由信息,路由表
- -e 显示扩展信息,例如uid等
- -s 按各个协议进行统计
- -c 每隔一个固定时间,执行该netstat命令。
提示:listen和listening的状态只有用-a或者-l才能看到
1、列出所有的连接(包括监听和未监听的)
netstat -a
$ netstat -a
active internet connections (servers and established)
proto recv-q send-q local address           foreign address         state
tcp        0      0 enlightened:domain      *:*                     listen
tcp        0      0 localhost:ipp           *:*                     listen
tcp        0      0 enlightened.local:54750 li240-5.members.li:http established
tcp        0      0 enlightened.local:49980 del01s07-in-f14.1:https established
tcp6       0      0 ip6-localhost:ipp       [::]:*                  listen
udp        0      0 enlightened:domain      *:*
udp        0      0 *:bootpc                *:*
udp        0      0 enlightened.local:ntp   *:*
udp        0      0 localhost:ntp           *:*
udp        0      0 *:ntp                   *:*
udp        0      0 *:58570                 *:*
udp        0      0 *:mdns                  *:*
udp        0      0 *:49459                 *:*
udp6       0      0 fe80::216:36ff:fef8:ntp [::]:*
udp6       0      0 ip6-localhost:ntp       [::]:*
udp6       0      0 [::]:ntp                [::]:*
udp6       0      0 [::]:mdns               [::]:*
udp6       0      0 [::]:63811              [::]:*
udp6       0      0 [::]:54952              [::]:*
active unix domain sockets (servers and established)
proto refcnt flags       type       state         i-node   path
unix  2      [ acc ]     stream     listening     12403    @/tmp/dbus-idgfj3ugxx
unix  2      [ acc ]     stream     listening     40202    @/dbus-vfs-daemon/socket-6nuc6ccx
上述命令会列出tcp,udp和unix协议下所有套接字的所有连接。
2、只列出tcp和udp协议的连接。
使用-at选项查看tcp协议的连接
$ netstat -at

active internet connections (servers and established)
proto recv-q send-q local address           foreign address         state
tcp        0      0 enlightened:domain      *:*                     listen
tcp        0      0 localhost:ipp           *:*                     listen
tcp        0      0 enlightened.local:36310 del01s07-in-f24.1:https established
tcp        0      0 enlightened.local:45038 a96-17-181-10.depl:http established
tcp        0      0 enlightened.local:37892 abts-north-static-:http established
.....
使用-au选项使用udp协议的连接:
# netstat -au
active internet connections (servers and established)
proto recv-q send-q local address           foreign address         state
udp        0      0 *:34660                 *:*
udp        0      0 enlightened:domain      *:*
udp        0      0 *:bootpc                *:*
udp        0      0 enlightened.local:ntp   *:*
udp        0      0 localhost:ntp           *:*
udp        0      0 *:ntp                   *:*
udp6       0      0 fe80::216:36ff:fef8:ntp [::]:*
udp6       0      0 ip6-localhost:ntp       [::]:*
udp6       0      0 [::]:ntp                [::]:*
上面同时显示了 ipv4 和 ipv6 的连接。
3、禁用反向域名,加快查询的速度
默认情况下netstat会通过反向域名解析技术查找每个ip地址对应的主机名。这会降低查找的速度,如果你觉得iop地址已经足够,而没有必要知道主机名,就使用-n选项禁用域名解析功能。
$ netstat -ant
active internet connections (servers and established)
proto recv-q send-q local address           foreign address         state
tcp        0      0 127.0.1.1:53            0.0.0.0:*               listen
tcp        0      0 127.0.0.1:631           0.0.0.0:*               listen
tcp        0      0 192.168.1.2:49058       173.255.230.5:80        established
tcp        0      0 192.168.1.2:33324       173.194.36.117:443      established
tcp6       0      0 ::1:631                 :::*                    listen
4、列出所有处于监听状态的 sockets
只显示监听端口 netstat -l
# netstat -l active internet connections (only servers) proto recv-q send-q local address foreign address state tcp 0 0 localhost:ipp *:* listen tcp6 0 0 localhost:ipp [::]:* listen udp 0 0 *:49119 *:*
只列出所有监听 tcp 端口 netstat -lt
# netstat -lt active internet connections (only servers) proto recv-q send-q local address foreign address state tcp 0 0 localhost:30037 *:* listen tcp 0 0 *:smtp *:* listen tcp6 0 0 localhost:ipp [::]:* listen
只列出所有监听 udp 端口 netstat -lu
# netstat -lu active internet connections (only servers) proto recv-q send-q local address foreign address state udp 0 0 *:49119 *:* udp 0 0 *:mdns *:*
只列出所有监听 unix 端口 netstat -lx
# netstat -lx active unix domain sockets (only servers) proto refcnt flags type state i-node path unix 2 [ acc ] stream listening 6294 private/maildrop unix 2 [ acc ] stream listening 6203 public/cleanup unix 2 [ acc ] stream listening 6302 private/ifmail unix 2 [ acc ] stream listening 6306 private/bsmtp
5、获取进程名、进程号以及用户id
查看端口和连接的信息时,能查看到他们对应的进程名和进程号对系统管理员来说是非常有帮助的。举个栗子,apache的http服务开启80端口,如果要查看http服务是否已经启动,或者http服务是由apache还是nginx启动的,这时候你可以看看进程号。
使用-p选项查看进程信息
~$ sudo netstat -nlpt
active internet connections (only servers)
proto recv-q send-q local address           foreign address         state       pid/program name
tcp        0      0 127.0.1.1:53            0.0.0.0:*               listen      1144/dnsmasq
tcp        0      0 127.0.0.1:631           0.0.0.0:*               listen      661/cupsd
tcp6       0      0 ::1:631                 :::*                    listen      661/cupsd
使用-p选项时,netstat必须运行在root权限之下,不然他就不能得到运行在root权限下的进程名,而很多服务包括http和ftp都运行在root权限之下。
相比进程名和进程号而言,查看进程的拥有者会更有用。使用-ep选项可以同时查看进程名和用户名。
$ sudo netstat -ltpe
active internet connections (only servers)
proto recv-q send-q local address           foreign address         state       user       inode       pid/program name
tcp        0      0 enlightened:domain      *:*                     listen      root       11090       1144/dnsmasq
tcp        0      0 localhost:ipp           *:*                     listen      root       9755        661/cupsd
tcp6       0      0 ip6-localhost:ipp       [::]:*                  listen      root       9754        661/cupsd
上面列出tcp协议下的监听套接字,同时显示进程信息和一些额外的信息。
这些额外的信息包括用户名和进程的索引节点号。这个命令对网管来说很有用。
注意 – 假如你将 -n 和 -e 选项一起使用,user 列的属性就是用户的 id 号,而不是用户名。
6、打印统计数据
netstat可以打印网络统计数据,包括某个协议的收发包数量。
下面列出所有网络的统计情况:
$ netstat -s
ip:
    32797 total packets received
    0 forwarded
    0 incoming packets discarded
    32795 incoming packets delivered
    29115 requests sent out
    60 outgoing packets dropped
icmp:
    125 icmp messages received
    0 input icmp message failed.
    icmp input histogram:
        destination unreachable: 125
    125 icmp messages sent
    0 icmp messages failed
    icmp output histogram:
        destination unreachable: 125
... output truncated ...
如果想只打印tcp或udp协议的统计数据,只要加上对应的选项(-t和-u)即可。
7、显示内核路由信息
使用-r选项打印内核路由信息。打印出来的信息与route命令输出的信息一样。我们可以使用-n选项禁止域名解析。
$ netstat -rn
kernel ip routing table
destination     gateway         genmask         flags   mss window  irtt iface
0.0.0.0         192.168.1.1     0.0.0.0         ug        0 0          0 eth0
192.168.1.0     0.0.0.0         255.255.255.0   u         0 0          0 eth0
8、打印网络接口
netstat也能打印网络接口信息,-i选项就是为这个功能而生。
$ netstat -i
kernel interface table
iface   mtu met   rx-ok rx-err rx-drp rx-ovr    tx-ok tx-err tx-drp tx-ovr flg
eth0       1500 0     31611      0      0 0         27503      0      0      0 bmru
lo        65536 0      2913      0      0 0          2913      0      0      0 lru
上面输出的信息比较原始。我们将-e选项和-i选项搭配使用,可以输出用户友好的信息。
$ netstat -ie
kernel interface table
eth0      link encap:ethernet  hwaddr 00:16:36:f8:b2:64
          inet addr:192.168.1.2  bcast:192.168.1.255  mask:255.255.255.0
          inet6 addr: fe80::216:36ff:fef8:b264/64 scope:link
          up broadcast running multicast  mtu:1500  metric:1
          rx packets:31682 errors:0 dropped:0 overruns:0 frame:0
          tx packets:27573 errors:0 dropped:0 overruns:0 carrier:0
          collisions:0 txqueuelen:1000
          rx bytes:29637117 (29.6 mb)  tx bytes:4590583 (4.5 mb)
          interrupt:18 memory:da000000-da020000

lo        link encap:local loopback
          inet addr:127.0.0.1  mask:255.0.0.0
          inet6 addr: ::1/128 scope:host
          up loopback running  mtu:65536  metric:1
          rx packets:2921 errors:0 dropped:0 overruns:0 frame:0
          tx packets:2921 errors:0 dropped:0 overruns:0 carrier:0
          collisions:0 txqueuelen:0
          rx bytes:305297 (305.2 kb)  tx bytes:305297 (305.2 kb)
上面的输出信息与ifconfig输出的信息一样。
9、netstat持续输出
我么可以使用netstat的-c选项持续输出信息。
$ netstat -ct
这个命令可以持续输出tcp协议信息。
10、显示多播组信息
选项-g会输出ipv4和ipv6的多播组信息
$ netstat -g
ipv6/ipv4 group memberships
interface       refcnt group
--------------- ------ ---------------------
lo              1      all-systems.mcast.net
eth0            1      224.0.0.251
eth0            1      all-systems.mcast.net
lo              1      ip6-allnodes
lo              1      ff01::1
eth0            1      ff02::fb
eth0            1      ff02::1:fff8:b264
eth0            1      ip6-allnodes
eth0            1      ff01::1
wlan0           1      ip6-allnodes
wlan0           1      ff01::1
打印active 的状态连接
active状态的套接字连接用“established”字段表示,所以我们可以使用grep命令获取active状态的连接:
$ netstat -atnp | grep esta
(not all processes could be identified, non-owned process info
 will not be shown, you would have to be root to see it all.)
tcp        0      0 192.168.1.2:49156       173.255.230.5:80        established 1691/chrome
tcp        0      0 192.168.1.2:33324       173.194.36.117:443      established 1691/chrome
配合watch命令监听active状态的连接:
$ watch -d -n0 "netstat -atnp | grep esta"
查看服务是否在运行
如果想看看http,smtp或ntp服务是否在运行,使用grep
$ sudo netstat -aple | grep ntp
udp        0      0 enlightened.local:ntp   *:*                                 root       17430       1789/ntpd
udp        0      0 localhost:ntp           *:*                                 root       17429       1789/ntpd
udp        0      0 *:ntp                   *:*                                 root       17422       1789/ntpd
udp6       0      0 fe80::216:36ff:fef8:ntp [::]:*                              root       17432       1789/ntpd
udp6       0      0 ip6-localhost:ntp       [::]:*                              root       17431       1789/ntpd
udp6       0      0 [::]:ntp                [::]:*                              root       17423       1789/ntpd
unix  2      [ ]         dgram                    17418    1789/ntpd
11. ip和tcp分析
查看连接某服务端口最多的的ip地址
wss8848@ubuntu:~$ netstat -nat | grep "192.168.1.15:22" |awk '{print $5}'|awk -f: '{print $1}'|sort|uniq -c|sort -nr|head -2018 221.136.168.363 154.74.45.2422 78.173.31.2362 62.183.207.982 192.168.1.142 182.48.111.2152 124.193.219.342 119.145.41.22 114.255.41.301 75.102.11.99
tcp各种状态列表
wss8848@ubuntu:~$ netstat -nat |awk '{print $6}'established)foreignlistentime_waitestablishedtime_waitsyn_sent
先把状态全都取出来,然后使用uniq -c统计,之后再进行排序。
wss8848@ubuntu:~$ netstat -nat |awk '{print $6}'|sort|uniq -c143 established1 fin_wait11 foreign1 last_ack36 listen6 syn_sent113 time_wait1 established)
最后的命令如下:
netstat -nat |awk '{print $6}'|sort|uniq -c|sort -rn
分析access.log获得访问前10位的ip地址
awk '{print $1}' access.log |sort|uniq -c|sort -nr|head -10
总结
以上为个人经验,希望能给大家一个参考,也希望大家多多支持代码网。


发表评论