执行计划:
在sql的执行过程中,执行计划的重要性不容忽视。一个恰当的执行计划是确保sql语句高效运行的关键因素之一。每一条sql语句,在任意类型的数据库系统中,都与其特定的执行计划相对应。特别是在oracle数据库环境中,执行计划可以进一步区分为估计的执行计划和实际执行的执行计划(其他数据库管理系统也存在类似的概念)。因此,掌握如何准确地查看特别是实际发生的执行计划的方法变得尤为关键。常用的方法包括但不限于以下几种:
- 工具类的图形化界面点击(如
plsqldev中的f5) - 黑屏工具sql*plus中的
autotrace工具 explain plan for解释之后的执行计划dbms_xplan提取的cursor或者plan_table或者awr中的- oracle11g版本以上的
sql_monitor - 万能的10046和10053追踪事件
分类列举:
在oracle数据库中,执行计划主要分为两类:估算的执行计划和实际的执行计划。接下来,我们将针对这两种类型的执行计划,探讨不同的查看方法及其所呈现的是估算结果还是实际运行情况。
估算的执行计划:
对于估算的执行计划,可以采用前三种方法,分别为:
工具类图形化界面:
打开plsql_dev工具,右上角选择新建一个explain plan window,输入我们想查看执行计划的sql,然后点左上角的执行,得到执行计划(估算的)如下:
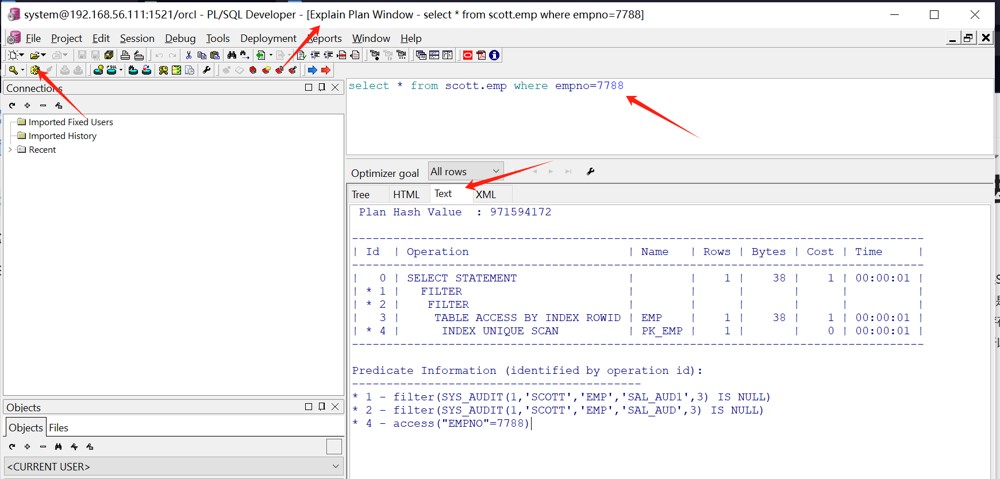
注意标签选择text格式,除了树形的执行计划信息我们还可以得到额外的谓词过滤信息。
autotrace方式
通过使用如sql*plus这样的命令行工具连接至数据库,可以通过设置set autotrace <选项>来获取sql语句的预估执行计划。autotrace功能提供了多种选项,每种选项具有不同的用途:
on:开启自动跟踪模式,显示查询的结果以及其执行计划。off:关闭自动跟踪模式。traceonly:仅显示执行计划而不显示查询结果。explain:仅生成执行计划,不实际执行查询。statistics:除了执行计划外,还提供关于执行过程中发生的统计信息,比如逻辑读取次数等。
一通常最常用的命令是 set autotrace,该命令主要用于展示sql语句的执行计划及相关的统计信息,具体使用方法如下:
sql> set autot trace
sql> select count(*) from scott.emp where empno=7788;
执行计划信息:
execution plan
----------------------------------------------------------
plan hash value: 1729829196
-----------------------------------------------------------------------------
| id | operation | name | rows | bytes | cost (%cpu)| time |
-----------------------------------------------------------------------------
| 0 | select statement | | 1 | 4 | 0 (0)| 00:00:01 |
| 1 | sort aggregate | | 1 | 4 | | |
|* 2 | index unique scan| pk_emp | 1 | 4 | 0 (0)| 00:00:01 |
-----------------------------------------------------------------------------
predicate information (identified by operation id):
---------------------------------------------------
2 - access("empno"=7788)
统计信息:
statistics
----------------------------------------------------------
1 recursive calls
0 db block gets
1 consistent gets
0 physical reads
0 redo size
526 bytes sent via sql*net to client
524 bytes received via sql*net from client
2 sql*net roundtrips to/from client
0 sorts (memory)
0 sorts (disk)
1 rows processed
和上一个方法相比优点是可以看到执行过程中的统计信息。
explain plan for方式
同样使用黑屏工具连接到数据库执行,具体使用方法如下:
explain plan for select count(*) from scott.emp;
命令执行完成之后会把当前sql对应的执行计划信息存放进当前用户的plan_table表里,然后再通过如下方法获取上一条执行的sql对应执行计划,如下:
sql> set lines 900 pages 900
sql> explain plan for select count(*) from scott.emp where empno=7788;
explained.
sql> select * from table(dbms_xplan.display);
plan_table_output
------------------------------------------------------------------------------------------------------------------------------------------------------------------------------------------------------------------------------------------------------------------------------------------------------------
plan hash value: 1729829196
-----------------------------------------------------------------------------
| id | operation | name | rows | bytes | cost (%cpu)| time |
-----------------------------------------------------------------------------
| 0 | select statement | | 1 | 4 | 0 (0)| 00:00:01 |
| 1 | sort aggregate | | 1 | 4 | | |
|* 2 | index unique scan| pk_emp | 1 | 4 | 0 (0)| 00:00:01 |
-----------------------------------------------------------------------------
predicate information (identified by operation id):
---------------------------------------------------
2 - access("empno"=7788)
14 rows selected.
真实的执行计划
dbms_xplan包方式
dbms_xplan 包提供了从 plan_table、游标以及 awr(automatic workload repository)中提取与 sql 语句相关联的执行计划的功能。在实际应用中,最常见的使用场景是从 plan_table 和游标中获取这些信息。特别地,通过游标获取的执行计划能够附加诸如 a-time(实际时间)和 a-rows(实际行数)等额外指标,从而提供了一个更为详尽且基于实际运行情况的执行计划视图。
查看带有实际执行时间的真实执行计划,操作方法如下:
#先为sql添加/*+ gather_plan_statistics */这个hint:
select /*+ gather_plan_statistics */ count(*) from scott.emp_new where empno=7788;
count(*)
----------
4096
#sql执行完成之后使用如下语句获取真实执行计划信息:
select * from table(dbms_xplan.display_cursor(null,null,'allstats last'));
plan_table_output
------------------------------------------------------------------------------------------------------------------------------------------------------------------------------------------------------------------------------------------------------------------------------------------------------------
sql_id dsz37xu3fzz97, child number 0
-------------------------------------
select /*+ gather_plan_statistics */ count(*) from scott.emp_new
where empno=7788
plan hash value: 4139378512
----------------------------------------------------------------------------------------
| id | operation | name | starts | e-rows | a-rows | a-time | buffers |
----------------------------------------------------------------------------------------
| 0 | select statement | | 1 | | 1 |00:00:00.01 | 374 |
| 1 | sort aggregate | | 1 | 1 | 1 |00:00:00.01 | 374 |
|* 2 | table access full| emp_new | 1 | 4187 | 4096 |00:00:00.01 | 374 |
----------------------------------------------------------------------------------------
predicate information (identified by operation id):
---------------------------------------------------
2 - filter("empno"=7788)
note
-----
- dynamic sampling used for this statement (level=2)
24 rows selected.有些时候也可以通过的dbms_xplan包获取当前正在执行的sql对应的执行计划,具体操作如下:
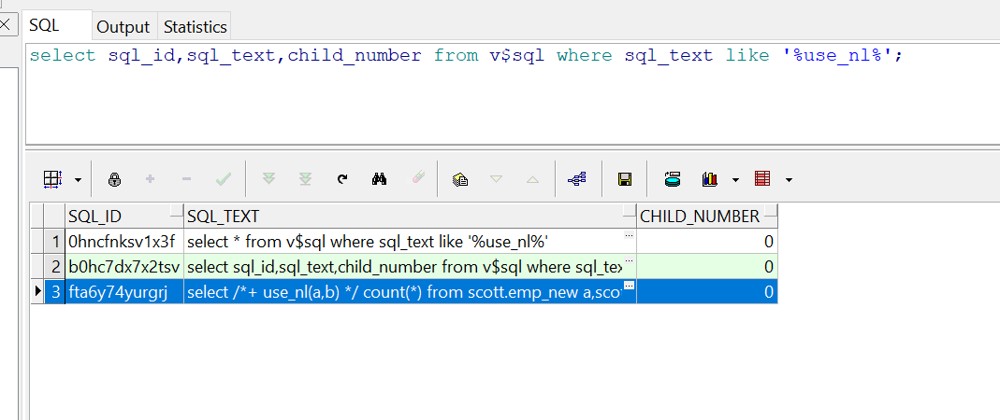
#运行一个比较耗时间的慢sql:
select /*+ use_nl(a,b) */ count(*) from scott.emp_new a,scott.emp_new b where a.empno=b.empno;
#通过v$sql找到这个sql_id:
select sql_id,sql_text,child_number from v$sql where sql_text like '%use_nl%';
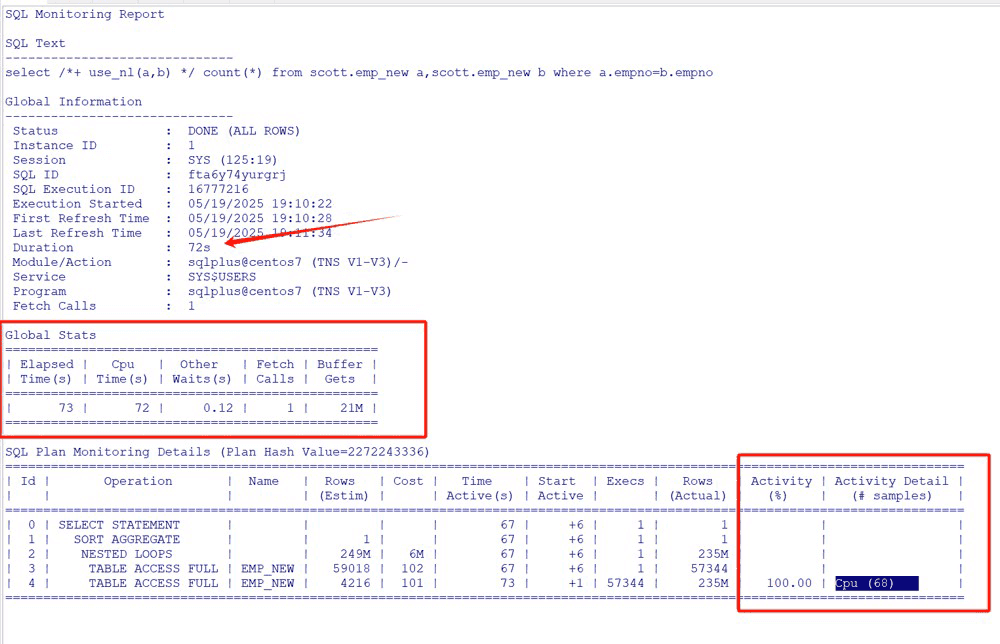
sql_monito方式
sql monitor是oracle 11g版本中引入的一项新特性,旨在对资源消耗较高的sql语句自动进行监控。当检测到符合条件的sql执行时,oracle数据库将默认启动对该sql语句的监视过程,并将收集到的相关数据存储于专用的内存区域中,以便后续用于性能分析与优化。利用sql monitor功能,用户能够获取被监控sql语句的实际执行计划、运行期间产生的各类统计信息以及发生的等待事件等详细资料。
#发起一个慢查询语句:
select /*+ use_nl(a,b) */ count(*) from scott.emp_new a,scott.emp_new b where a.empno=b.empno;
#通过v$sql找到对应的sql_id为:fta6y74yurgrj
#查看v$sql_monitor视图是否有数据记录:
select count(*) from v$sql_monitor where sql_id='fta6y74yurgrj'
count(*)

----------

1 --代表已经监控到
#使用dbms_sqltune包把监控的内容调出来(推荐在白屏工具上调用):
select dbms_sqltune.report_sql_monitor(sql_id=>'fta6y74yurgrj') from dual;
#然后将sql_id与child_number都带入dbms_xplan参数
select * from table(dbms_xplan.display_cursor('fta6y74yurgrj',0));
plan_table_output
------------------------------------------------------------------------------------------------------------------------------------------------------------------------------------------------------------------------------------------------------------------------------------------------------------
sql_id fta6y74yurgrj, child number 0
-------------------------------------
select /*+ use_nl(a,b) */ count(*) from scott.emp_new a,scott.emp_new b
where a.empno=b.empno
plan hash value: 2272243336
-------------------------------------------------------------------------------
| id | operation | name | rows | bytes | cost (%cpu)| time |
-------------------------------------------------------------------------------
| 0 | select statement | | | | 5932k(100)| |
| 1 | sort aggregate | | 1 | 26 | | |
| 2 | nested loops | | 248m| 6168m| 5932k (1)| 19:46:31 |
| 3 | table access full| emp_new | 59018 | 749k| 102 (0)| 00:00:02 |
|* 4 | table access full| emp_new | 4216 | 54808 | 101 (1)| 00:00:02 |
-------------------------------------------------------------------------------
predicate information (identified by operation id):
---------------------------------------------------
4 - filter("a"."empno"="b"."empno")
note
-----
- dynamic sampling used for this statement (level=2)
26 rows selected.这样看来,sql_monitor要比先前的几种方式更加全面,所得的信息更多,尤其是activity显示比较耗时的算子值得我们重点关注。
当然有时候我们需要对一条件不那么耗资源的sql也进行监控,这个时候需要在sql语句中添加/*+ monitor */这个hint来告诉优化器对该条sql进行强制的监控。
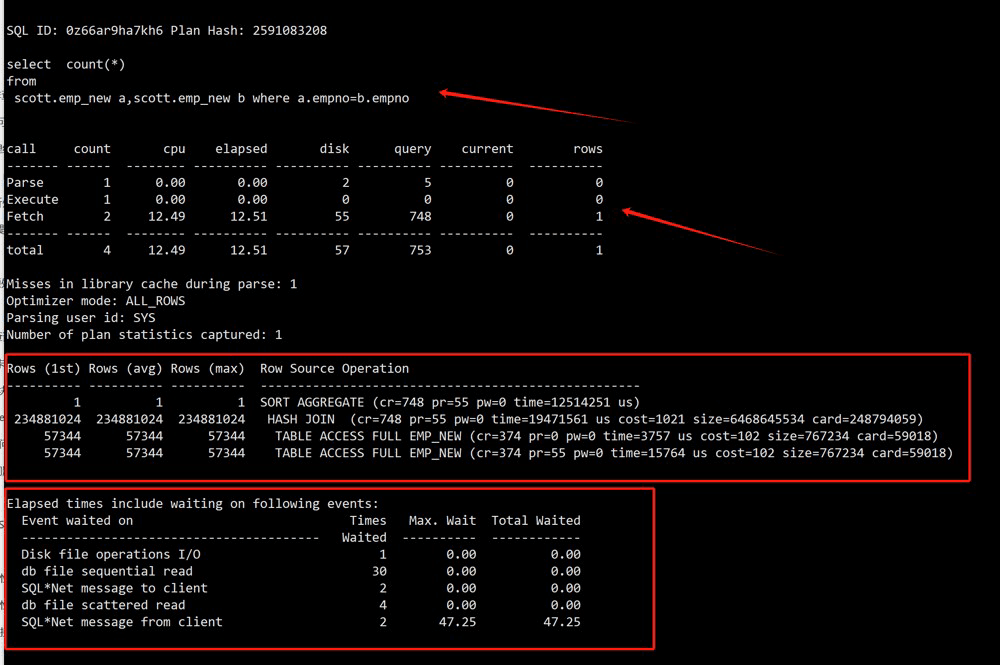
10046和10053方式
事件10046与10053均为oracle数据库中用于内部追踪的重要工具,二者均可提供sql语句的执行计划及其相关统计信息。然而,它们各自的关注点有所不同:事件10046主要聚焦于会话内特定sql语句的实际执行路径;而事件10053则更加侧重于揭示单个sql语句执行计划的生成过程。在日常实践中,除非需要深入分析较为复杂的sql性能问题,否则通常推荐使用事件10046来进行监控和调试。
值得注意的是,事件10046提供了多个级别选项,其中最常用的为level 12。此外,该事件还支持针对不同范围的应用,包括但不限于全局(需谨慎使用)、会话、模块乃至单独的sql语句层面。基于本次讨论的目的,我们将重点探讨如何在会话层面上应用事件10046。
#找到当前会话的spid信息:
select p.spid from v$session s,v$process p where p.addr =s.paddr and s.sid=(select userenv('sid') from dual);
spid
------------------------
6879
#对这个spid做oradebug 10046,具体如下:
sql> oradebug setospid 6879; --设置spid
oracle pid: 33, unix process pid: 6879, image: oracle@centos7 (tns v1-v3)
sql> oradebug tracefile_name; --获取trace文件名
/u01/app/oracle/diag/rdbms/orcl/orcl/trace/orcl_ora_6879.trc
sql> oradebug event 10046 trace name context forever,level 12; --开启10046 level 12
statement processed.
#执行我们想要查看执行计划的sql:
sql> select count(*) from scott.emp_new a,scott.emp_new b where a.empno=b.empno;
count(*)
----------
234881024
#关闭会话级别的10046
sql> oradebug event 10046 trace name context off;
statement processed.
#找到对应的trc文件,并作tkprof格式化处理:
[oracle@centos7 arch]$ tkprof /u01/app/oracle/diag/rdbms/orcl/orcl/trace/orcl_ora_6879.trc sql.trc
tkprof: release 11.2.0.4.0 - development on mon may 19 19:36:45 2025
copyright (c) 1982, 2011, oracle and/or its affiliates. all rights reserved.
#打开格式化的trc文件并找到对应的执行计划信息:
总结:
oracle数据库中的执行计划对于优化sql语句的执行性能至关重要。文档详细介绍了如何查看估算和实际的执行计划,提供了多种方法和工具,包括图形化界面、autotrace、explain plan for语句、dbms_xplan包、sql monitor以及10046和10053追踪事件。
通过这些方法,我们可以更深入地理解sql语句的执行过程,并据此进行性能优化,虽然文档提供了多种查看执行计划的方法,但在实际应用中,如何根据不同的业务场景和性能需求,选择最合适的执行计划查看方法,以及如何根据执行计划的结果进行有效的sql优化,仍然是一个值得深入探讨的问题。
到此这篇关于oracle查看sql执行计划的文章就介绍到这了,更多相关oracle查看sql执行计划内容请搜索代码网以前的文章或继续浏览下面的相关文章希望大家以后多多支持代码网!


发表评论