wpf实现曲线数据展示,函数曲线展示,实例:震动数据分析为例。
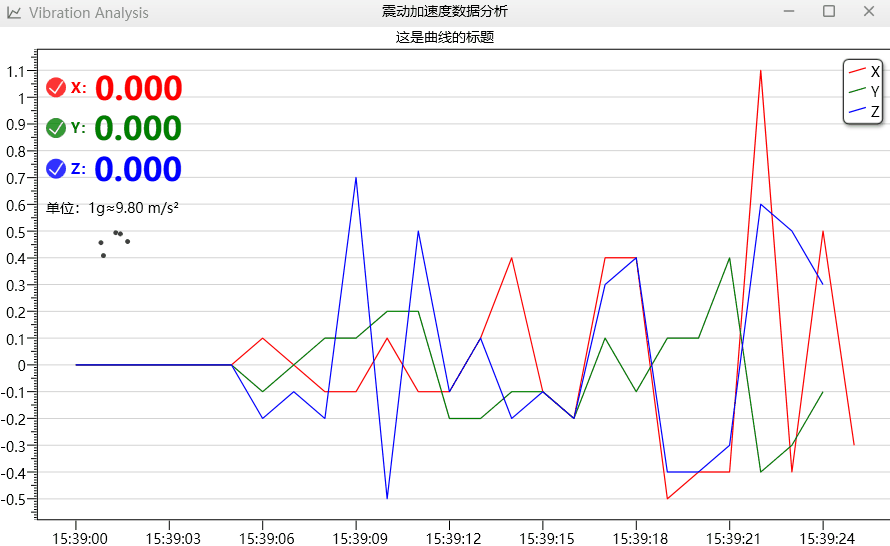
如上图所示,如果你想实现上图中的效果,请详细参考我的内容。
一共有两种方式来实现,一种是使用第三方的框架来实现,另外一种是自己通过原创代码来一步步实现,本文主要介绍这两种曲线的实现方式。
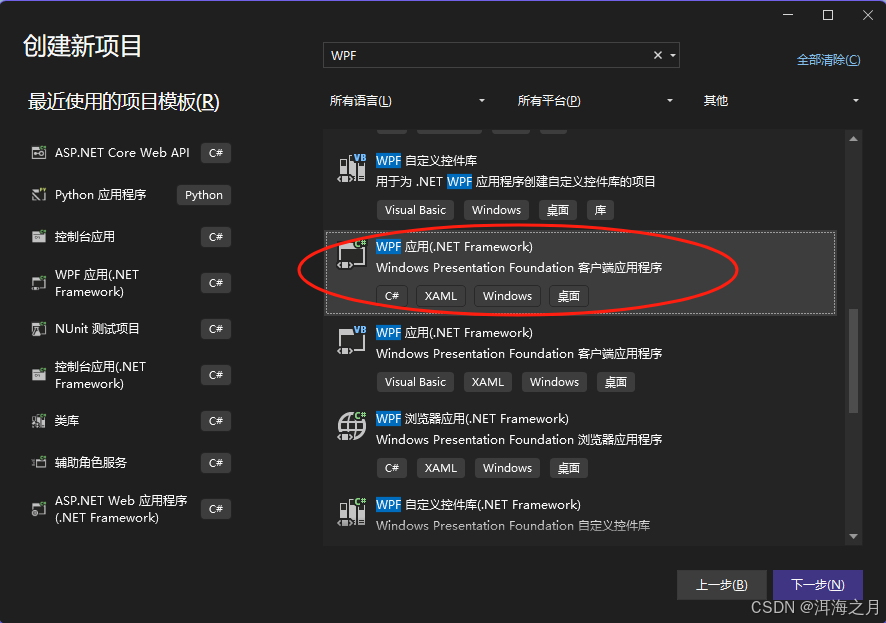
1.首先我创建一个wpf的解决方案项目。
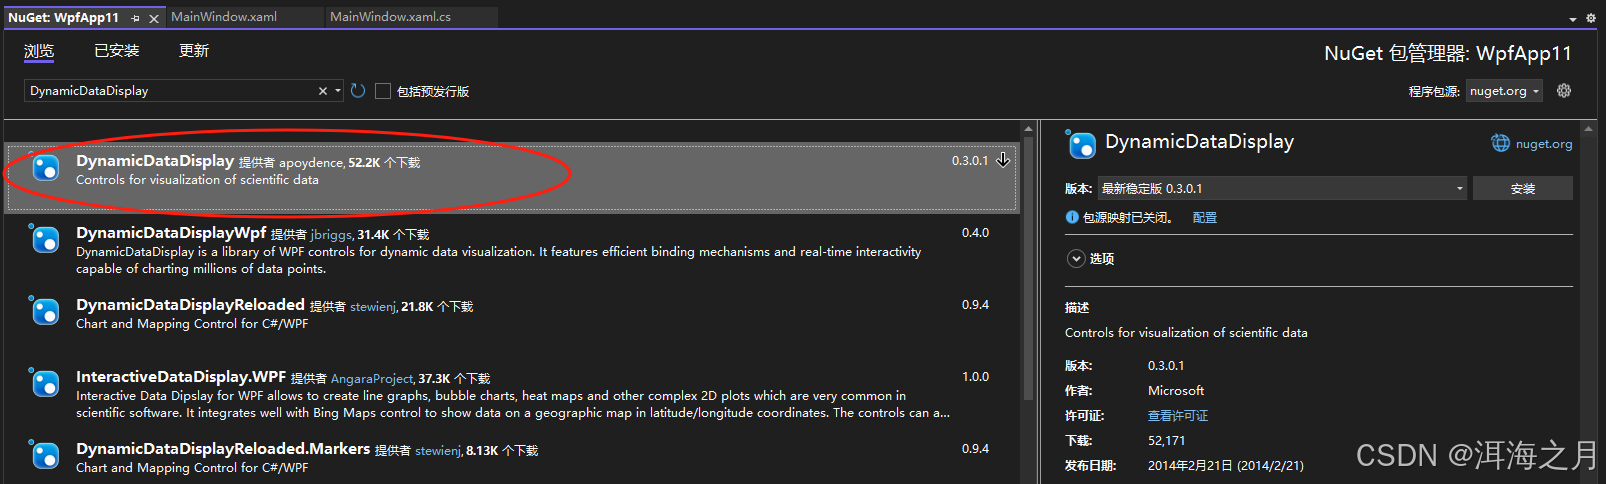
2.在nuget中添加 dynamicdatadisplay 项目支持
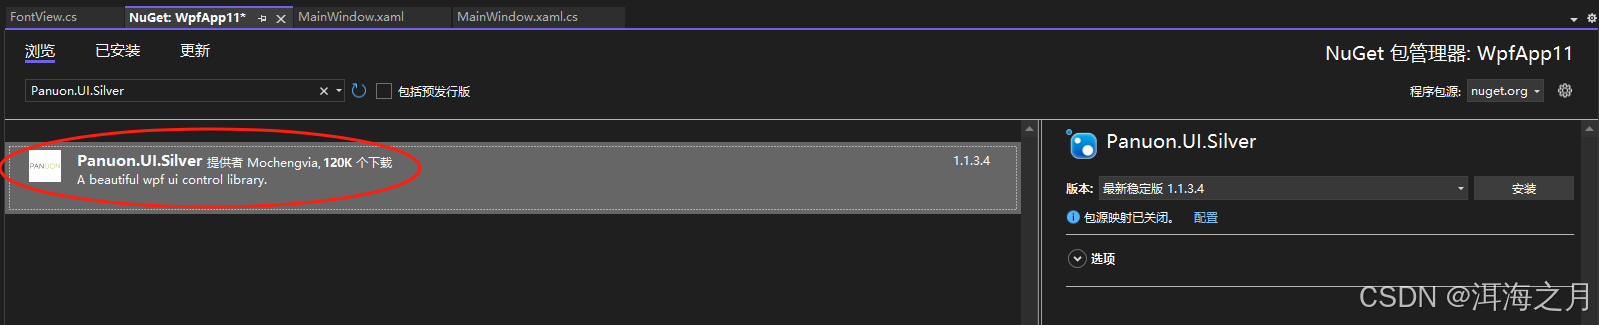
为了展示我们的ui界面,我们还添加了一个第三方的样式框架 panuon.ui.silver
3.我们在mainwindow.xaml文件中添加如下代码
<d3:chartplotter x:name="plotter">
            <d3:header x:name="headertitle" visibility="visible" content="这是曲线的标题" fontsize="14" horizontalalignment="center" />
            <d3:verticalaxistitle content="value" fontsize="14" visibility="collapsed"/>
            <d3:horizontalaxistitle content="时间" fontsize="14" visibility="collapsed"/>
        </d3:chartplotter>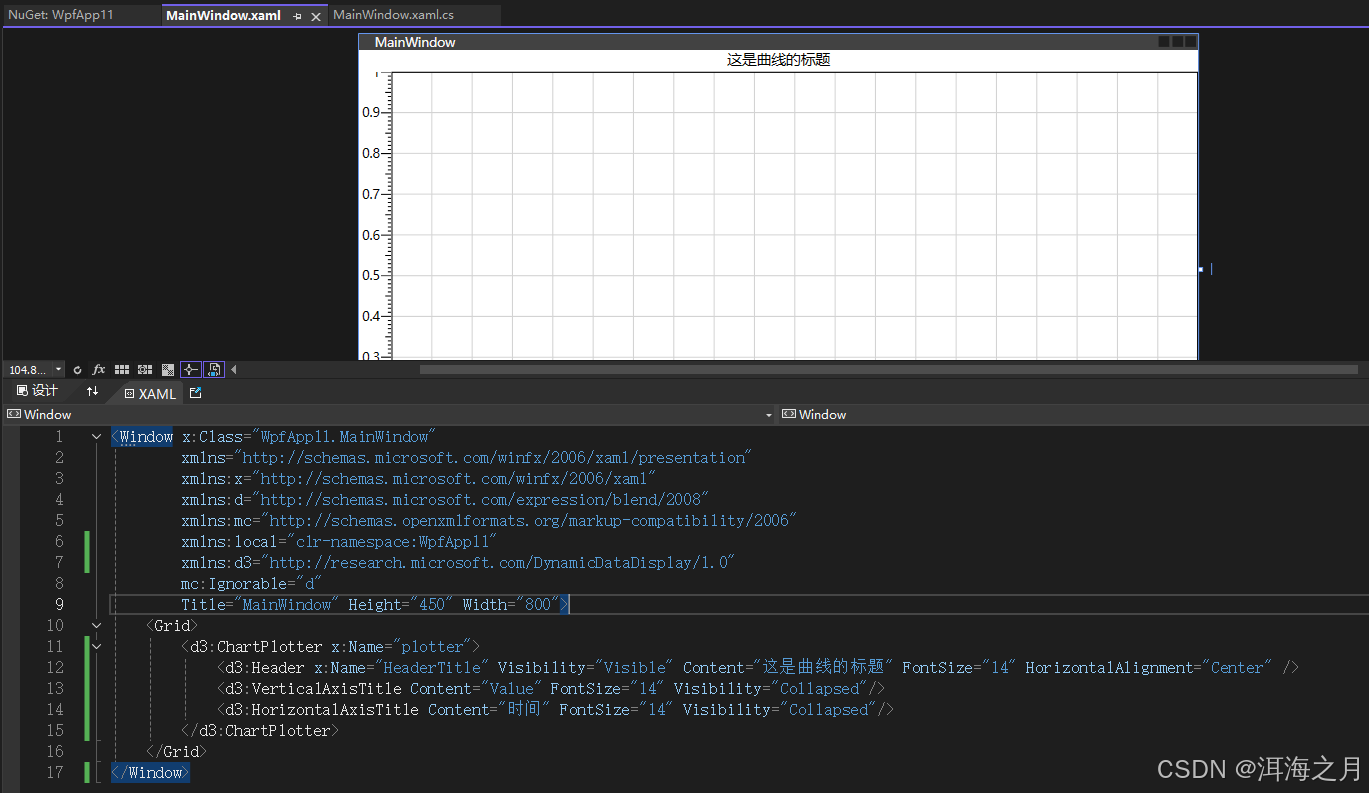
4.接下来我们就开始实现后台代码部分
mainwindow.xaml
<window x:class="wpfapp11.mainwindow"
        xmlns="http://schemas.microsoft.com/winfx/2006/xaml/presentation"
        xmlns:x="http://schemas.microsoft.com/winfx/2006/xaml"
        xmlns:pu="clr-namespace:panuon.ui.silver;assembly=panuon.ui.silver"
        xmlns:d="http://schemas.microsoft.com/expression/blend/2008"
        xmlns:mc="http://schemas.openxmlformats.org/markup-compatibility/2006"
        xmlns:local="clr-namespace:wpfapp11"
        xmlns:d3="http://research.microsoft.com/dynamicdatadisplay/1.0"
        mc:ignorable="d"
        title="mainwindow" height="450" width="800">
    <grid>

        <stackpanel panel.zindex="1" margin="50,40,0,0" horizontalalignment="left" verticalalignment="top" orientation="vertical">
            <checkbox x:name="xcheckbox" ischecked="true"
   pu:checkboxhelper.checkboxstyle="standard"
   pu:checkboxhelper.boxheight="20"
   pu:checkboxhelper.boxwidth="20"
   pu:checkboxhelper.cornerradius="15"
   pu:checkboxhelper.checkedbackground="{binding colorx}">
                <checkbox.content>
                    <dockpanel>
                        <textblock verticalalignment="center" fontsize="14" fontweight="bold" text="x:" foreground="{binding colorx}"/>
                        <textblock x:name="txtfhr1" text="{binding valuex}" fontsize="32" fontweight="bold" foreground="{binding colorx}"/>
                    </dockpanel>
                </checkbox.content>
            </checkbox>
            <checkbox x:name="ycheckbox" ischecked="true"
              pu:checkboxhelper.checkedbackground="{binding colory}" pu:checkboxhelper.checkboxstyle="standard" pu:checkboxhelper.boxheight="20" pu:checkboxhelper.boxwidth="20" pu:checkboxhelper.cornerradius="15">
                <checkbox.content>
                    <dockpanel>
                        <textblock verticalalignment="center" fontsize="14" fontweight="bold" text="y:" foreground="{binding colory}"/>
                        <textblock x:name="txtfhr2" text="{binding valuey}" fontsize="32" fontweight="bold" foreground="{binding colory}" />
                    </dockpanel>
                </checkbox.content>
            </checkbox>
            <checkbox x:name="zcheckbox" ischecked="true"
              pu:checkboxhelper.checkedbackground="{binding colorz}" pu:checkboxhelper.checkboxstyle="standard" pu:checkboxhelper.boxheight="20" pu:checkboxhelper.boxwidth="20" pu:checkboxhelper.cornerradius="15">
                <checkbox.content>
                    <dockpanel>
                        <textblock verticalalignment="center" fontsize="14" fontweight="bold" text="z:" foreground="{binding colorz}"/>
                        <textblock x:name="txtfhr3" text="{binding valuez}" fontsize="32" fontweight="bold" foreground="{binding colorz}"/>
                    </dockpanel>
                </checkbox.content>
            </checkbox>

            <textblock verticalalignment="center" fontsize="14" text="单位:1g≈9.80 m/s²" margin="0,10"/>
        </stackpanel>

        <d3:chartplotter x:name="plotter" mousemove="plotter_mousemove" panel.zindex="0">
            <d3:header x:name="headertitle" visibility="visible" content="这是曲线的标题" fontsize="14" horizontalalignment="center" />
            <d3:verticalaxistitle content="value" fontsize="14" visibility="collapsed"/>
            <d3:horizontalaxistitle content="时间" fontsize="14" visibility="collapsed"/>
        </d3:chartplotter>

    </grid>
</window>
mainwindow.cs
using microsoft.research.dynamicdatadisplay.datasources;
using microsoft.research.dynamicdatadisplay;
using system;
using system.windows;
using system.windows.controls;
using system.windows.media;
using system.windows.threading;
using microsoft.research.dynamicdatadisplay.charts;
using system.windows.input;
using panuon.ui.silver;

namespace wpfapp11
{
    /// <summary>
    /// mainwindow.xaml 的交互逻辑
    /// </summary>
    public partial class mainwindow : window
    {
        private readonly dispatchertimer dispatchertimer = new dispatchertimer();
        private readonly linegraph linegraphx = new linegraph();
        private readonly linegraph linegraphy = new linegraph();
        private readonly linegraph linegraphz = new linegraph();
        private readonly observabledatasource<point> xpoint = new observabledatasource<point>();
        private readonly observabledatasource<point> ypoint = new observabledatasource<point>();
        private readonly observabledatasource<point> zpoint = new observabledatasource<point>();
        private readonly fontview fontview = new fontview();
        public mainwindow()
        {
            initializecomponent();
            linegraphx = plotter.addlinegraph(xpoint, colors.red, 1.2, "x"); //#ffff0000
            linegraphy = plotter.addlinegraph(ypoint, colors.green, 1.2, "y"); //ff008000
            linegraphz = plotter.addlinegraph(zpoint, colors.blue, 1.2, "z");//ff0000ff //linelegenditem.xaml标签
            horizontaldatetimeaxis horizontalaxis = new horizontaldatetimeaxis();
            horizontalaxis.showminorticks = false;
            horizontalaxis.labelprovider = new datetimeaxiscontrol().labelprovider;
            horizontalaxis.isdefaultaxis = true;
            horizontalaxis.showmayorlabels = false;

            horizontalaxis.labelprovider.setcustomview((info, uielement) =>
            {
                (uielement as textblock).text = info.tick.tostring("hh:mm:ss"); //时间轴日期格式
            });
            plotter.contextmenu = populatecontextmenu(plotter);
            plotter.horizontalaxis.remove(); //去除默认
            plotter.children.add(horizontalaxis); //加入新的
            loaded += mainwindow_loaded;
            this.xcheckbox.datacontext = fontview;
            this.ycheckbox.datacontext = fontview;
            this.zcheckbox.datacontext = fontview;
            this.xcheckbox.checked += xcheckbox_checked;
            this.xcheckbox.unchecked += xcheckbox_checked;

            this.ycheckbox.checked += ycheckbox_checked;
            this.ycheckbox.unchecked += ycheckbox_checked;

            this.zcheckbox.checked += zcheckbox_checked;
            this.zcheckbox.unchecked += zcheckbox_checked;
        }
        #region checkedevent
        private void xcheckbox_checked(object sender, routedeventargs e)
        {
            checkbox checkbox = sender as checkbox;
            if (checkbox != null)
            {
                if ((bool)checkbox.ischecked)
                {
                    fontview.colorx = fontview.iscolorx;
                }
                else
                {
                    fontview.colorx = fontview.uncolor;
                }
            }


            if (linegraphx.visibility == visibility.hidden)
            {
                linegraphx.visibility = visibility.visible;
            }
            else
            {
                linegraphx.visibility = visibility.hidden;
            }

        }
        private void ycheckbox_checked(object sender, routedeventargs e)
        {
            checkbox checkbox = sender as checkbox;
            if (checkbox != null)
            {
                if ((bool)checkbox.ischecked)
                {
                    fontview.colory = fontview.iscolory;
                }
                else
                {
                    fontview.colory = fontview.uncolor;
                }
            }

            if (linegraphy.visibility == visibility.hidden)
            {
                linegraphy.visibility = visibility.visible;
            }
            else
            {
                linegraphy.visibility = visibility.hidden;
            }
        }
        private void zcheckbox_checked(object sender, routedeventargs e)
        {
            checkbox checkbox = sender as checkbox;
            if (checkbox != null)
            {
                if ((bool)checkbox.ischecked)
                {
                    fontview.colorz = fontview.iscolorz;
                }
                else
                {
                    fontview.colorz = fontview.uncolor;
                }
            }

            if (linegraphz.visibility == visibility.hidden)
            {
                linegraphz.visibility = visibility.visible;
            }
            else
            {
                linegraphz.visibility = visibility.hidden;
            }
        }
        #endregion
        /// <summary>
        /// 重写右键菜单
        /// </summary>
        /// <param name="plotter"></param>
        /// <returns></returns>
        /// <exception cref="notimplementedexception"></exception>
        private contextmenu populatecontextmenu(iinputelement target)
        {
            contextmenu result = new contextmenu();
            stateicon homeicon = new stateicon() { icon = (char)convert.toint32("f015", 16) + string.empty };
            stateicon saveicon = new stateicon() { icon = (char)convert.toint32("f2d2", 16) + string.empty };
            stateicon copyicon = new stateicon() { icon = (char)convert.toint32("f01a", 16) + string.empty };
            stateicon queryicon = new stateicon() { icon = (char)convert.toint32("f022", 16) + string.empty };
            stateicon logicon = new stateicon() { icon = (char)convert.toint32("f07c", 16) + string.empty };
            menuitem fittoviewmenuitem = new menuitem
            {
                header = "主图",
                tooltip = "初始化显示,显示主图中心位置",
                icon = homeicon,
                command = chartcommands.fittoview,
                commandtarget = target
            };

            menuitem savepicturemenuitem = new menuitem
            {
                header = "保存",
                tooltip = "保存曲线图",
                icon = saveicon,
                command = chartcommands.savescreenshot,
                commandtarget = target
            };

            menuitem copypicturemenuitem = new menuitem
            {
                header = "拷贝",
                tooltip = "拷贝,复制",
                icon = copyicon,
                command = chartcommands.copyscreenshot,
                commandtarget = target
            };
            result.items.add(fittoviewmenuitem);
            result.items.add(copypicturemenuitem);
            result.items.add(savepicturemenuitem);
            return result;
        }

        private void mainwindow_loaded(object sender, routedeventargs e)
        {
            dispatchertimer.interval = timespan.frommilliseconds(100);
            dispatchertimer.tick += (sender1, e1) => timer_tick(sender1, e1);
            dispatchertimer.isenabled = true;
        }

        /// <summary>
        /// 定时器刷新界面数据
        /// </summary>
        /// <param name="sender"></param>
        /// <param name="e"></param>
        private void timer_tick(object sender, eventargs e)
        {
            var axis = new horizontaldatetimeaxis();
            datetime datetime = datetime.now;
            random random = new random();
            double a, b, c;
            do
            {
                a = random.nextdouble() * 10;
                b = random.nextdouble() * 10;
                c = random.nextdouble() * 10;
            }
            while (a == b || b == c || a == c);

            point x = new point(axis.converttodouble(datetime), a);
            xpoint.appendasync(this.dispatcher, x);

            point y = new point(axis.converttodouble(datetime), b);
            ypoint.appendasync(this.dispatcher, y);

            point z = new point(axis.converttodouble(datetime), c);
            zpoint.appendasync(this.dispatcher, z);
        }

        /// <summary>
        /// 鼠标选中时,x轴和y轴的值
        /// </summary>
        /// <param name="sender"></param>
        /// <param name="e"></param>
        private void plotter_mousemove(object sender, mouseeventargs e)
        {
            try
            {
                datetime datetime = datetime.now;
                var axis = new horizontaldatetimeaxis();
                axis.converttodouble(datetime);

                chartplotter chart = sender as chartplotter;
                point point = e.getposition(this).screentodata(chart.transform);
                timespan ts = timespan.frommilliseconds(math.floor(point.x * 1000000));
                datetime formatteddate = datetime.minvalue.add(ts);
                this.headertitle.content = $"速度:{point.y.tostring("n5")} 时间:{formatteddate:hh:mm:ss,fff}";

                // 目标时间
                datetime targettime = formatteddate;
                //var select = this.data.orderby(v => math.abs((v.datetime - targettime).totalmilliseconds)).first();  // 获取与目标时间最接近的 entity

                // 显示选中 entity
                //this.selectedentity.content = select.tostring();
            }
            catch (exception)
            {

            }
        }
    }

}
fontview.cs
using system;
using system.collections.generic;
using system.componentmodel;
using system.linq;
using system.text;
using system.threading.tasks;

namespace wpfapp11
{
    internal class fontview : inotifypropertychanged
    {
        /// <summary>
        /// 曲线颜色
        /// </summary>
        public string uncolor => "#dcdcdc";
        public string iscolorx => "#ffff0000"; //"#009c26";
        public string iscolory => "#ff008000"; //"#8080c0";
        public string iscolorz => "#ff0000ff"; //"#000000";
        public fontview()
        {
            _colorx = this.iscolorx;
            _colory = this.iscolory;
            _colorz = this.iscolorz;
        }
        private string _colorx = string.empty;
        private string _colory = string.empty;
        private string _colorz = string.empty;
        public string colorx
        {
            get { return this._colorx; }
            set
            {
                if (this._colorx != value)
                {
                    this._colorx = value;
                    onpropertychanged(nameof(colorx));
                }
            }
        }

        public string colory
        {
            get { return this._colory; }
            set
            {
                if (this._colory != value)
                {
                    this._colory = value;
                    onpropertychanged(nameof(colory));
                }
            }
        }

        public string colorz
        {
            get { return this._colorz; }
            set
            {
                if (this._colorz != value)
                {
                    this._colorz = value;
                    onpropertychanged(nameof(colorz));
                }
            }
        }

        private string x = "0.000";
        private string y = "0.000";
        private string z = "0.000";
        public string valuex
        {
            get { return this.x; }
            set
            {
                if (this.x != value)
                {
                    this.x = value;
                    onpropertychanged(nameof(valuex));
                }
            }
        }
        public string valuey
        {
            get { return this.y; }
            set
            {
                if (this.y != value)
                {
                    this.y = value;
                    onpropertychanged(nameof(valuey));
                }
            }
        }
        public string valuez
        {
            get { return this.z; }
            set
            {
                if (this.z != value)
                {
                    this.z = value;
                    onpropertychanged(nameof(valuez));
                }
            }
        }


        private string node = "000000";
        private string time = "00:00:00,000";
        public string node
        {
            get { return this.node; }
            set
            {
                if (this.node != value)
                {
                    this.node = value;
                    onpropertychanged(nameof(node));
                }
            }
        }

        public string time
        {
            get { return this.time; }
            set
            {
                if (this.time != value)
                {
                    this.time = value;
                    onpropertychanged(nameof(time));
                }
            }
        }


        public event propertychangedeventhandler propertychanged;
        protected virtual void onpropertychanged(string propertyname)
        {
            propertychanged?.invoke(this, new propertychangedeventargs(propertyname));
        }
    }
}
到此这篇关于wpf实现曲线数据展示的文章就介绍到这了,更多相关wpf曲线数据展示内容请搜索代码网以前的文章或继续浏览下面的相关文章希望大家以后多多支持代码网!


发表评论