引言
在数据处理和分析工作中,excel作为一个广泛使用的工具,提供了强大的功能来管理和解析数据。当面对大量复杂的数据集时,为了更高效地总结、分析和展示数据,创建数据透视表成为一种不可或缺的方法。通过使用python这样的编程语言与excel工作表结合,我们能够自动化数据透视表的生成过程,不仅节省了时间,还能确保每次操作的一致性和准确性。本文将介绍如何使用python在excel工作表中创建数据透视表。
本文所使用的方法需要用到的spire.xls for python,pypi:pip install spire.xls。
用python在excel工作表中创建数据透视表
在excel工作表汇总创建数据透视表时,我们需要先用指定的单元格范围通过workbook.pivotcaches.add(cellrange)方法创建一个xlspivotcache对象,然后再使用worksheet.pivottables.add(name: string, location: cellrange, xlspivotcache)基于xlspivotcache对象创建数据透视表。创建好之后,还需要对数据透视表的行字段、列字段、值字段等进行设置,最后制作成一个完善的数据透视表。以下是操作步骤示例:
- 导入所需的类
workbook,axistypes,pivotbuiltinstyles,subtotaltypes, 和pivotautofomattypes。 - 创建
workbook类的实例。 - 使用
workbook.loadfromfile方法载入指定路径的现有excel文件到工作簿实例中。 - 使用
workbook.worksheets.get_item方法获取工作簿中的一个工作表。 - 定义数据源范围:通过
worksheet.range.get_item方法选取单元格区域。 - 使用
workbook.pivotcaches.add方法添加数据源范围到工作簿的缓存中创建一个xlspivotcache对象。 - 在当前工作表中定义位置并使用
worksheet.pivottables.add方法以及之前创建的xlspivotcache对象创建一个数据透视表。数据透视表可创建在其他工作表中。 - 为数据透视表添加行字段,通过
xlspivottable.pivotfields.get_item方法选择对应的列,并设置其轴类型为行。 - 添加列字段,同样通过
xlspivottable.pivotfields.get_item方法选择列,并设置其轴类型为列。 - 添加值字段,选择需要求和的数据列,并通过
xlspivottable.datafields.add方法添加到数据透视表中。 - 使用
xlspivotcache.calculatedata()方法更新数据透视表值。 - 使用
xlspivottable.builtinstyle属性应用内置样式。 - 使用
xlspivottable.autoformattype属性设置数据透视表的自动格式类型。 - 使用
workbook.savetofile方法保存修改后的工作簿到指定路径。 - 释放资源。
代码示例
from spire.xls import workbook, axistypes, pivotbuiltinstyles, subtotaltypes, pivotautofomattypes

# 创建workbook实例
workbook = workbook()

# 载入excel文件
workbook.loadfromfile("sample.xlsx")

# 获取第一个工作表
sheet = workbook.worksheets.get_item(0)

# 获取数据源单元格范围
datarange = sheet.range.get_item("a1:e143")

# 用数据源创建xlspivotcache对象
pivotcache = workbook.pivotcaches.add(datarange)

# 使用xlspivotcache对象在当前工作表中创建数据透视表
pivottable = sheet.pivottables.add("销售分析", sheet.range.get_item("g2"), pivotcache)

# 使用xlspivotcache对象在新的工作表中创建数据透视表
#sheet2 = workbook.worksheets.add("销售分析")
#pivottable2 = sheet.pivottables.add("销售分析", sheet.range.get_item("a1"), pivotcache)

# 添加行字段
rowfield1 = pivottable.pivotfields.get_item(sheet.range.get_item("c1").value)
rowfield1.axis = axistypes.row
rowfield2 = pivottable.pivotfields.get_item(sheet.range.get_item("d1").value)
rowfield2.axis = axistypes.row

# 添加列字段
columnfield1 = pivottable.pivotfields.get_item(sheet.range.get_item("b1").value)
columnfield1.axis = axistypes.column

# 添加值字段
datafield1 = pivottable.pivotfields.get_item(sheet.range.get_item("e1").value)
pivottable.datafields.add(datafield1, "求和项:" + sheet.range.get_item("e1").value, subtotaltypes.sum)

# 计算值
pivottable.calculatedata()

# 设置数据透视表样式
pivottable.builtinstyle = pivotbuiltinstyles.pivotstylelight2

# 设置数据透视表自动格式
pivottable.autoformattype = pivotautofomattypes.table2

# 保存工作簿
workbook.savetofile("output/excel数据透视表.xlsx")
workbook.dispose()
结果
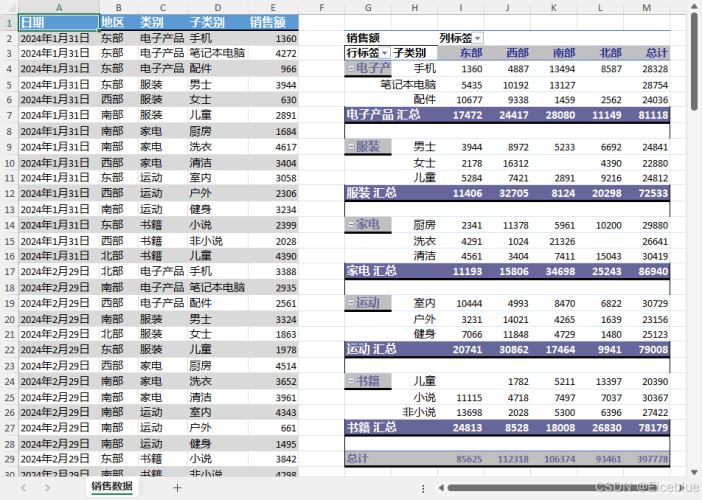
本文演示如何使用python在excel工作表中创建数据透视表,提供操作详解以及代码示例。
到此这篇关于使用python在excel工作表中创建数据透视表的方法的文章就介绍到这了,更多相关python excel数据透视表内容请搜索代码网以前的文章或继续浏览下面的相关文章希望大家以后多多支持代码网!


发表评论