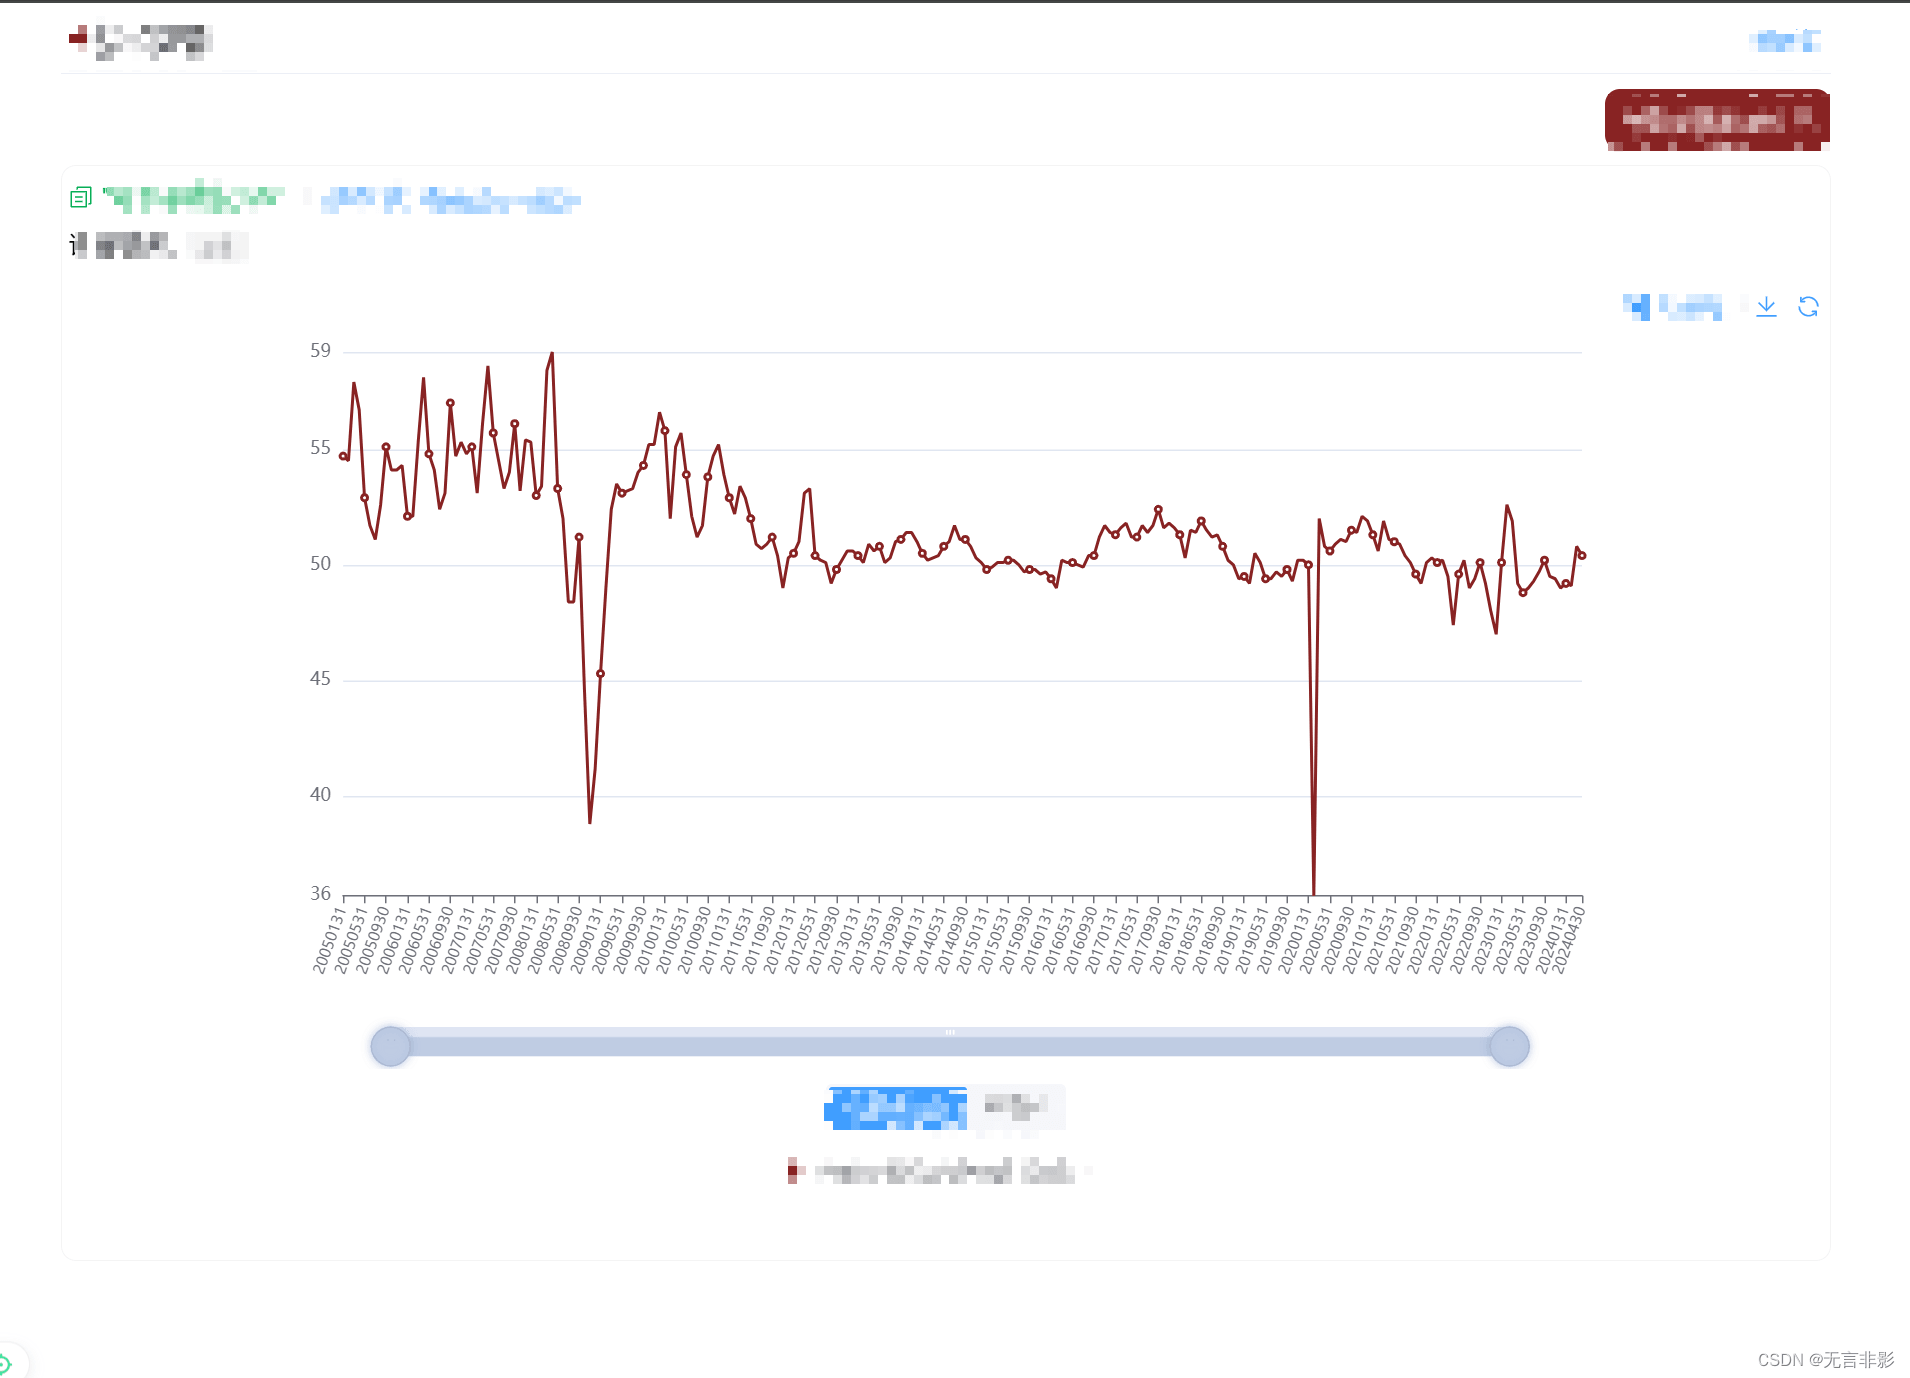
电脑端
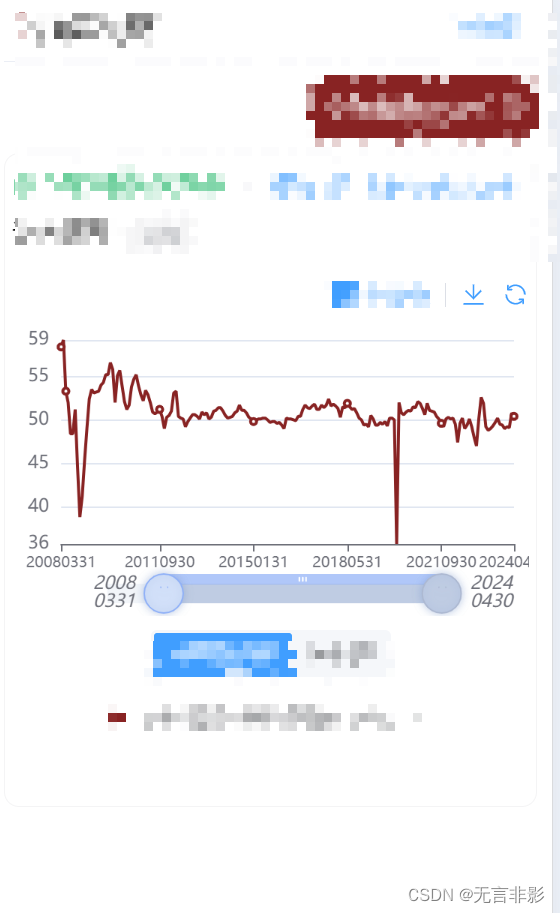
移动端
代码片段
    datazoom: [
      {
        type: 'inside',
        start: 0,
        end: 100
      },
      {
        type: 'slider',
        backgroundcolor: '#f2f5f9',
        fillercolor: '#bfcce3',
        height: 13, // 设置slider的高度为15
        start: 0,
        end: 100,
        right: 60,
        left: 60,
        bottom: 15,
        handleicon:
          'path://m30.9,53.2c16.8,53.2,5.3,41.7,5.3,27.6s16.8,2,30.9,2c45,2,56.4,13.5,56.4,27.6s45,53.2,30.9,53.2z m30.9,3.5m36.9,35.8h-1.3z m27.8,35.8 h-1.3h27l27.8,35.8l27.8,35.8z', // 使用类似 axispointer 的图标
        handlesize: '200%', // 放大按钮
        bordercolor: 'none',
        handlestyle: {
          color: '#bfcce3',
          shadowblur: 6,
          shadowcolor: 'rgba(123, 154, 204, 0.5)',
          shadowoffsetx: 0, // 阴影偏移x轴多少
          shadowoffsety: 0 // 阴影偏移y轴多少
        },
        // 显示的label的格式化器
        // 20050101 变为 2005\n0101
        labelformatter: function (index, value) {
          const year = value.slice(0, 4);
          const date = value.slice(4);
          return year + '\n' + date;
        },
        textstyle: {
          fontstyle: 'italic' // 设置字体倾斜
        },
        showdatashadow: false // 隐藏数据阴影
      }
    ]
思路:
- showdatashadow: false // 隐藏数据阴影
是把数据预览去掉 - 移动端不太方便,所以把按钮进行了修改方便用户拖拽。
        handleicon:
          'path://m30.9,53.2c16.8,53.2,5.3,41.7,5.3,27.6s16.8,2,30.9,2c45,2,56.4,13.5,56.4,27.6s45,53.2,30.9,53.2z m30.9,3.5m36.9,35.8h-1.3z m27.8,35.8 h-1.3h27l27.8,35.8l27.8,35.8z', // 使用类似 axispointer 的图标
        handlesize: '200%', // 放大按钮
        bordercolor: 'none',
        handlestyle: {
          color: '#bfcce3',
          shadowblur: 6,
          shadowcolor: 'rgba(123, 154, 204, 0.5)',
          shadowoffsetx: 0, // 阴影偏移x轴多少
          shadowoffsety: 0 // 阴影偏移y轴多少
        },
- 因为 日期格式是 yyyymmdd, 手机上显示太长了,这里做了换行处理。
        // 显示的label的格式化器
        // 20050101 变为 2005\n0101
        labelformatter: function (index, value) {
          const year = value.slice(0, 4);
          const date = value.slice(4);
          return year + '\n' + date;
        },
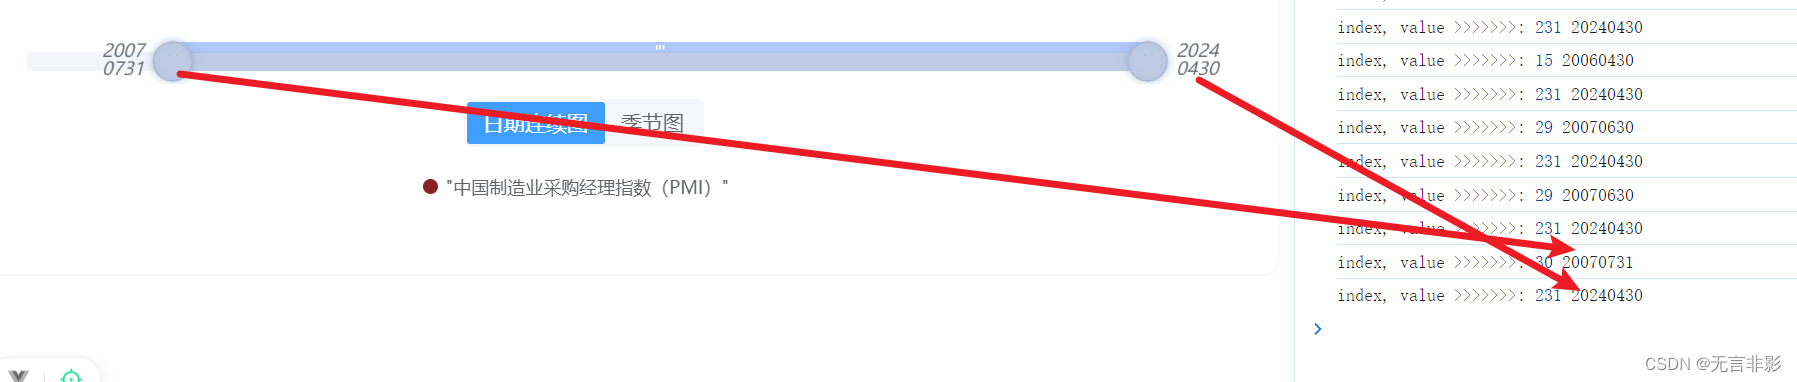
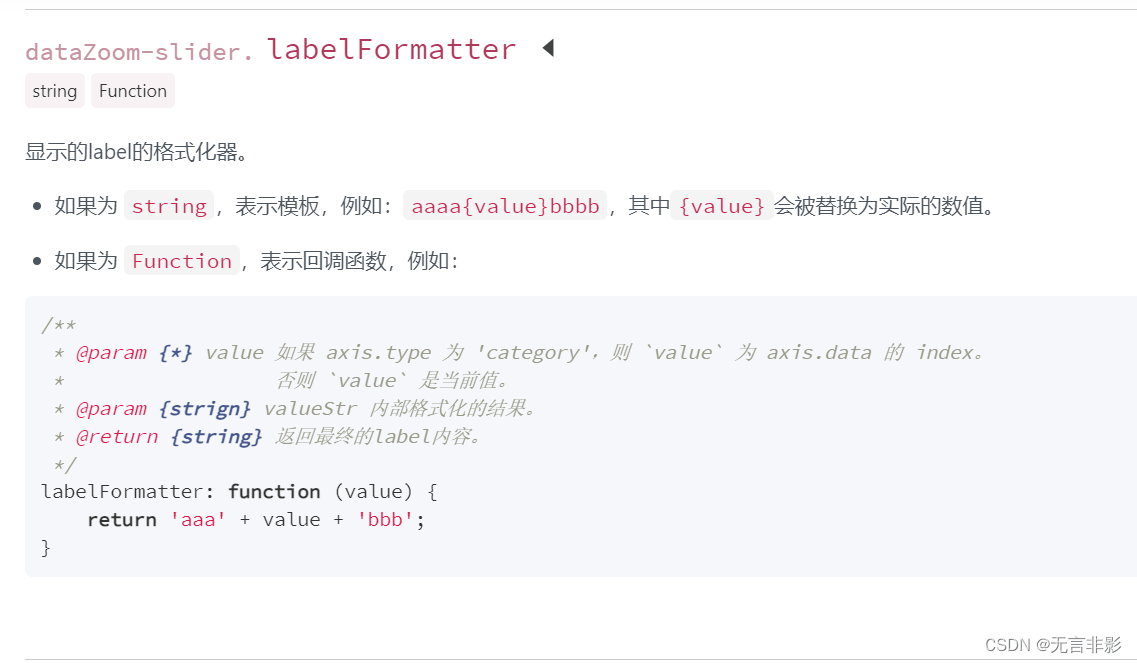
这里有个坑:labelformatter
labelformatter官网说,value在type 为 'category’的时候,是索引值。
但我实际看到的效果不是。
比如我有7000个数据点,每次拖拽的时候,索引index只有200多个,导致我获取不到数据。
因为只想拖拽的时候,格式化显示的label,第二个参数就是当时显示的label,但是文档里没有标出来。
https://echarts.apache.org/zh/option.html#datazoom-slider.labelformatter
总结
到此这篇关于echarts拖拽滑块datazoom-slider自定义样式简单适配移动端的文章就介绍到这了,更多相关echarts拖拽滑块datazoom-slider适配移动端内容请搜索代码网以前的文章或继续浏览下面的相关文章希望大家以后多多支持代码网!


发表评论