前言
在很多的面向webgis的应用开发过程中,我们通常会将空间地理数据,比如shapefile等矢量数据或者tiff等栅格数据进行发布到gis服务器中。为了能直观的展示这些空间矢量数据或者栅格数据的空间范围及大致的数据边界,我们需要将服务化之后的数据进行缩略图的预览展示。如果大家熟悉geoserver或者arcgisserver的话,对这个需求一定不陌生。如果我们是自己发布的gis服务,怎么提供这种类似的空间数据的预览服务呢?在不引入其它的外部服务的情况下。这是个值得思考的问题。
本文即是在上述的需求场景下出现的。本文主要使用java语言,讲解如何使用geotools这个组件来进行空间shapefile数据转换成图片,从而实现服务缩略图的功能。文章通过实例的模式讲解预览图片的生成,对于在研究java的服务预览图片生成的同学和朋友有一定的参考价值。
一、关于geotools的图片生成
关于geotools这个使用java开发的地理开发组件,它提供了许多丰富的功能和生态来帮助我们实现图片的生成操作。关于geotools的整体架构和相关知识,我想在后面的章节中再慢慢介绍。今天先试用它的图形渲染功能来实现空间数据的可视化渲染。本节重点讲解geotools当中的gtrenderer功能。
1、关于gtrenderer
关于在geotools中使用图像渲染和生成的功能,我们会使用到gtrenderer这个组件。它在geotools的官网原文中的介绍如下:
gtrendererrenderer is the reason why you signed up for this whole geotools experience; you want to see a map.
gtrendereris actually an interface; currently there are two implementations:
2、关于 图像生成架构
为了实现空间对象的生成,我们来看下它的后台使用类的生成关系。这个图可以参考管网给出的一个类关系图。
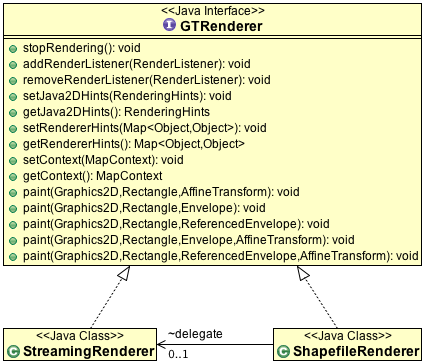
当然,上图中的相关接口和类中,尤其是在实现类中,实现类的方法和属性的定义是非常多的。但是在上图中做了一定的处理,没有展示那么多的方法。这里,我们会对streamingrenderer这个类比官网多一些的详细说明。 详细说明为什么使用流式计算,在实际的绘图过程中,有哪些方法是比较重要的
在面向对象的学习过程中,我们选择从接口或者抽象类,自顶向下的方式来研究相关的类。因此,在这里,我们首先对抽象的接口gtrenderer进行研究。gtrenderer的源码不多,主要定义的都是关于如何绘制的api,这里直接给出它的代码:
package org.geotools.renderer;
import java.awt.graphics2d;
import java.awt.rectangle;
import java.awt.renderinghints;
import java.awt.geom.affinetransform;
import java.util.map;
import org.geotools.geometry.jts.referencedenvelope;
import org.geotools.map.mapcontent;
import org.locationtech.jts.geom.envelope;
public interface gtrenderer {
    public void stoprendering();
    public void addrenderlistener(renderlistener listener);
    public void removerenderlistener(renderlistener listener);
    public void setjava2dhints(renderinghints hints);
    public renderinghints getjava2dhints();
    public void setrendererhints(map<?, ?> hints);
    public map<object, object> getrendererhints();
    public void setmapcontent(mapcontent mapcontent);
    public mapcontent getmapcontent();
    public void paint(graphics2d graphics, rectangle paintarea, affinetransform worldtoscreen);
    public void paint(graphics2d graphics, rectangle paintarea, envelope maparea);
    public void paint(graphics2d graphics, rectangle paintarea, referencedenvelope maparea);
    public void paint( graphics2d graphics,rectangle paintarea,envelope maparea,affinetransform worldtoscreen);
    public void paint(graphics2d graphics, rectangle paintarea,referencedenvelope maparea,affinetransform worldtoscreen);
}
在上面的方法中,我已经把相关的注释全部删除,在这个渲染接口中其实比较重要的方法其实就那么几个,第一是设置renderinghints,第二是设置mapcontent对象,第三就是执行具体的绘制,即上面代码中的paint方法,在上面的代码中,一共提供了5个重载的方法,在实际使用的时候,大家根据自己的需要来进行灵活的选择。
3、流式计算绘制
在定义了图片绘制的接口之后,最重要的是要实现图片的写入,这里需要来看一下gtrenderer对象的子类,即:
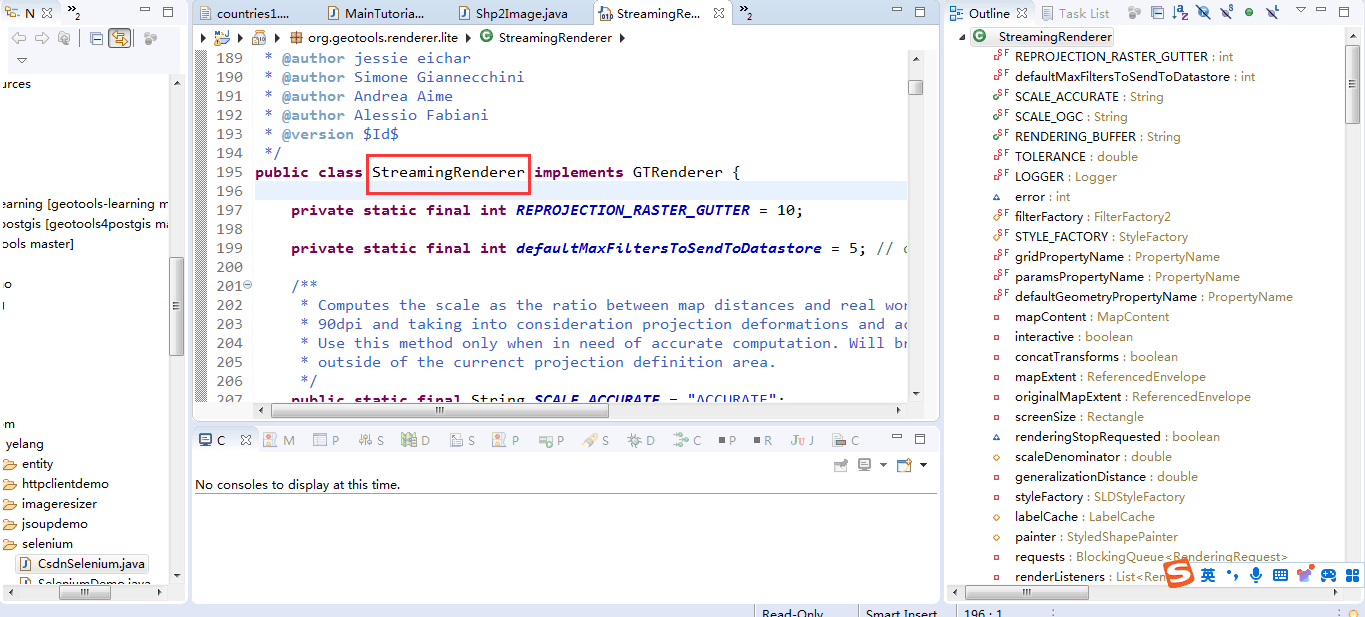
可以看到在streamingrenderer中定义了非常多的属性以及方法来支撑图片的绘制。 接下来我们看下绘制的相关类,为什么渲染的速度这么快。
 /** the thread pool used to submit the painter workers. */
private executorservice threadpool;
private painterthread painterthread;
在代码中可以看到以上代码片段,在进行绘制的时候,内部会使用线程池的方式来实现,所以这也是为什么处理效率比较高效的原因。
executorservice localthreadpool = threadpool;
boolean localpool = false;
if (localthreadpool == null) {
     localthreadpool = executors.newsinglethreadexecutor();
     localpool = true;
}
future painterfuture = localthreadpool.submit(painterthread);
list<compositinggroup> compositinggroups = null;
从这个代码可以看出,这里的处理线程池,我们可以在外部传入一个指定的线程池来进行任务的处理。如果外部没有传入线程池,在内部也会创建出一个线程对象来,这样就保证了一定会有一个线程池来进行处理。可以看到,这里的线程池采用的是future的方式,与我们常见的thread的方式有所区别,请大家注意。
下面给出一个官网提供的将shp文件写出到图片文件的java实例代码。
public void saveimage(final mapcontent map, final string file, final int imagewidth) {
    gtrenderer renderer = new streamingrenderer();
    renderer.setmapcontent(map);
    rectangle imagebounds = null;
    referencedenvelope mapbounds = null;
    try {
        mapbounds = map.getmaxbounds();
        double heighttowidth = mapbounds.getspan(1) / mapbounds.getspan(0);
        imagebounds = new rectangle(
                0, 0, imagewidth, (int) math.round(imagewidth * heighttowidth));
    } catch (exception e) {
        // failed to access map layers
        throw new runtimeexception(e);
    }
    bufferedimage image = new bufferedimage(imagebounds.width, imagebounds.height, bufferedimage.type_int_rgb);
    graphics2d gr = image.creategraphics();
    gr.setpaint(color.white);
    gr.fill(imagebounds);
    try {
        renderer.paint(gr, imagebounds, mapbounds);
        file filetosave = new file(file);
        imageio.write(image, "jpeg", filetosave);
    } catch (ioexception e) {
        throw new runtimeexception(e);
    }
}
二、全球空间预览生成实战
在之前的博文中,我们讲解了如何使用geotools来进行shapefile的空间数据的生成。这里还是以全球的矢量数据为例,结合sld空间样式控制。我们使用geotools来生成一张图片,使用上面讲到的gtrenderer对象来实现图片缩略图的生成。
1、pom.xml中关于图像生成依赖
要想实现在geotools中进行图像生成,需要引入相关的依赖包。这里给出依赖的maven配置,请注意,这是基本的pom.xml,其它的geotools的依赖,请自行引入。
<dependency>
	<groupid>org.geotools</groupid>
	<artifactid>gt-referencing</artifactid>
	<version>${geotools.version}</version>
</dependency>
<dependency>
	<groupid>org.geotools</groupid>
	<artifactid>gt-epsg-hsql</artifactid>
	<version>${geotools.version}</version>
</dependency>
<dependency>
	<groupid>org.geotools</groupid>
	<artifactid>gt-epsg-extension</artifactid>
	<version>${geotools.version}</version>
</dependency>
2、样式设置及地图资源绑定
为了让地图更好看,需要我们对地图进行样式的设置,关于sld的解析和使用,我们不再赘述,直接提供代码。大家可以直接拷贝过去使用。
private style createstylefromsld(string uri)
			throws xpathexpressionexception, ioexception, saxexception, parserconfigurationexception {
		documentbuilderfactory dbf = documentbuilderfactory.newinstance();
		documentbuilder db = dbf.newdocumentbuilder();
		document xmldocument = db.parse(uri);
		xpath xpath = xpathfactory.newinstance().newxpath();
		string version = xpath.compile("/styledlayerdescriptor/@version").evaluate(xmldocument);
		configuration sldconf;
		if (version != null && version.startswith("1.1")) {
			sldconf = new org.geotools.sld.v1_1.sldconfiguration();
		} else {
			sldconf = new org.geotools.sld.sldconfiguration();
		}
		styledlayerdescriptor sld = (styledlayerdescriptor) new org.geotools.xsd.domparser(sldconf, xmldocument)
				.parse();
		namedlayer l = (namedlayer) sld.getstyledlayers()[0];
		style style = l.getstyles()[0];
		return style;
}
加载样式之后,还需要将地图的样式和地图进行绑定。如下面的代码所示:
/**
* 添加shp文件
*
* @param shppath
*/
@suppresswarnings("deprecation")
public void addshapelayer(string shppath, string sldpath) {
	try {
		file file = new file(shppath);
		shapefiledatastore shpdatastore = null;
		shpdatastore = new shapefiledatastore(file.tourl());
		// 设置编码
		charset charset = charset.forname("gbk");
		shpdatastore.setcharset(charset);
		string typename = shpdatastore.gettypenames()[0];
		simplefeaturesource featuresource = null;
		featuresource = shpdatastore.getfeaturesource(typename);
		// sld的方式
		style style = null;
		try {
			style = createstylefromsld(sldpath);
		} catch (exception e) {
		}
		layer layer = new featurelayer(featuresource, style);
		map.addlayer(layer);
	} catch (exception e) {
		e.printstacktrace();
	}
}
上面两个方法都比较简单,而且在之前的博客中也曾经讲过,实现map的读取和样式的绑定。在介绍了上面的两个方法之后,我们来讲述如何进行图片的生成。
3、图片生成绘制
在讲解图片的绘制时,有几个小小的知识点是需要讲述的。首先是参考坐标,我们在进行绘图时,需要获取系统的参考坐标,然后根据参考坐标,将需要绘制的地图范围进行设置,也就是相当于生成referencedenvelope。然后graphics这个java的2d图像生成对象将map对象绘制成图片,从而实现缩略图的生成功能。
/**
* 根据四至、长、宽获取地图内容,并生成图片
*
* @param paras
* @param imgpath
*/
public void getmapcontent(map<string, object> paras, string imgpath) {
	try {
		double[] bbox = (double[]) paras.get("bbox");
		double x1 = bbox[0], y1 = bbox[1], x2 = bbox[2], y2 = bbox[3];
		int width = (int) paras.get("width"), height = (int) paras.get("height");
		// 设置输出范围
		coordinatereferencesystem crs = defaultgeographiccrs.wgs84;
		// coordinatereferencesystem crs = crs.decode("epsg:4326");
		referencedenvelope maparea = new referencedenvelope(x1, x2, y1, y2, crs);
		// 初始化渲染器
		streamingrenderer sr = new streamingrenderer();
		sr.setmapcontent(map);
		// 初始化输出图像
		bufferedimage bi = new bufferedimage(width, height, bufferedimage.type_int_argb);
		graphics g = bi.getgraphics();
		((graphics2d) g).setrenderinghint(renderinghints.key_antialiasing, renderinghints.value_antialias_on);
		((graphics2d) g).setrenderinghint(renderinghints.key_text_antialiasing,
					renderinghints.value_text_antialias_on);
		rectangle rect = new rectangle(0, 0, width, height);
		// 绘制地图
		sr.paint((graphics2d) g, rect, maparea);
		// 将bufferedimage变量写入文件中。
		imageio.write(bi, "png", new file(imgpath));
	} catch (exception e) {
		e.printstacktrace();
	}
}
4、图片生成测试
下面我们进行实际的图片生成测试,测试的代码如下:
public static void main(string[] args) {
		long start = system.currenttimemillis();
		shp2image shp2img = new shp2image();
		string shppath = "f:/wzh_workspace_20210320/geotools-fx/src/main/resources/maps/countries.shp";
		string sldpath = "f:/wzh_workspace_20210320/geotools-fx/src/main/resources/maps/countries1.1.0-2.sld";
		string imgpath = "d:/countries0819-美国.png";
		map<string, object> paras = new hashmap<string, object>();
		double[] bbox_usa = new double[] { -145.40999, 9.93976, -65.062300,81.12722 };
		paras.put("bbox", bbox_usa);
		paras.put("width", 1020);
		paras.put("height", 800);
		shp2img.addshapelayer(shppath, sldpath);
		shp2img.getmapcontent(paras, imgpath);
		system.out.println("缩略图生成完成,共耗时" + (system.currenttimemillis() - start) + "ms");
}
以上就是完成将shp数据转为图片的生成代码,下面我们就可以运行相应的程序来进行调用测试。请注意,这里的bbox是想要生成的区域的空间区域的bbox,也就是最大矩形外包框的坐标位置。还有需要生成图片的高度和宽度,在指定好这些参数之后就可以调用相应的应用程序来生成。
三、成果验证
下面来进行成果的验证,我们分别定义了以下的城市,首先是全世界的地图范围图片生成,然后是中国图片生成、日本及美国的地图范围生成。当然每个不同的城市的bbox是不一样的,还要传入不同的bbox值进行验证。
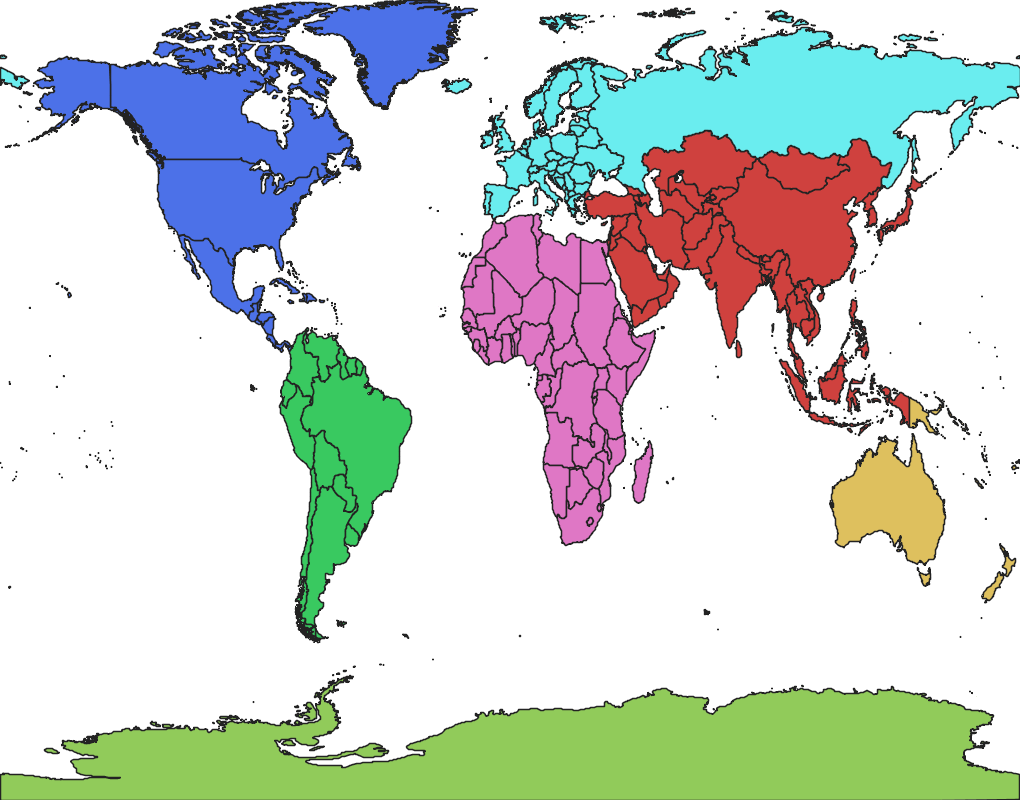
1、全球范围生成
全球的bbox范围值如下:
double[] bbox = new double[]
{-179.9999999999999716,-90.0000000188696276,180.0000000000000000,83.6274185352932022};
接下来看一下全球的生成视图:
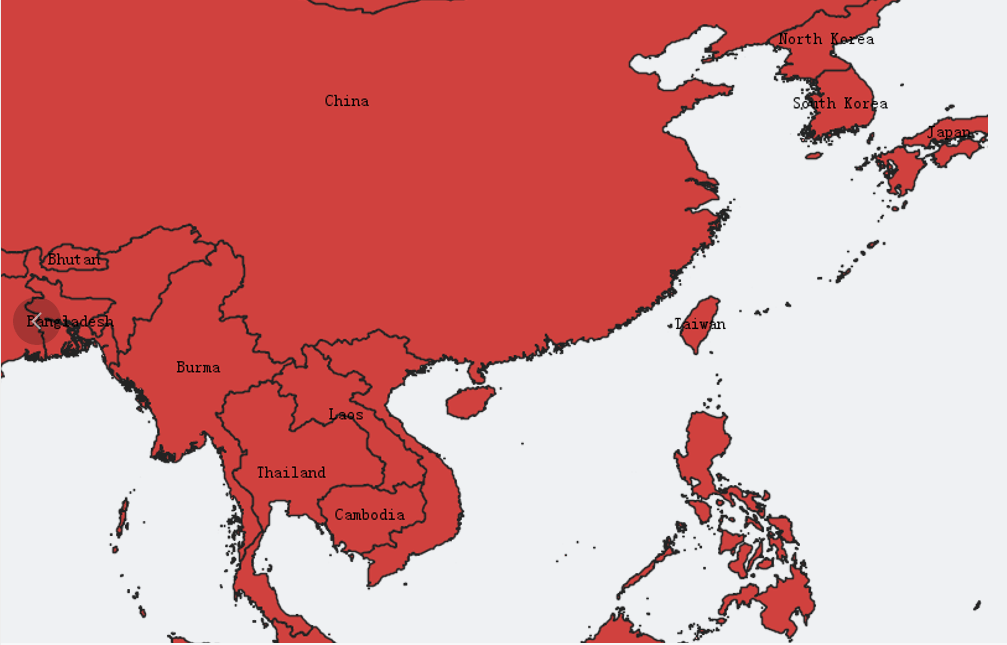
2、我国的范围示意图
我国的经纬度位置范围大致是:
double[] bbox_china = new double[] { 73.409999999999716, -3.5300000188696276, 135.0623000000000000,53.6274185352932022 };
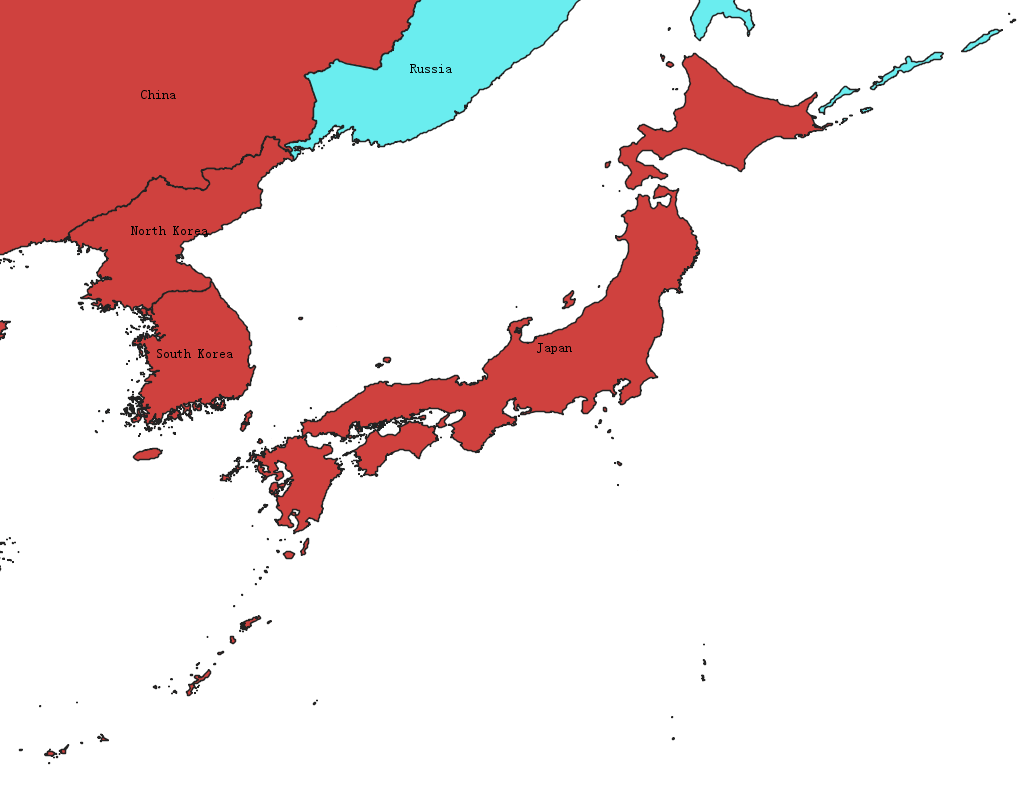
3、日本范围生成
日本的经纬度bbox范围如下:
double[] bbox_japan = new double[] { 122.409999999999716, 22.9300000188696276, 151.0623000000000000,47.1274185352932022 };
四、总结
以上就是本文的主要内容,本文主要使用java语言,讲解如何使用geotools这个组件来进行空间shapefile数据转换成图片,从而实现服务缩略图的功能。文章通过实例的模式讲解预览图片的生成,对于在研究java的服务预览图片生成的同学和朋友有一定的参考价值。 阅读本文,不仅可以学习到如何将shp数据转换成图片缩略图,还可以进一步复习geotools包的具体使用。当前,关于图像生成的很多资源不足或者介绍不够深入,这里将比较详细的解释相关知识,同时给出具体的实例。行文仓促,定有不当之处,恳请各位专家学者博友在评论区留下宝贵的意见,万分感激。
到此这篇关于基于java和geotools的shapefile矢量数据缩略图生成实践的文章就介绍到这了,更多相关java和geotools的shapefile矢量数据缩略图内容请搜索代码网以前的文章或继续浏览下面的相关文章希望大家以后多多支持代码网!


发表评论