引言
可视化数据已成为提高演示文稿专业度的关键因素之一。使用python从excel读取数据并在powerpoint幻灯片中创建图表不仅能够极大地简化图表创建过程,还能确保数据的准确性和图表的即时性。通过python这一桥梁,我们可以轻松实现数据自动化处理和图表生成,进而提升演示文稿的质量和效率。本文将演示如何使用python读取excel数据在ppt中创建图表,以及将excel图表以图片形式插入到幻灯片中。
本文所用的方法需要用到spire.presentation for python和spire.xls for python,pypi:pip install spire.presentation spire.xls。
读取excel数据在ppt中创建图表
我们可以通过读取excel工作表数据,然后在幻灯片中创建一个图表并将读取数据设置为图表的数据,最后进行纵横坐标设置,来实现读取excel数据在演示文稿中创建图表。
操作步骤示例:
- 导入所需模块。
- 创建
presentation实例,使用presentation.slidesize.type属性设置幻灯片大小。 - 创建
workbook实例,并使用workbook.loadfromfile()载入excel文件。 - 使用
islide.shapes.appendchart()方法在默认幻灯片中创建一个图表,并使用ichart.chartdata.clear(0, 0, 5, 5)方法清除图表的示例数据。 - 通过
worksheet.allocatedrange[].text读取表头和列头文本,并通过ichart.chartdata[].text属性将其设置为图表数据的表头和列头。 - 遍历工作表的数据行和数据列,使用
worksheet.allocatedrange[].numbervalue属性读取数据,并通过ichart.chartdata[].numbervalue将其设置为图表数据对应单元格的数据。 - 使用
ichart.charttitle下的属性设置图表标题。 - 使用
ichart.series.serieslabel和ichart.categories.categorylabels设置图表系列和类别对应的单元格范围。 - 使用
ichart.series.get_item().values设置系列对应的数据单元格范围。 - 使用
worksheet.allocatedrange[].numberformat属性读取excel数据单元格的数字格式,并通过ichart.primaryvalueaxis.numberformat将其设置为图表纵坐标的数字格式。 - 设置图表重叠和间隔宽度。
- 使用
presentation.savetofile()保存演示文稿。 - 释放资源。
代码示例
from spire.presentation import presentation, fileformat, slidesizetype, rectanglef, charttype, chartstyle, fillformattype
from spire.xls import workbook

# 创建presentation实例
presentation = presentation()

# 设置幻灯片尺寸
presentation.slidesize.type = slidesizetype.screen16x9

# 创建workbook实例
workbook = workbook()
# 加载excel文件
workbook.loadfromfile("示例.xlsx")

# 获取第一个工作表
sheet = workbook.worksheets.get_item(0)

# 向第一张幻灯片添加图表
rect = rectanglef.fromltrb(50, 100, presentation.slidesize.size.width - 50, presentation.slidesize.size.height - 50)
slide = presentation.slides.get_item(0)
chart = slide.shapes.appendchart(charttype.area, rect)

# 清除默认的虚拟数据
chart.chartdata.clear(0, 0, 5, 5)

# 将工作表的标题列和标题行复制到图表
for i in range(sheet.allocatedrange.columncount):
    chart.chartdata[0, i].text = sheet.allocatedrange[1, i + 1].text
for j in range(sheet.allocatedrange.rowcount - 1):
    chart.chartdata[j + 1, 0].text = sheet.allocatedrange.get_item(j + 2, 1).text

# 遍历数据行
for k in range(sheet.allocatedrange.rowcount - 1):
    # 遍历数据列
    for l in range(sheet.allocatedrange.columncount - 1):
        # 设置图表数据
        chart.chartdata[k + 1, l + 1].numbervalue = sheet.allocatedrange[k + 2, l + 2].numbervalue

# 设置图表标题
chart.charttitle.textproperties.text = sheet.name
chart.charttitle.textproperties.iscentered = true
chart.charttitle.height = 30
chart.hastitle = true

# 设置系列标签和类别标签
chart.series.serieslabel = chart.chartdata["b1", "c1"]
chart.categories.categorylabels = chart.chartdata["a2", "a" + str(sheet.allocatedrange.rowcount)]

# 设置系列值
chart.series.get_item(0).values = chart.chartdata["b2", "b" + str(sheet.allocatedrange.rowcount)]
chart.series.get_item(1).values = chart.chartdata["c2", "c" + str(sheet.allocatedrange.rowcount)]

# 设置数据轴的数字格式
chart.primaryvalueaxis.numberformat = sheet.allocatedrange[2, 2].numberformat

# 设置图表样式
chart.chartstyle = chartstyle.style5

# 设置重叠和间距宽度
chart.overlap = 50
chart.gapwidth = 200

# 保存演示文稿
presentation.savetofile("output/presentationchartfromexceldata.pptx", fileformat.pptx2019)
presentation.dispose()
workbook.dispose()
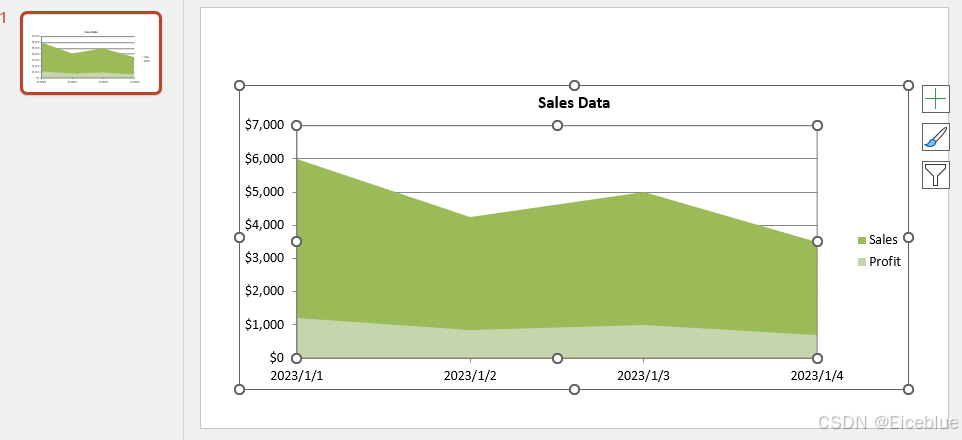
结果演示文稿
将excel图表以图片形式插入到幻灯片
如果想要将excel中已有的图表插入到powerpoint演示文稿,并在最大限度上保持原有格式和外观,可以通过将excel图表以图片形式插入幻灯片来实现。
操作示例:
- 导入所需模块。
- 创建
presentation实例,设置幻灯片大小。 - 创建
workbook实例,使用workbook.loadfromfile()载入excel文件。 - 使用
workbook.worksheets.get_item()方法获取第一个工作表。 - 使用
workbook.savechartasimage(worksheet, 0).toarray()方法将工作表中的第一个图表保存为数组,并转换为图片流。 - 使用
presentation.images.appendstream()方法将图片流作为图片数据嵌入到演示文稿中。 - 使用
islide.shapes.appendembedimagebyimagedata()方法将图片插入到幻灯片中。 - 使用
presentation.savetofile()方法保存演示文稿。 - 释放资源。
代码示例
from spire.presentation import presentation, fileformat, slidesizetype, rectanglef, shapetype, stream
from spire.xls import workbook

# 创建presentation实例
presentation = presentation()

# 设置幻灯片尺寸
presentation.slidesize.type = slidesizetype.screen16x9

# 创建workbook实例
workbook = workbook()
# 加载excel文件
workbook.loadfromfile("示例.xlsx")

# 获取第一个工作表
worksheet = workbook.worksheets.get_item(0)

# 将第一个工作表中的第一个图表保存为图像
imagestream = stream(workbook.savechartasimage(worksheet, 0).toarray())

# 将图像嵌入到演示文稿中
imagedata = presentation.images.appendstream(imagestream)

# 获取第一张幻灯片
slide = presentation.slides.get_item(0)

# 向幻灯片添加图像形状
rect = rectanglef.fromltrb(50, 100, presentation.slidesize.size.width - 50, presentation.slidesize.size.height - 50)
slide.shapes.appendembedimagebyimagedata(shapetype.rectangle, imagedata, rect)

# 保存演示文稿
presentation.savetofile("output/insertexcelcharttopresentation.pptx", fileformat.pptx2019)
presentation.dispose()
workbook.dispose()
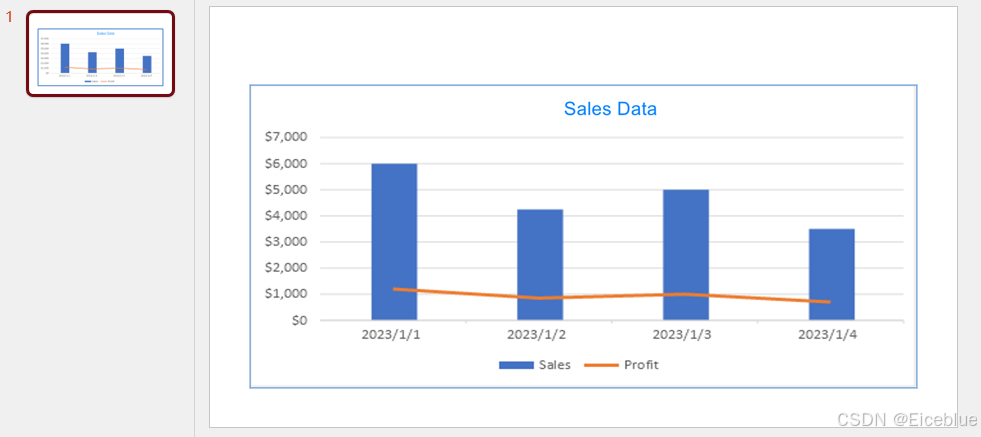
结果演示文稿
本文介绍了如何使用python读取excel数据在powerpoint演示文稿中创建图表,以及将excel图表以图片形式插入到幻灯片中。
以上就是使用python读取excel数据在ppt中创建图表的详细内容,更多关于python在ppt中创建图表的资料请关注代码网其它相关文章!


发表评论