实验记录,在做xx得分预测的实验中,做了一个基于python的3d聚类图,水平有限,仅供参考。
一、以实现三个类别聚类为例
代码:
import pandas as pd
import numpy as np
from sklearn.decomposition import pca
from sklearn.cluster import kmeans
from sklearn.preprocessing import standardscaler
from sklearn.impute import simpleimputer
import matplotlib.pyplot as plt
from mpl_toolkits.mplot3d import axes3d
# 读取数据
data = pd.read_csv('e:\\shujuji\\goods\\man.csv')
# 选择用于聚类的列
features = ['weight', 'bmi', 'lung capacity score', '50m running score',
            'standing long jump score', 'sitting forward bend score',
            '1000m running score', 'pulling up score', 'total score']
x = data[features]
# 处理缺失值
imputer = simpleimputer(strategy='mean')
x_imputed = imputer.fit_transform(x)
# 数据标准化
scaler = standardscaler()
x_scaled = scaler.fit_transform(x_imputed)
# 应用pca降维到3维
pca = pca(n_components=3)
x_pca = pca.fit_transform(x_scaled)
# 执行k-means聚类
# 假设我们想要3个聚类
kmeans = kmeans(n_clusters=9, random_state=0).fit(x_pca)
labels = kmeans.labels_
# 将聚类标签添加到原始dataframe中
data['cluster'] = labels
# 3d可视化聚类结果
fig = plt.figure(1, figsize=(8, 6))
ax = fig.add_subplot(111, projection='3d')
unique_labels = set(labels)
colors = ['r', 'g', 'b']
for k, c in zip(unique_labels, colors):
    class_member_mask = (labels == k)
    xy = x_pca[class_member_mask]
    ax.scatter(xy[:, 0], xy[:, 1], xy[:, 2], c=c, label=f'cluster {k}')
ax.set_title('pca of fitness data with k-means clustering')
ax.set_xlabel('principal component 1')
ax.set_ylabel('principal component 2')
ax.set_zlabel('principal component 3')
plt.legend()
plt.show()
# 打印每个聚类的名称和对应的数据点数量
cluster_centers = kmeans.cluster_centers_
for i in range(3):
    cluster_data = data[data['cluster'] == i]
    print(f"cluster {i}: count: {len(cluster_data)}")
# 评估聚类效果
from sklearn import metrics
print("silhouette coefficient: %0.3f" % metrics.silhouette_score(x_pca, labels))
实现效果:
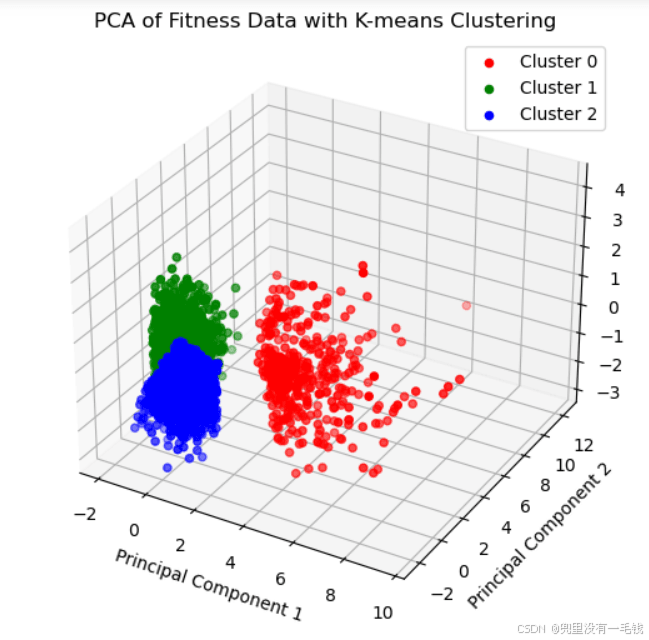
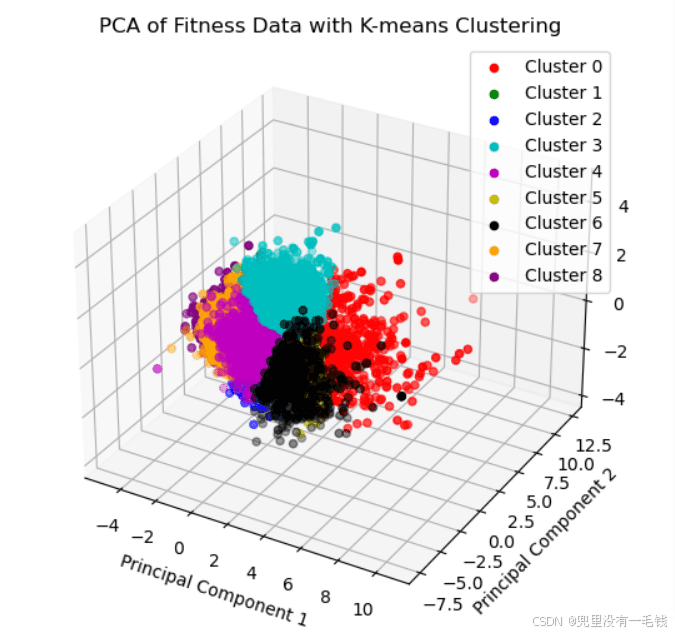
二、实现3个聚类以上,以9个类别聚类为例
import pandas as pd
import numpy as np
from sklearn.decomposition import pca
from sklearn.cluster import kmeans
from sklearn.preprocessing import standardscaler
from sklearn.impute import simpleimputer
import matplotlib.pyplot as plt
from mpl_toolkits.mplot3d import axes3d
# 读取数据
data = pd.read_csv('e:\\shujuji\\goods\\man.csv')
# 选择用于聚类的列
features = ['weight', 'bmi', 'lung capacity score', '50m running score',
            'standing long jump score', 'sitting forward bend score',
            '1000m running score', 'pulling up score', 'total score']
x = data[features]
# 处理缺失值
imputer = simpleimputer(strategy='mean')
x_imputed = imputer.fit_transform(x)
# 数据标准化
scaler = standardscaler()
x_scaled = scaler.fit_transform(x_imputed)
# 应用pca降维到3维
pca = pca(n_components=3)
x_pca = pca.fit_transform(x_scaled)
# 执行k-means聚类
# 假设我们想要9个聚类
kmeans = kmeans(n_clusters=9, random_state=0).fit(x_pca)
labels = kmeans.labels_
# 将聚类标签添加到原始dataframe中
data['cluster'] = labels
# 3d可视化聚类结果
fig = plt.figure(1, figsize=(8, 6))
ax = fig.add_subplot(111, projection='3d')
unique_labels = set(labels)
colors = ['r', 'g', 'b', 'c', 'm', 'y', 'k', 'orange', 'purple']
for k, c in zip(unique_labels, colors):
    class_member_mask = (labels == k)
    xy = x_pca[class_member_mask]
    ax.scatter(xy[:, 0], xy[:, 1], xy[:, 2], c=c, label=f'cluster {k}')
ax.set_title('pca of fitness data with k-means clustering')
ax.set_xlabel('principal component 1')
ax.set_ylabel('principal component 2')
ax.set_zlabel('principal component 3')
plt.legend()
plt.show()
# 打印每个聚类的名称和对应的数据点数量
cluster_centers = kmeans.cluster_centers_
for i in range(9):
    cluster_data = data[data['cluster'] == i]
    print(f"cluster {i}: count: {len(cluster_data)}")
# 评估聚类效果
from sklearn import metrics
print("silhouette coefficient: %0.3f" % metrics.silhouette_score(x_pca, labels))
实现效果;
到此这篇关于使用python实现3d聚类图的文章就介绍到这了,更多相关python 3d聚类图内容请搜索代码网以前的文章或继续浏览下面的相关文章希望大家以后多多支持代码网!


发表评论