系列文章目录
harmonyos next 系列之省市区弹窗选择器实现(一)
harmonyos next 系列之验证码输入组件实现(二)
harmonyos next 系列之底部标签栏tabbar实现(三)
harmonyos next 系列之http请求封装和token持久化存储(四)
harmonyos next 系列之从手机选择图片或拍照上传功能实现(五)
harmonyos next 系列之可移动悬浮按钮实现(六)
harmonyos next 系列之沉浸式状态实现的多种方式(七)
harmonyos next系列之echarts图表组件(折线图、柱状图、饼图等)实现(八)
文章目录
前言
harmonyos next(基于api11)实现echarts图表组件(折线图、柱状图、饼图等)。
echarts作为web端最流行开源的图表库,有着
多种图表类型,丰富的配置、强大的交互功能、可扩展性强等优点,如果能在鸿蒙上使用对于熟悉web开发同学将无缝衔接,大大减少开发和学习成本。

一、实现原理分析
二、代码实现
1.项目内新建本地html文件引入echarts.min.js
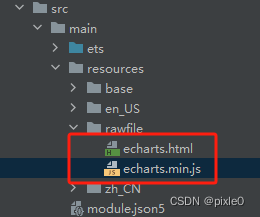
echarts.html:
<!doctype html>
<html>
<head>
    <meta charset="utf-8">
    <meta content="width=device-width, initial-scale=1.0, maximum-scale=1.0, user-scalable=0;" name="viewport"/>
    <script src="./echarts.min.js"></script>
    <style>
        *{
     padding:0;
     margin:0
    }
    body,html{
       height:100%;
       width:100%
    }
    #container{
       height:100%;
       width:100%
    }
    </style>
</head>
<body>
<div id="container"></div>
</body>
<script>
    const container = document.getelementbyid('container')
    let mychart = echarts.init(container);

    function setoption(option){
         mychart?.clear();
         mychart?.setoption(option)
    }

</script>
</html>
echarts.min.js:
说明:此步骤新建了一个html文件引入了echarts.min.js并初始化echarts,定义了一个
setoption方法,后续通过调用该方法传入配置就能渲染出图表
2.echart.ets组件封装
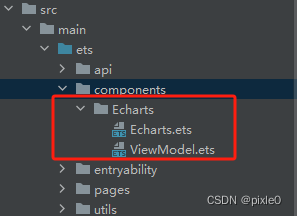
echarts.ets
import webview from '@ohos.web.webview'

@component
export default struct echarts {
  //控制器
  controller: webview.webviewcontroller = new webview.webviewcontroller();
  //组件宽
  @prop ewidth: string | number = '100%'
  //组件高,单位vp
  @prop eheight: string | number = 300
  //渲染完成回调
  rendercallback: (e: echarts) => void = () => {
  }

  //更新或渲染组件
  render(option: record<string, esobject> | string) {
    this.controller.runjavascript(`setoption(${typeof option === 'string' ? option : json.stringify(option)})`)
  }

  build() {
    column() {
      web({ src: $rawfile('echarts.html'), controller: this.controller })
        .width('100%')
        .height('100%')
        .onpageend(e => {
          this.rendercallback && this.rendercallback(this)
        })

    }
    .width(this.ewidth)
    .height(this.eheight)
  }
}
说明:
组件定义了长宽属性,默认宽度100%,高度300vp,
rendercallback回调函数作用把整个echarts组件实例暴露给引用页面。
render方法重新加载渲染组件,入参为图表配置,入参既可以是对象也可以是字符串,无论何种类型最终都将转换为字符串注入web执行。
在引用页面通过rendercallback暴露出去的实例调用render方法即可自由刷新图表数据
viewmodel.ets:
/**
 * echart配置数据类型定义
 */
export interface echartsoption {
  grid?: echartgrid,
  title?: echartstitle;
  tooltip?: echartstooltip;
  legend?: echartslegend;
  xaxis: echartsxaxis;
  yaxis: echartsyaxis;
  series: echartsseries[];
}

export  interface echartgrid {
  top?: number|string
  bottom?: number|string
  left?: number|string
  right?: number|string
}

export interface echartstitle {
  text?: string;
}

export interface echartstooltip {}

export interface echartslegend {
  show?:boolean
  data?: string[];
}


export interface echartsxaxis {
  type?: string;
  data: string[];
  axisline?: xaxisaxisline;
  axistick?: xaxisaxistick
  boundarygap?: boolean | array<string>
  axislabel?: axislabel

}

export interface xaxisaxisline {
  show?: boolean
}

export interface xaxisaxistick {
  show?: boolean
}


export interface echartsyaxis {
  type?: string
  splitline?: yaxissplitline
  splitnumber?: number
  min?: number
  max?: number
  scale?: boolean
  interval?: number

}

export interface axislabel {
  show?: boolean
  formatter?: string | ((value: number | string, index: number) => string)
}

export interface yaxissplitline {
  linestyle?: axissplitlinelinestyle
}

export interface axissplitlinelinestyle {
  type?: string
}

export interface echartsseries {
  name?: string;
  type?: string;
  data: number[];

}
viewmodel.ets里面定义了一些常见的图表配置数据结构(类型),方便在引入页中引入使用,可以按需继添加扩展
3.页面使用
index.ets
import echarts from '../components/echarts/echarts'
import { echartsoption } from '../components/echarts/viewmodel'

@entry
@component
struct index {
  //图表实例
  myechart: echarts | null = null
  /*
   * 图表配置
   */
  option: echartsoption = {
  //标题
    title: {
      text: '基础柱状图'
    },
    //图例
    legend: {
      data: ['访问量']
    },
    //x轴配置
    xaxis: {
      type: 'category',
      data: []
    },
    //y轴配置
    yaxis: {
      type: 'value'
    },
    //数据配置
    series: [
      {
        data: [],
        type: 'bar',//柱状图
        name: '访问量'
      }
    ]
  };

  abouttoappear(): void {
    this.getdata()
  }

  //接口请求获取数据
  getdata() {
    //模拟接口请求
    settimeout(() => {
      //设置x轴数据
      this.option.xaxis.data = ['mon', 'tue', 'wed', 'thu', 'fri', 'sat', 'sun']
      //设置y轴数据
      this.option.series[0].data = [120, 200, 150, 80, 70, 110, 130]
      //调用render重新渲染
      this.myechart?.render(this.option)
    }, 2000)
  }

  // 组件实例
  chart?: echarts;

  build() {
    column() {
      echarts({
        eheight: 300,
        //回调
        rendercallback: (e: echarts) => {
          this.myechart = e
          //初次渲染组件,接口获取数据是异步此时this.option可能还没有新数据
          this.myechart.render(this.option)
        }
      })
    }
    .width('100%')
    .height('100%')
  }
}
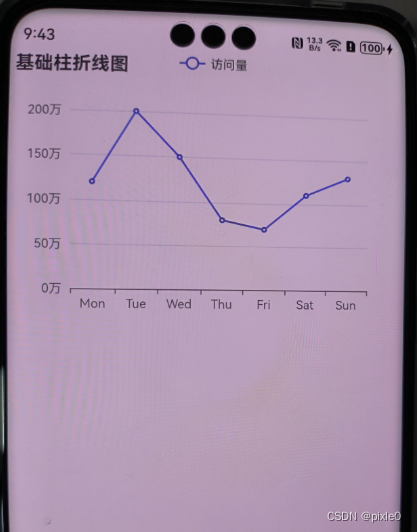
运行效果:

三、配置项含函数需特殊处理
对于配置项包含函数的情况,例如坐标轴标签设置axislabel.formatter字段可以是个函数类型,此时就需要特殊处理。这是因为当我们传递option为对象给render函数时候
this.controller.runjavascript(`setoption(${typeof option === 'string' ? option : json.stringify(option)})`)
此时调用json.stringify把对象转换为字符串,而json.stringify入参内函数会直接被去掉。
因此我们需要自己把option处理成字符串传入即可
代码示例:
给折线图y轴刻度值加个万字
index.ets
import echarts from '../components/echarts/echarts'

@entry
@component
struct index {
  //图表配置
  @state option: string = ``
  //x轴数据
  @state xaxisdata: string[] = [];
  //y轴数据
  @state seriesdata: number[] = [];
  myechart: echarts | null = null;

  abouttoappear(): void {
    this.getdata()
  }

  /*
   * 设置配置并重新渲染
   */
  setoption() {
    this.option = `{
    title: {
      text: '基础柱折线图'
    },
    grid:{
      left:"15%"
    },
    legend:{
      data: ['访问量']
    },
    xaxis: {
      type: 'category',
      data: ${json.stringify(this.xaxisdata)}
    },
    yaxis: {
      axislabel: {
        show: true,
        formatter:(value, index)=> {
            return value + '万';
        }
      }
    },
    series: [
      {
        data: ${json.stringify(this.seriesdata)},
        type: 'line',
        name:'访问量'
      }
    ]
  }`
    this.myechart?.render(this.option)
  }

  //接口请求获取数据
  getdata() {
    //模拟接口请求
    settimeout(() => {
      this.xaxisdata = ['mon', 'tue', 'wed', 'thu', 'fri', 'sat', 'sun']
      this.seriesdata = [120, 200, 150, 80, 70, 110, 130]
      this.setoption()
    }, 2000)
  }

  // 组件实例
  chart?: echarts;

  build() {
    column() {
        echarts({
          eheight: 300,
          rendercallback: (e: echarts) => {
            this.myechart = e
            this.setoption()
          }
        })

    }
    .width('100%')
    .height('100%')
  }
}
运行效果:


发表评论