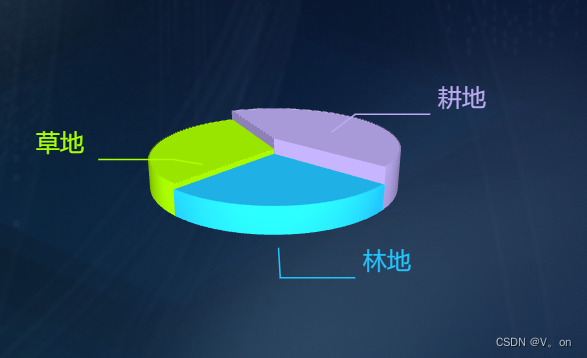
vue3之echarts3d环柱饼图
效果:
版本
"echarts": "^5.4.1", "echarts-gl": "^2.0.9"
核心代码:
<template>
    <div class="content">
        <div ref="echarts" class="chart"></div>
    </div>
</template>

<script setup>
import { onmounted, ref } from "vue";
import * as echarts from "echarts";
import "echarts-gl";

const echarts = ref(null);
let mychart = null;

let boxheight;
let optiondata = ref([
  {
    name: "林地",
    value: 5,
    itemstyle: {
      color: "#22c4ff",
    },
  },
  {
    name: "草地",
    value: 13,
    itemstyle: {
      color: "#aaff00",
    },
  },
  {
    name: "耕地",
    value: 38,
    itemstyle: {
      color: "#bbaaf1",
    },
  },
]);

const getparametricequation = (
  startratio,
  endratio,
  isselected,
  ishovered,
  k,
  h
) => {
  // 计算
  let midratio = (startratio + endratio) / 2;
  let startradian = startratio * math.pi * 2;
  let endradian = endratio * math.pi * 2;
  let midradian = midratio * math.pi * 2;
  // 如果只有一个扇形,则不实现选中效果。
  if (startratio === 0 && endratio === 1) {
    isselected = false;
  }
  // 通过扇形内径/外径的值,换算出辅助参数 k(默认值 1/3)
  k = typeof k !== "undefined" ? k : 1 / 3;
  // 计算选中效果分别在 x 轴、y 轴方向上的位移(未选中,则位移均为 0)
  let offsetx = isselected ? math.cos(midradian) * 0.1 : 0;
  let offsety = isselected ? math.sin(midradian) * 0.1 : 0;
  // 计算高亮效果的放大比例(未高亮,则比例为 1)
  let hoverrate = ishovered ? 1.05 : 1;
  // 返回曲面参数方程
  return {
    u: {
      min: -math.pi,
      max: math.pi * 3,
      step: math.pi / 32,
    },
    v: {
      min: 0,
      max: math.pi * 2,
      step: math.pi / 20,
    },
    x: function (u, v) {
      if (u < startradian) {
        return (
          offsetx + math.cos(startradian) * (1 + math.cos(v) * k) * hoverrate
        );
      }
      if (u > endradian) {
        return (
          offsetx + math.cos(endradian) * (1 + math.cos(v) * k) * hoverrate
        );
      }
      return offsetx + math.cos(u) * (1 + math.cos(v) * k) * hoverrate;
    },
    y: function (u, v) {
      if (u < startradian) {
        return (
          offsety + math.sin(startradian) * (1 + math.cos(v) * k) * hoverrate
        );
      }
      if (u > endradian) {
        return (
          offsety + math.sin(endradian) * (1 + math.cos(v) * k) * hoverrate
        );
      }
      return offsety + math.sin(u) * (1 + math.cos(v) * k) * hoverrate;
    },
    z: function (u, v) {
      if (u < -math.pi * 0.5) {
        return math.sin(u);
      }
      if (u > math.pi * 2.5) {
        return math.sin(u) * h * 0.1;
      }
      return math.sin(v) > 0 ? 1 * h * 0.1 : -1;
    },
  };
};

const getpie3d = (piedata, internaldiameterratio) => {
  // internaldiameterratio:透明的空心占比
  let series = [];
  let sumvalue = 0;
  let startvalue = 0;
  let endvalue = 0;

  let k = 1 - internaldiameterratio;
  piedata.sort((a, b) => {
    return b.value - a.value;
  });
  // 为每一个饼图数据,生成一个 series-surface 配置
  for (let i = 0; i < piedata.length; i++) {
    sumvalue += piedata[i].value;
    let seriesitem = {
      name:
        typeof piedata[i].name === "undefined" ? `series${i}` : piedata[i].name,
      type: "surface",
      parametric: true,
      wireframe: {
        show: false,
      },
      piedata: piedata[i],
      piestatus: {
        selected: false,
        hovered: false,
        k: k,
      },
      center: ["10%", "50%"],
    };

    if (typeof piedata[i].itemstyle != "undefined") {
      let itemstyle = {};
      typeof piedata[i].itemstyle.color != "undefined"
        ? (itemstyle.color = piedata[i].itemstyle.color)
        : null;
      typeof piedata[i].itemstyle.opacity != "undefined"
        ? (itemstyle.opacity = piedata[i].itemstyle.opacity)
        : null;
      seriesitem.itemstyle = itemstyle;
    }
    series.push(seriesitem);
  }

  // 使用上一次遍历时,计算出的数据和 sumvalue,调用 getparametricequation 函数,
  // 向每个 series-surface 传入不同的参数方程 series-surface.parametricequation,也就是实现每一个扇形。
  for (let i = 0; i < series.length; i++) {
    endvalue = startvalue + series[i].piedata.value;
    series[i].piedata.startratio = startvalue / sumvalue;
    series[i].piedata.endratio = endvalue / sumvalue;
    series[i].parametricequation = getparametricequation(
      series[i].piedata.startratio,
      series[i].piedata.endratio,
      false,
      false,
      k,
      series[i].piedata.value // 控制各模块高度一致100   控制各模块高度根据value改变
    );
    startvalue = endvalue;
  }
  boxheight = getheight3d(series, 26); //通过传参设定3d饼/环的高度,26代表26px
  return series;
};

const getheight3d = (series, height) => {
  series.sort((a, b) => {
    return b.piedata.value - a.piedata.value;
  });
  return (height * 25) / series[0].piedata.value;
};

const initcharts = () => {
  mychart = echarts.init(echarts.value);
  const series = getpie3d(optiondata.value, 0);
  series.push({
    name: "pie2d",
    type: "pie",
    label: {
      opacity: 1,
      fontsize: 28,
      lineheight: 20,
    },
    labelline: {
      length: 20,
      length2: 50,
    },
    startangle: -40, //起始角度,支持范围[0, 360]。
    clockwise: false, //饼图的扇区是否是顺时针排布。上述这两项配置主要是为了对齐3d的样式
    radius: ["50%", "32%"],
    center: ["50%", "50%"],
    data: optiondata.value,
    itemstyle: {
      opacity: 0,
    },
  });
  optiondata.value.foreach((item) => {
    item.label = {
      color: item.itemstyle.color,
      show: true,
      formatter: (item) => {
        return `{b|${item.name} \n}`;
      },
      rich: {
        b: {
          fontsize: 16,
          lineheight: 20,
        },
      },
    };
  });
  let option = {
    xaxis3d: {
      min: -1,
      max: 1,
    },
    yaxis3d: {
      min: -1,
      max: 1,
    },
    zaxis3d: {
      min: -1,
      max: 1,
    },
    grid3d: {
      show: false,
      top: 0, // 距离上边的间距
      boxheight, // 圆环的高度
      viewcontrol: {
        // 3d效果可以放大、旋转等,请自己去查看官方配置
        alpha: 22, // 角度
        distance: 400, // 调整视角到主体的距离,类似调整zoom
        rotatesensitivity: 0, // 设置为0无法旋转
        zoomsensitivity: 0, // 设置为0无法缩放
        pansensitivity: 0, // 设置为0无法平移
        autorotate: false, // 自动旋转
      },
    },
    series,
  };
  mychart?.setoption(option);
};

onmounted(() => {
  initcharts();
});
</script>

<style lang="scss" scoped>
.content {
    position: relative;

    .chart {
      position: absolute;
      top: -20px;
      left: -20px;
      width: 500px;
      height: 300px;
    }
}
</style>


发表评论