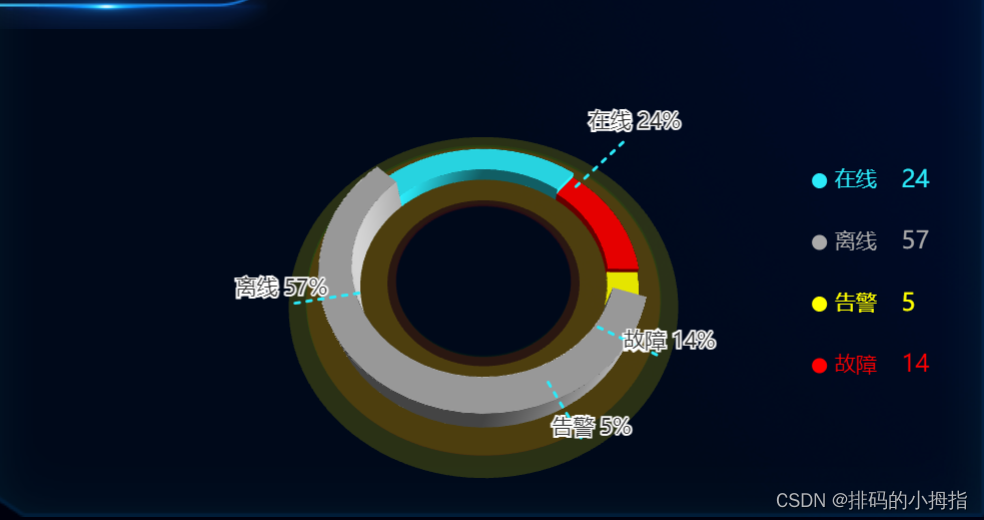
echarts与echarts-gl 实现3d饼图
实现效果:
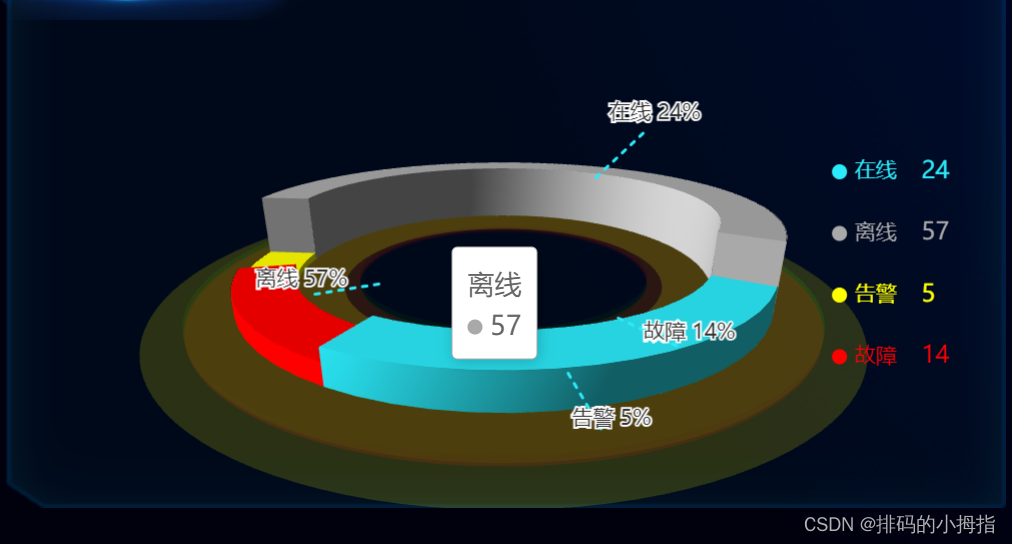
旋转效果
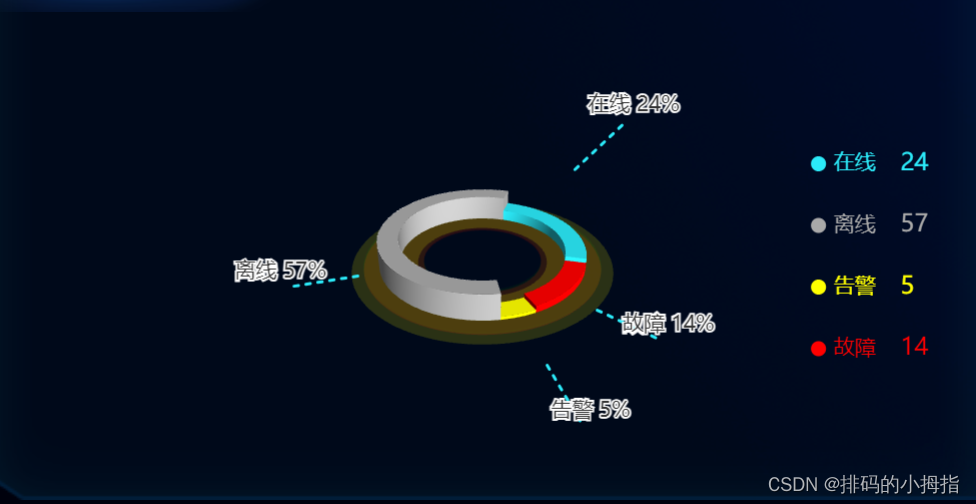
缩放效果
实现步骤
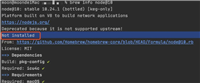
1、安装echarts
npm install echarts
npm install echarts-gl
2、页面定义容器
<template>
  <div class="echarts">
    <!-- <div :id="echarts_id" style="width: 400px;height: 400px;"></div> -->
    <div id="echarts_id" style="width: 100%;height: 100%;"></div>
  </div>
</template>
3、js中引入echarts
import * as echarts from 'echarts'
import 'echarts-gl'
vue 组件完整源码:
<template>
  <div class="echarts">
    <!-- <div :id="echarts_id" style="width: 400px;height: 400px;"></div> -->
    <div id="echarts_id" style="width: 100%;height: 100%;"></div>
  </div>
</template>

<script lang="js" setup>
import { onmounted, watch,ref } from 'vue'
import * as echarts from 'echarts'
import "echarts-gl"
let echarts_id = ref('')
const randomcoding = (res) => {
  var arr = 'abcdefjhijklmnopqrstuvwxyz0123456789'
  var char = ''
  for (var i = 0; i < 4; i++) {
    var num = parseint(math.random() * 36)
    char = char + arr[num]
  }
  echarts_id.value =
    'echarts_id' + math.floor(math.random() * (10000 - 1) + 1) + char
  // initcharts(echarts_id.value)
  initcharts('echarts_id')
}
// 生成扇形的曲面参数方程,用于 series-surface.parametricequation
function getparametricequation(startratio, endratio, isselected, ishovered, k, height) {

// 计算
let midratio = (startratio + endratio) / 2;

let startradian = startratio * math.pi * 2;
let endradian = endratio * math.pi * 2;
let midradian = midratio * math.pi * 2;

// 如果只有一个扇形,则不实现选中效果。
if (startratio === 0 && endratio === 1) {
  isselected = false;
}

// 通过扇形内径/外径的值,换算出辅助参数 k(默认值 1/3)
k = typeof k !== 'undefined' ? k : 1 / 3;

// 计算选中效果分别在 x 轴、y 轴方向上的位移(未选中,则位移均为 0)
let offsetx = isselected ? math.cos(midradian) * 0.1 : 0;
let offsety = isselected ? math.sin(midradian) * 0.1 : 0;

// 计算高亮效果的放大比例(未高亮,则比例为 1)
let hoverrate = ishovered ? 1.05 : 1;

// 返回曲面参数方程
return {

  u: {
    min: -math.pi,
    max: math.pi * 3,
    step: math.pi / 32
  },

  v: {
    min: 0,
    max: math.pi * 2,
    step: math.pi / 20
  },

  x: function (u, v) {
    if (u < startradian) {
      return offsetx + math.cos(startradian) * (1 + math.cos(v) * k) * hoverrate;
    }
    if (u > endradian) {
      return offsetx + math.cos(endradian) * (1 + math.cos(v) * k) * hoverrate;
    }
    return offsetx + math.cos(u) * (1 + math.cos(v) * k) * hoverrate;
  },

  y: function (u, v) {
    if (u < startradian) {
      return offsety + math.sin(startradian) * (1 + math.cos(v) * k) * hoverrate;
    }
    if (u > endradian) {
      return offsety + math.sin(endradian) * (1 + math.cos(v) * k) * hoverrate;
    }
    return offsety + math.sin(u) * (1 + math.cos(v) * k) * hoverrate;
  },

  z: function (u, v) {
    if (u < - math.pi * 0.5) {
      return math.sin(u);
    }
    if (u > math.pi * 2.5) {
      return math.sin(u);
    }
    return math.sin(v) > 0 ? 1 * height : -1;
  }
};
};

// 生成模拟 3d 饼图的配置项
function getpie3d(piedata, internaldiameterratio) {

let series = [];
let sumvalue = 0;
let startvalue = 0;
let endvalue = 0;
let legenddata = [];
let k = typeof internaldiameterratio !== 'undefined' ? (1 - internaldiameterratio) / (1 + internaldiameterratio) : 1 / 3;

// 为每一个饼图数据,生成一个 series-surface 配置
for (let i = 0; i < piedata.length; i++) {

  sumvalue += piedata[i].value;

  let seriesitem = {
    name: typeof piedata[i].name === 'undefined' ? `series${i}` : piedata[i].name,
    type: 'surface',
    parametric: true,
    wireframe: {
      show: false
    },
    piedata: piedata[i],
    piestatus: {
      selected: false,
      hovered: false,
      k: k
    }
  };

  if (typeof piedata[i].itemstyle != 'undefined') {

    let itemstyle = {};

    typeof piedata[i].itemstyle.color != 'undefined' ? itemstyle.color = piedata[i].itemstyle.color : null;
    typeof piedata[i].itemstyle.opacity != 'undefined' ? itemstyle.opacity = piedata[i].itemstyle.opacity : null;

    seriesitem.itemstyle = itemstyle;
  }
  series.push(seriesitem);
}

// 使用上一次遍历时,计算出的数据和 sumvalue,调用 getparametricequation 函数,
// 向每个 series-surface 传入不同的参数方程 series-surface.parametricequation,也就是实现每一个扇形。
for (let i = 0; i < series.length; i++) {
  endvalue = startvalue + series[i].piedata.value;
  series[i].piedata.startratio = startvalue / sumvalue;
  series[i].piedata.endratio = endvalue / sumvalue;
  series[i].parametricequation = getparametricequation(series[i].piedata.startratio, series[i].piedata.endratio, false, false, k, series[i].piedata.value);

  startvalue = endvalue;

  legenddata.push(series[i].name);
}

// // 补充一个透明的圆环,用于支撑高亮功能的近似实现。
series.push({
  name: 'mouseoutseries',
  type: 'surface',
  parametric: true,
  wireframe: {
    show: false,
  },
  itemstyle: {
    opacity: 0.1,
    color: 'green',
  },
  parametricequation: {
    u: {
      min: 0,
      max: math.pi * 2,
      step: math.pi / 70,
    },
    v: {
      min: 0,
      max: math.pi,
      step: math.pi / 70,
    },
    x: function (u, v) {
      return ((math.sin(v) * math.sin(u) + math.sin(u)) / math.pi) * 2;
    },
    y: function (u, v) {
      return ((math.sin(v) * math.cos(u) + math.cos(u)) / math.pi) * 2;
    },
    z: function (u, v) {
      return math.cos(v) > 0 ? -0.5 : -5;
    },
  },
});

// // 补充一个透明的圆环,用于支撑高亮功能的近似实现。
series.push({
  name: 'mouseoutseries',
  type: 'surface',
  parametric: true,
  wireframe: {
    show: false,
  },
  itemstyle: {
    opacity: 0.1,
    color: 'red',
  },
  parametricequation: {
    u: {
      min: 0,
      max: math.pi * 2,
      step: math.pi / 70,
    },
    v: {
      min: 0,
      max: math.pi,
      step: math.pi / 70,
    },
    x: function (u, v) {
      return ((math.sin(v) * math.sin(u) + math.sin(u)) / math.pi) * 2;
    },
    y: function (u, v) {
      return ((math.sin(v) * math.cos(u) + math.cos(u)) / math.pi) * 2;
    },
    z: function (u, v) {
      return math.cos(v) > 0 ? -5 : -7;
    },
  },
});
series.push({
  name: 'mouseoutseries',
  type: 'surface',
  parametric: true,
  wireframe: {
    show: false,
  },
  itemstyle: {
    opacity: 0.1,
    color: 'yellow',

  },

  parametricequation: {
    u: {
      min: 0,
      max: math.pi * 2,
      step: math.pi / 70,
    },
    v: {
      min: 0,
      max: math.pi,
      step: math.pi / 70,
    },
    x: function (u, v) {
      return ((math.sin(v) * math.sin(u) + math.sin(u)) / math.pi) * 2.2;
    },
    y: function (u, v) {
      return ((math.sin(v) * math.cos(u) + math.cos(u)) / math.pi) * 2.2;
    },
    z: function (u, v) {
      return math.cos(v) > 0 ? -7 : -7;
    },
  },
});
return series;
}
// 传入数据生成 option
const optionsdata = [
{
  name: '在线',
  value: 24,
  itemstyle: {
    color: '#2beaf9',
  },
},

{
  name: '离线',
  value: 57,
  itemstyle: {
    color: 'darkgrey',
  },
},
{
  name: '告警',
  value: 5,
  itemstyle: {
    color: 'yellow',
  },
},
{
  name: '故障',
  value: 14,
  itemstyle: {
    color: 'red',
  },
},
];

const series = getpie3d(optionsdata, 0.8, 240, 28, 26, 0.5);

series.push({
name: 'pie2d',
type: 'pie',
label: {
  opacity: 1,
  fontsize: 13,
  lineheight: 20,
  textstyle: {
    fontsize: 14,
  },
},
  labelline: {
    length: 50,
    length2: 0,
    // showabove: true,
    // minturnangle: 0,
    // maxsurfaceangle: 180,
    linestyle: {
      width: 2,
      type: [3, 5],
      color: '#2beaf9',
      // cap: 'round',
      // join:'round'
    },
  },

  labellayout: {
    hideoverlap: false,
    moveoverlap: 'shifty',
    align: 'center',
    // 默认的标签垂直对齐
    verticalalign: 'bottom',
    // rotate: 90
    // draggable: true,
    // x: '20%',
    // x: 'center',
    // dx: 50,
    // y: '10%',
    // dy: 20,
    // linepoints: [[20,50], [20,50], [20,50]]
  },
startangle: 0, //起始角度,支持范围[0, 360]。
clockwise: false, //饼图的扇区是否是顺时针排布。上述这两项配置主要是为了对齐3d的样式
radius: ['20%', '50%'],
center: ['50%', '50%'],
data: optionsdata,
itemstyle: {
  opacity: 0,
},
});

const initcharts = (id) => {
  const client = document.getelementbyid(id)

  var mychartca7 = echarts.init(client)
  var option
  // 准备待返回的配置项,把准备好的 legenddata、series 传入。
  option = {
    color: ["#2beaf9", "darkgrey", "yellow", "red"],
    legend: {
      icon: 'circle',
      // tooltip: {
      //   show: true,
      // },
      itemwidth: 10,   // 每个图例标记的宽度
      itemheight: 10,  // 每个图例标记的高度
      textstyle: {
          color: '#333'  // 文本颜色
      },
      itemgap: 25,      // 图例之间的间距
      orient: 'horizontal',  // 水平布局

      itemstyle: {
          bordercolor: 'red',  // 边框颜色
          // 设置圆角样式
          borderradius: [5, 5, 0, 0]  // 左上、右上、右下、左下四个角分别设置不同的半径值
      },
      data: ['在线', '离线', '故障', '告警'],
      right: '5%',
      top: 'middle',
      orient: 'vertical',
      textstyle: {
        color: "#",
        fontsize: 14,
        rich: {
          text: {
            // color:'#fff',
            fontsize: 14,
          },
          number: {
            fontsize: 16
          }
        }
      },
      data: optionsdata,
      formatter: (name) => {
        if (optionsdata.length) {
          const item = optionsdata.filter((item) => item.name === name)[0];
          return `{text|${name}}    {number|${item.value}}`;
        }
      },
    },

    animation: true,
    tooltip: {
      formatter: params => {
        if (params.seriesname !== 'mouseoutseries' && params.seriesname !== 'pie2d') {
          return `${params.seriesname}<br/><span style="display:inline-block;margin-right:5px;border-radius:10px;width:10px;height:10px;background-color:${params.color};"></span>${option.series[params.seriesindex].piedata.value + ''}`;
        }
      },
      textstyle: {
        fontsize: 18
      },
    },
    title: {
      x: 'center',
      top: '20',
      textstyle: {
        color: '#fff',
        fontsize: 22,
      },
    },
    // backgroundcolor: '#333',
    labelline: {
      show: true,
      linestyle: {
        type: 'dash',
        color: '#2beaf9',
        dashoffset: 5,
        cap: 'round'
      },
    },
    label: {
      show: true,
      position: 'outer',
      alignto: 'labelline',
      formatter: '{b} {d}%',
      // alignto: 'labelline',
      // ·圆点
      // backgroundcolor: 'auto',
      // height: 0,
      // width: 0,
      // lineheight: 0,
      // distancetolabelline: 0,
      // borderradius: 2.5,
      // padding: [2.5, -2.5, 2.5, -2.5],
      // formatter: function (params) {
      //     if (params.name !== '') {
      //       return `{a|${params.name}:}{b|${params.value}个}`;
      //     } else {
      //       return '';
      //     }
      //   },
      //   rich: {
      //     a: {
      //       padding: [0, 0, 0, 10],
      //       color: '#fff'
      //     },
      //     b: {
      //       padding: [0, 10, 0, 0],
      //       color: '#fff'
      //     },
      //   }

    },
    xaxis3d: {
      min: -1,
      max: 1,
    },
    yaxis3d: {
      min:-1,
      max: 1,
    },
    zaxis3d: {
      min: -1,
      max: 1,
    },
    grid3d: {
      show: false,
      boxheight: 0.5,
      //top: '30%',
      bottom: '50%',
      // environment: '#021041',
      viewcontrol: {
        rotatesensitivity: 20,
        distance: 190,
        alpha: 20,
        beta: 0,
        autorotate: false, // 自动旋转
      }
    },
    series: series,
  };

  const clientwidth = client.clientwidth
  const clientheight = client.clientheight

  mychartca7.setoption(option, true)

  window.onresize = function () {
    mychartca7.resize()
  }
  window.addeventlistener('resize', function () {
    mychartca7.resize()
  })
}
onmounted(() => {
  randomcoding()
  // initcharts()
})

</script>
<style scoped lang="scss">
.echarts {
  height: 100%;
}
</style>


发表评论