0. 参考手册
1. prometheus pushgateway
1.1 pushgateway使用场景介绍
1.2 pushgateway简介
1.3 pushgateway数据采集流程
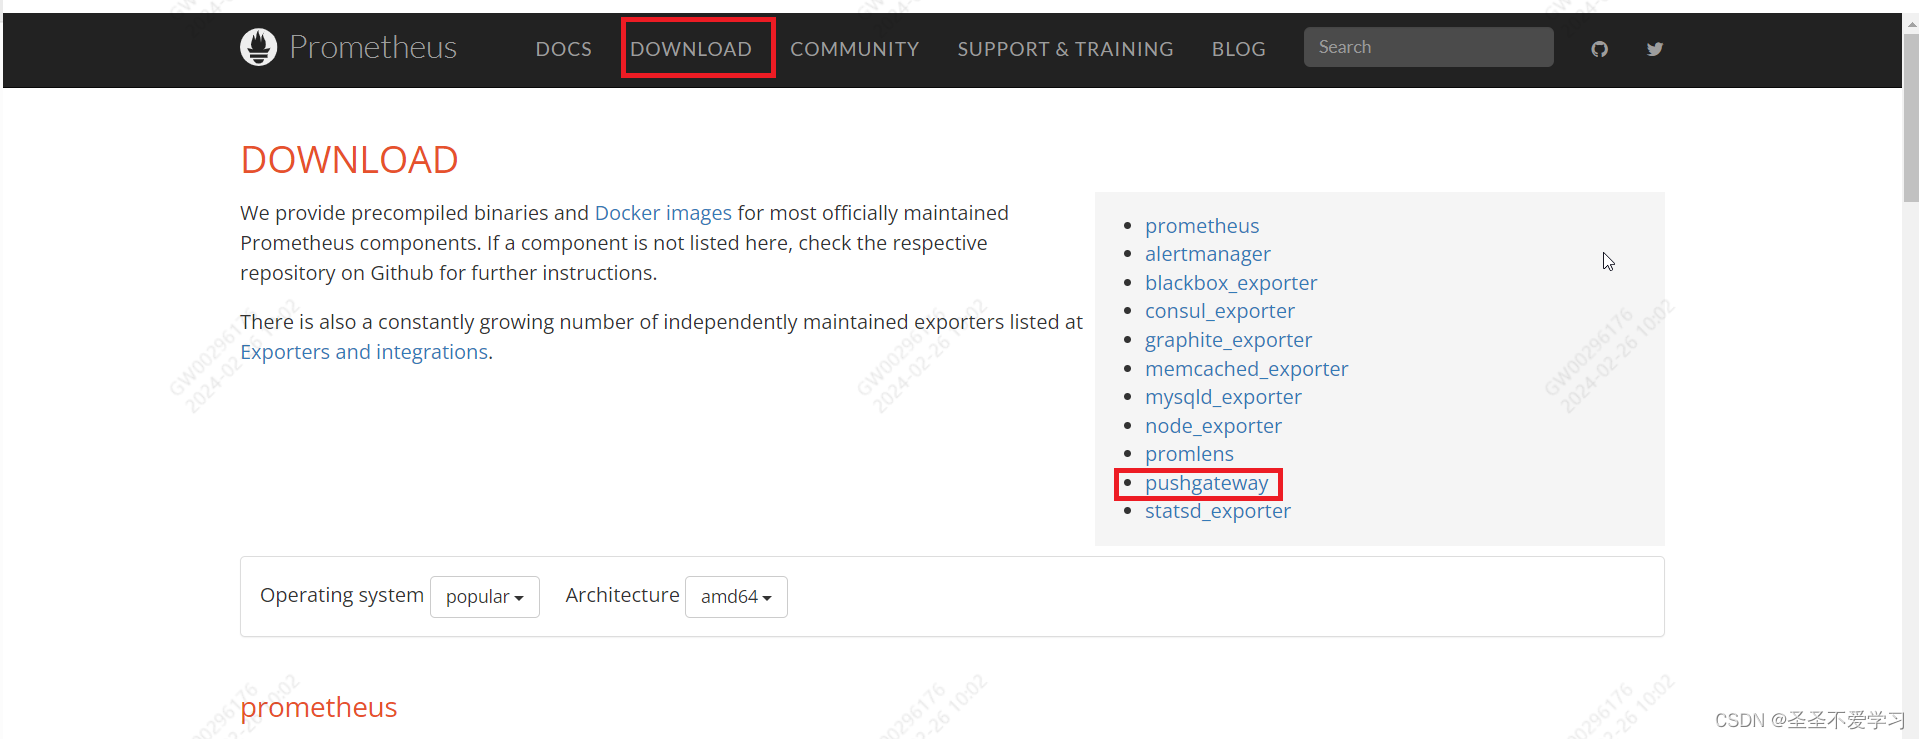
1.4 二进制安装pushgateway
1.4.1 下载安装包
[root@pushgateway ~]# mkdir /apps
[root@pushgateway ~]# cd /apps
[root@pushgateway apps]# wget https://github.com/prometheus/pushgateway/releases/download/v1.7.0/pushgateway-1.7.0.linux-amd64.tar.gz
[root@pushgateway apps]# ll
总用量 10036
-rw-r--r-- 1 root root 10273763 2月  26 10:27 pushgateway-1.7.0.linux-amd64.tar.gz
1.4.2 解压配置并启动
[root@pushgateway apps]# tar xf pushgateway-1.7.0.linux-amd64.tar.gz
[root@pushgateway apps]# ln -s pushgateway-1.7.0.linux-amd64 pushgateway
[root@pushgateway apps]# ll pushgateway
lrwxrwxrwx 1 root root 29 2月  26 11:09 pushgateway -> pushgateway-1.7.0.linux-amd64

[root@pushgateway apps]# cat /etc/systemd/system/pushgateway.service
[unit]
description=prometheus pushgateway
after=network.target

[service]
execstart=/apps/pushgateway/pushgateway

[install]
wantedby=multi-user.target

[root@pushgateway apps]# systemctl daemon-reload
[root@pushgateway apps]# systemctl enable pushgateway.service
created symlink from /etc/systemd/system/multi-user.target.wants/pushgateway.service to /etc/systemd/system/pushgateway.service.
[root@pushgateway apps]# systemctl start pushgateway.service

[root@pushgateway apps]# netstat -lntup |grep pushgateway
tcp6       0      0 :::9091                 :::*                    listen      1563/pushgateway
1.5 推送单条数据到pushgateway
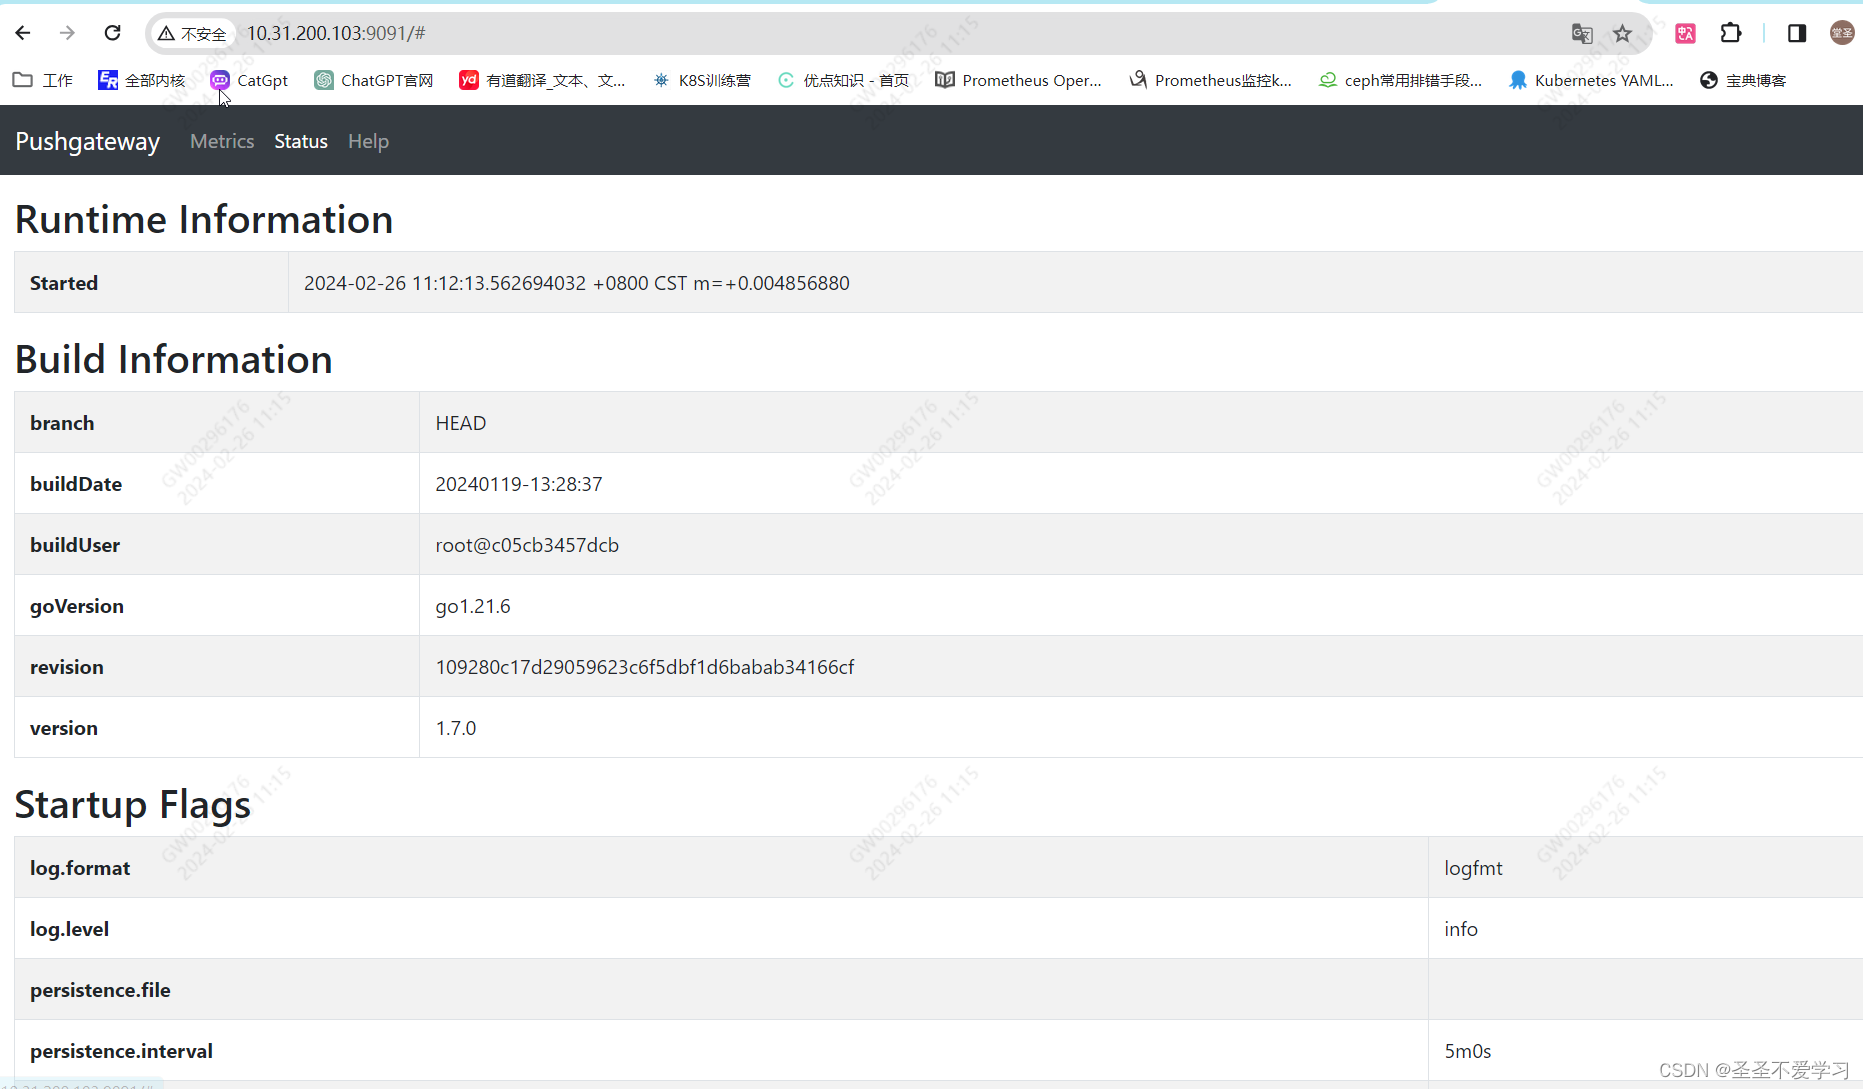
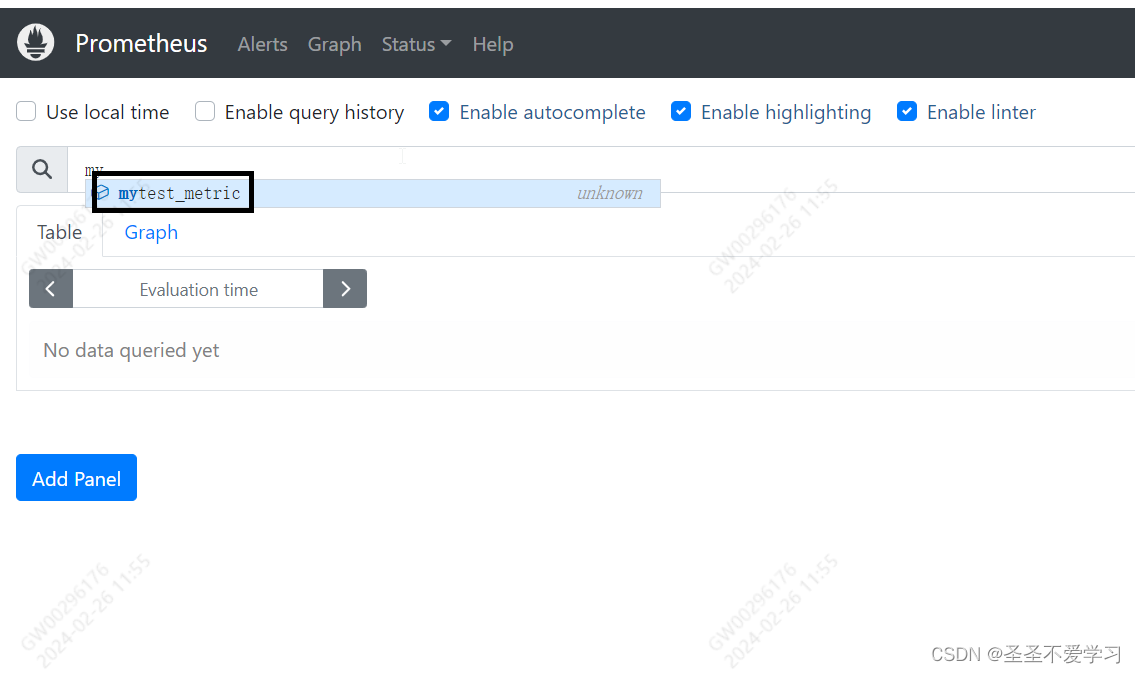
1.5.1 访问web页面
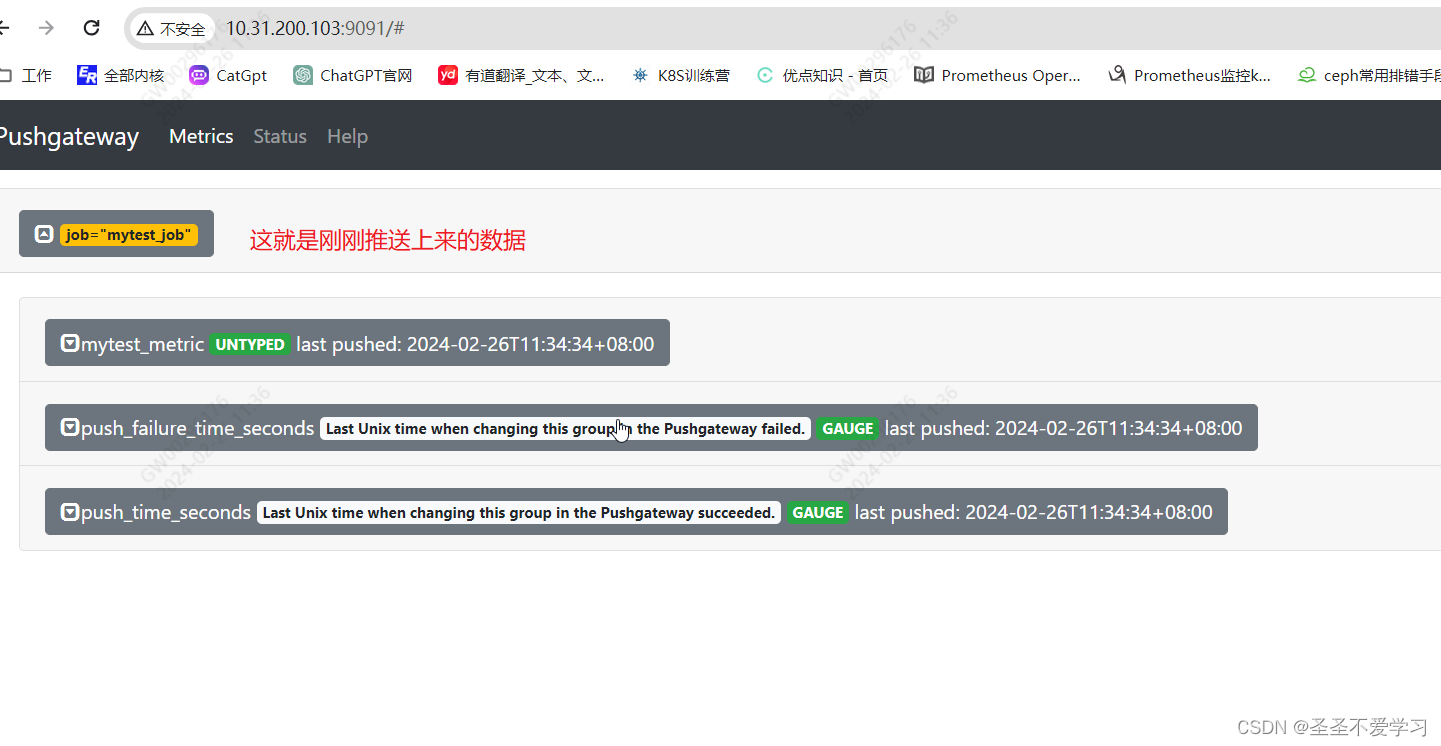
1.5.2 客户端推送单条指标数据
[root@pushgateway apps]# echo "mytest_metric 2088" | curl --data-binary @- http://10.31.200.103:9091/metrics/job/mytest_job
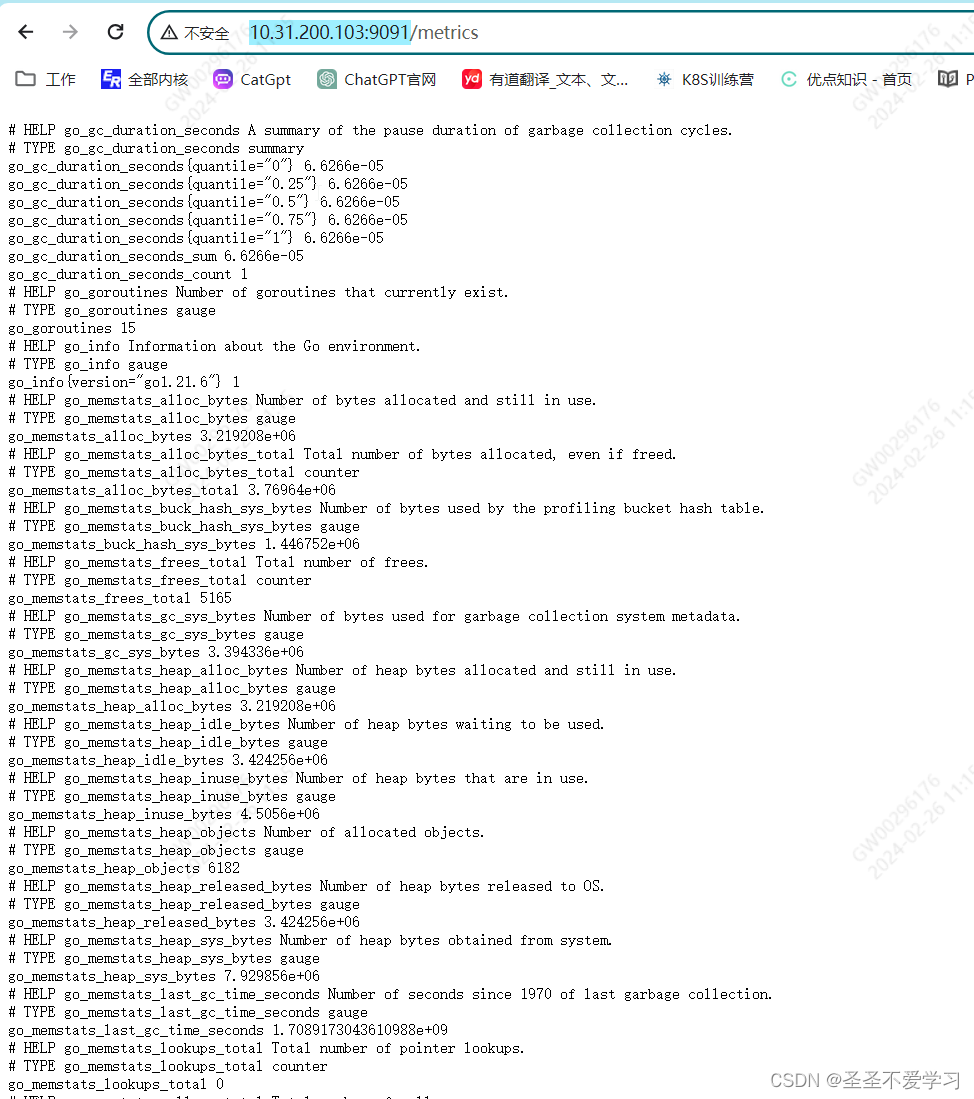
1.5.3 检查数据推送情况
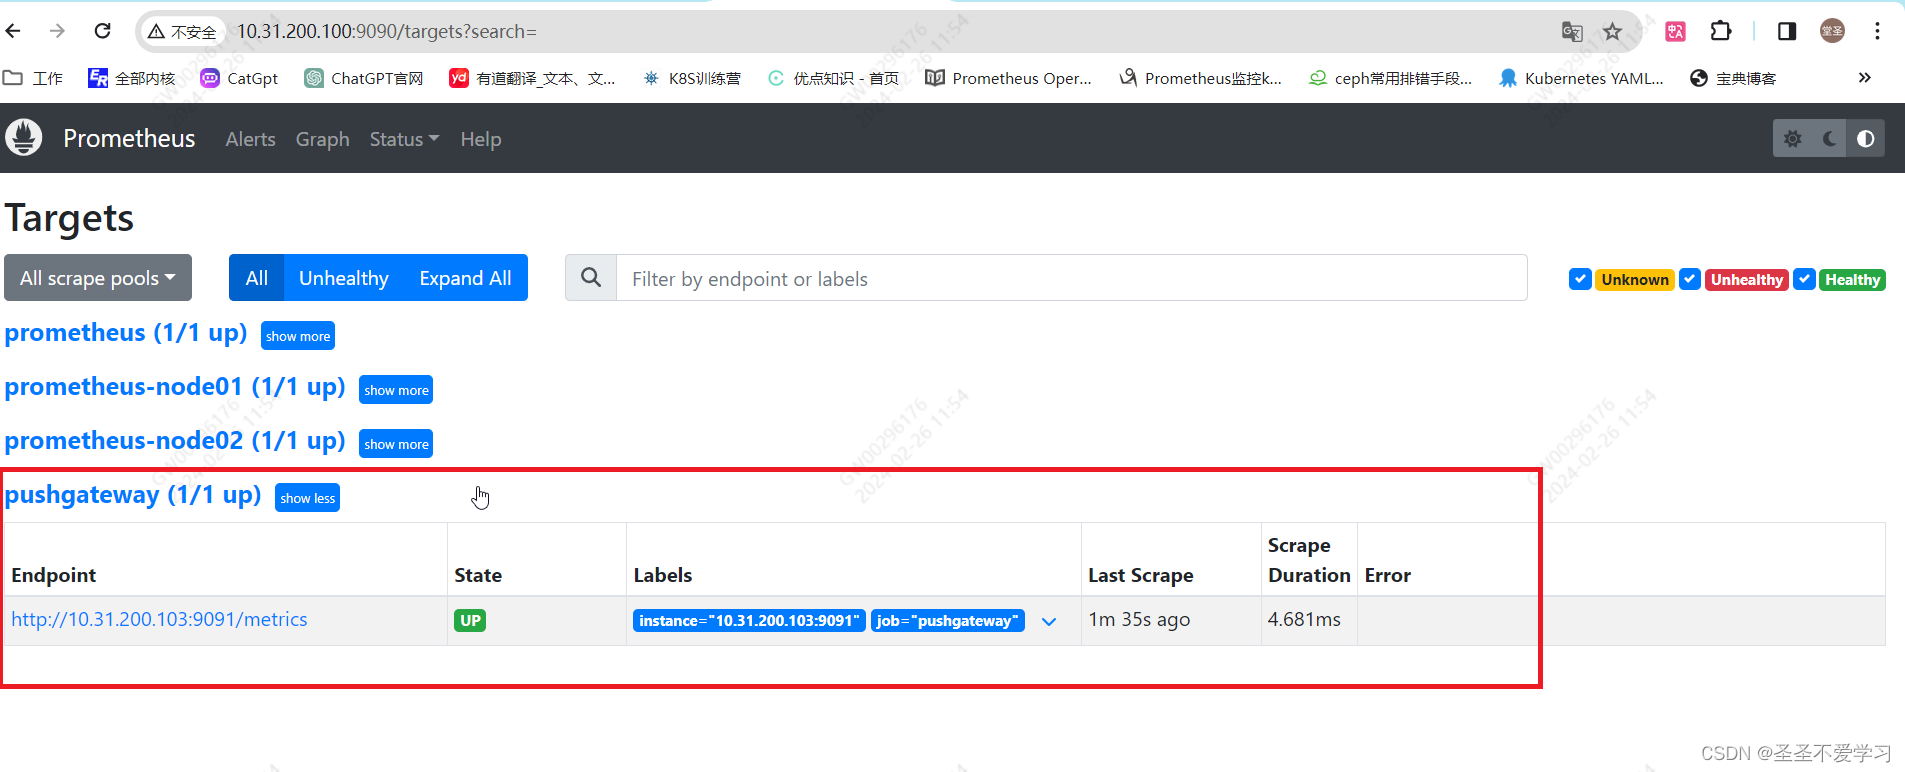
1.6 配置prometheus采集pushgateway数据
1.6.1 配置prometheus
[root@prometheus-server tmp]# cd /apps/prometheus
[root@prometheus-server prometheus]# cat prometheus.yml
global:
  scrape_interval: 15s
  evaluation_interval: 15s

alerting:
  alertmanagers:
    - static_configs:
        - targets:
rule_files:

scrape_configs:
  - job_name: "prometheus"
    static_configs: # 静态配置
      - targets: ["localhost:9090"]
  - job_name: "prometheus-node01"
    static_configs:
      - targets: ["10.31.200.101:9100"]
  - job_name: "prometheus-node02"
    static_configs:
      - targets: ["10.31.200.102:9100"]
  - job_name: "pushgateway"
    scrape_interval: 5s # 局部数据抓取时间
    static_configs:
      - targets: ["10.31.200.103:9091"]

[root@prometheus-server prometheus]# systemctl restart prometheus.service
1.6.2 检查采集结果
1.6 推送多条数据到pushgateway
1.6.1 方式一:命令行推送
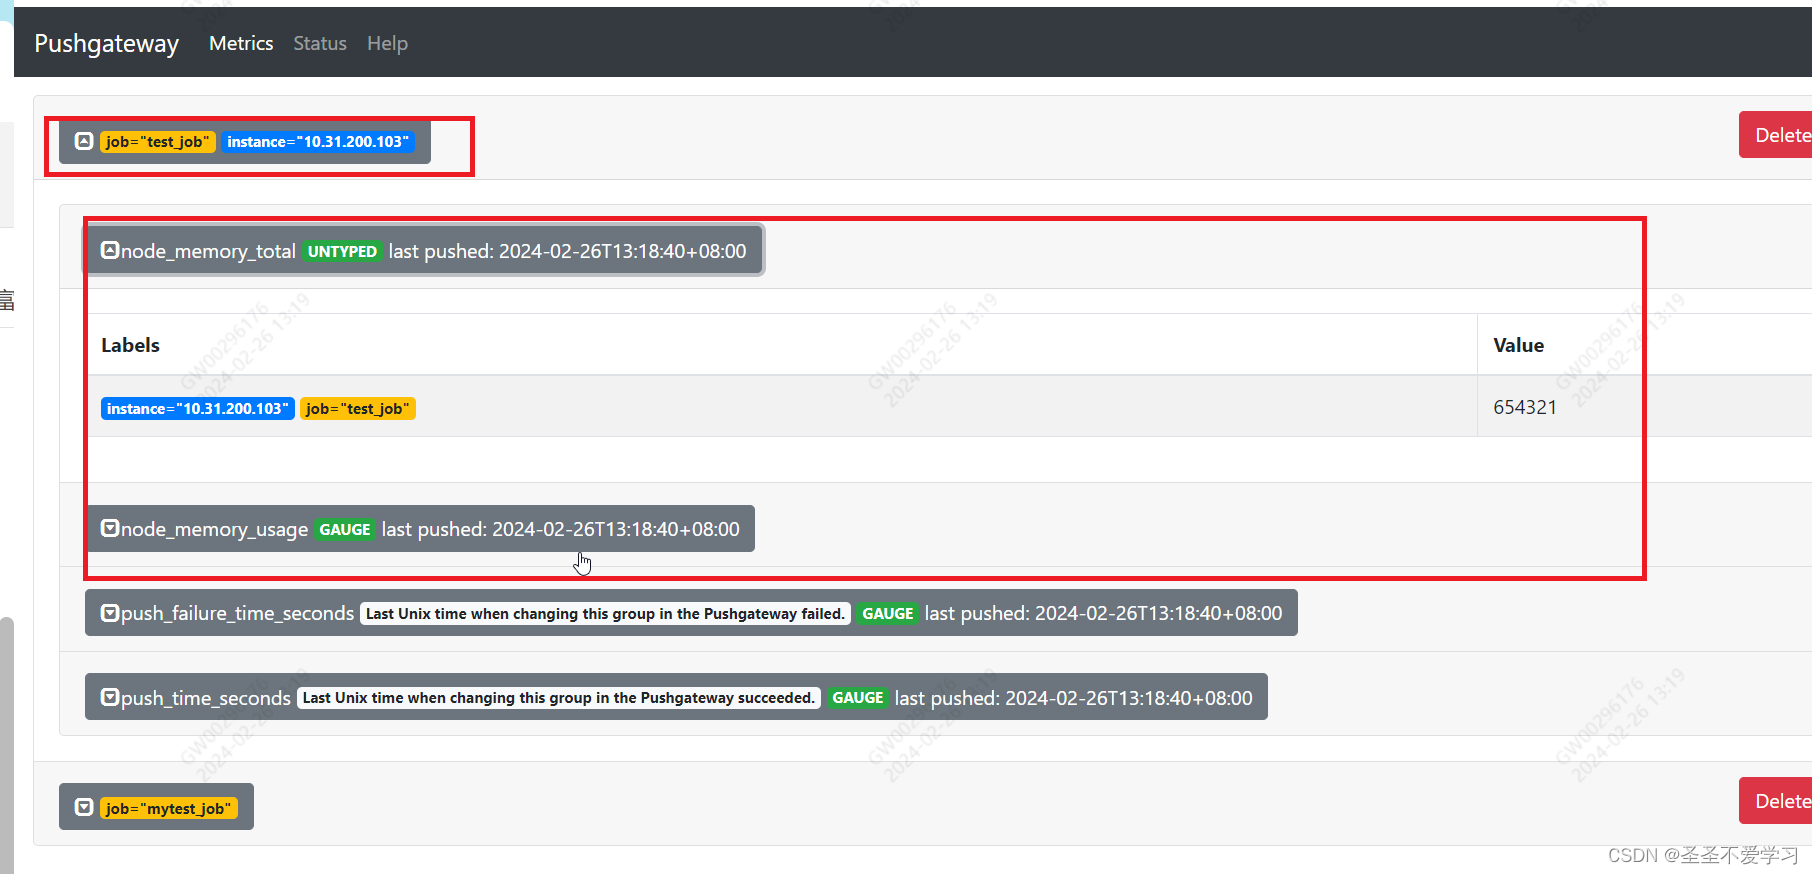
1.6.1.1 推送数据
[root@prometheus-server prometheus]# cat <<eof | curl --data-binary @- http://10.31.200.103:9091/metrics/job/test_job/instance/10.31.200.103
#type node_memory_usage gauge
node_memory_usage 123456
# type memory_total gauge
node_memory_total 654321
eof
1.6.1.2 web页面查看推送结果
1.6.2 方式二:脚本推送
编辑一个获取主机内存的脚本,然后把数据推送到pushgateway,再由prometheus去拉取
工作中应该放到定时任务中执行该脚本。
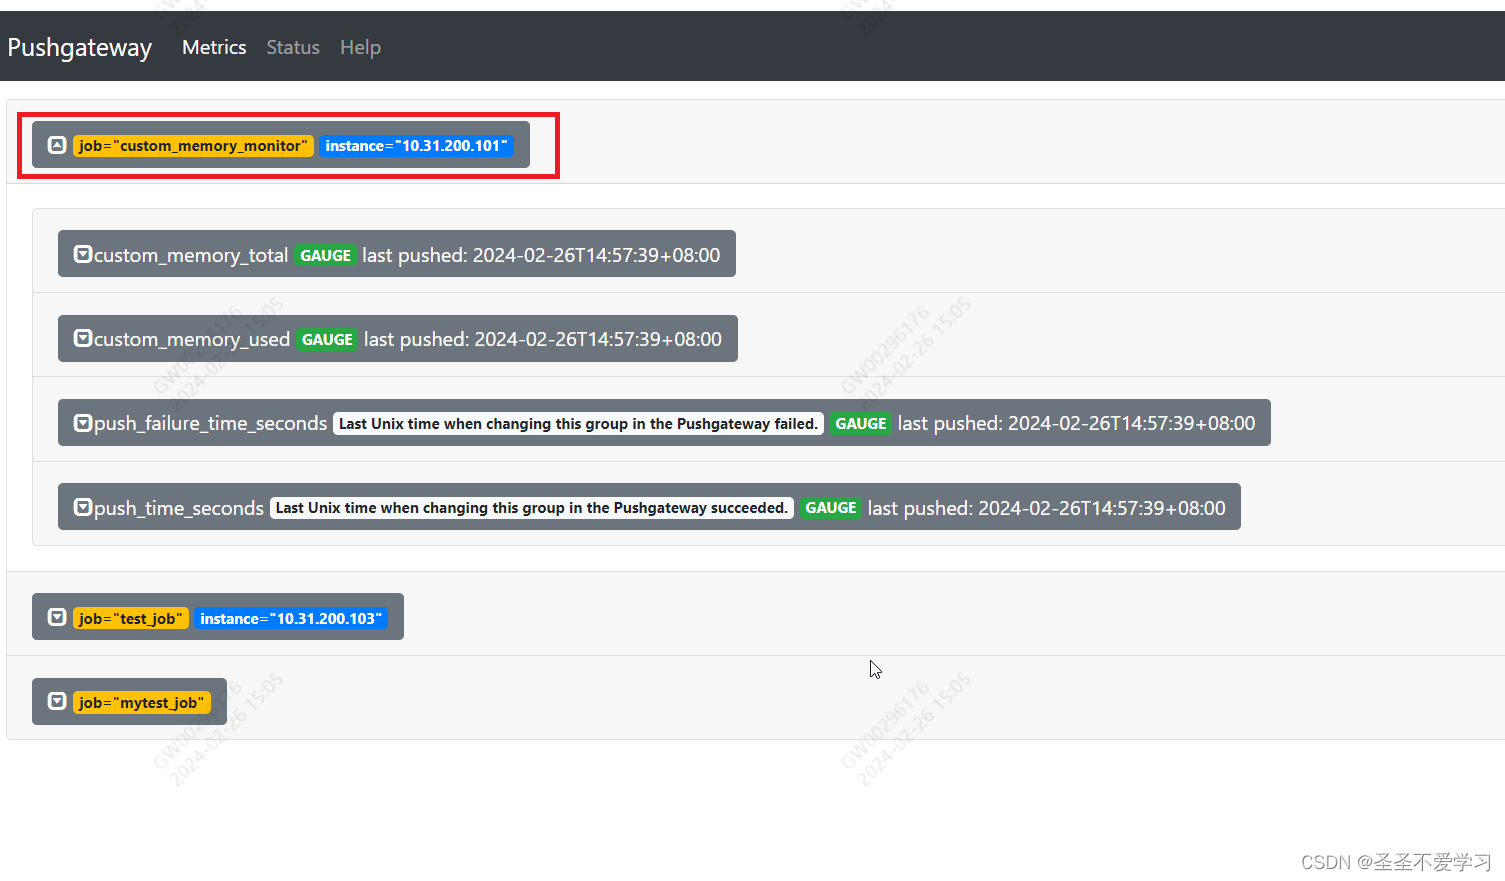
1.6.2.1 编辑脚本并执行
[root@node01 ~]# vim memory_monitor.sh
[root@node01 ~]# cat memory_monitor.sh
#!/bin/bash
total_memory=$(free |awk '/mem/{print $2}')
used_memory=$(free |awk '/mem/{print $3}')
job_name="custom_memory_monitor"
instance_name=`ifconfig ens192 | grep -w inet | awk '{print $2}'`
pushgateway_server="http://10.31.200.103:9091/metrics/job"
cat <<eof | curl --data-binary @- ${pushgateway_server}/${job_name}/instance/${instance_name}
#type custom_memory_total gauge
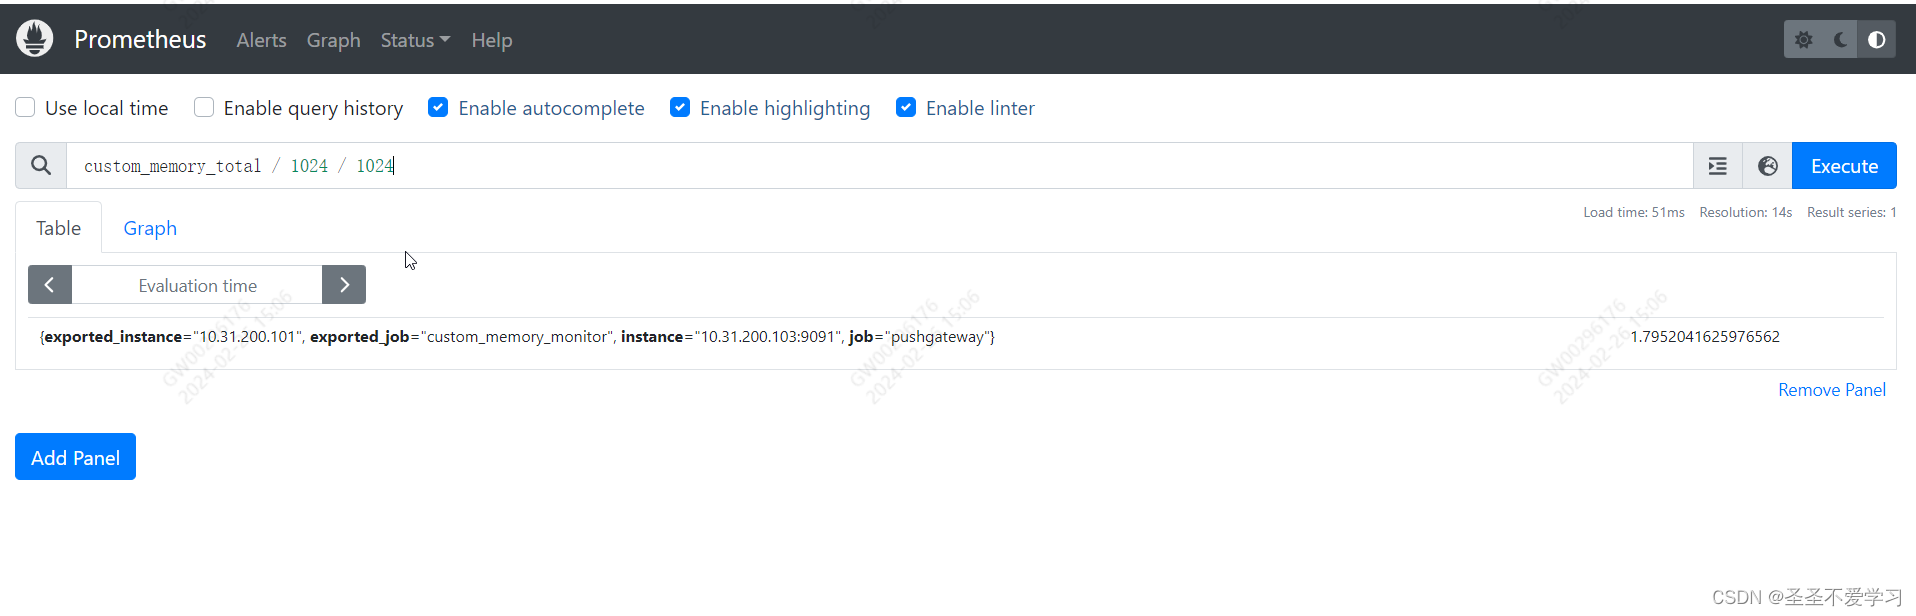
custom_memory_total $total_memory
#type custom_memory_used gauge
custom_memory_used $used_memory
eof
# 执行脚本
[root@node01 ~]# sh memory_monitor.sh
1.6.2.2 查看数据推送情况
1.7 pushgateway数据删除
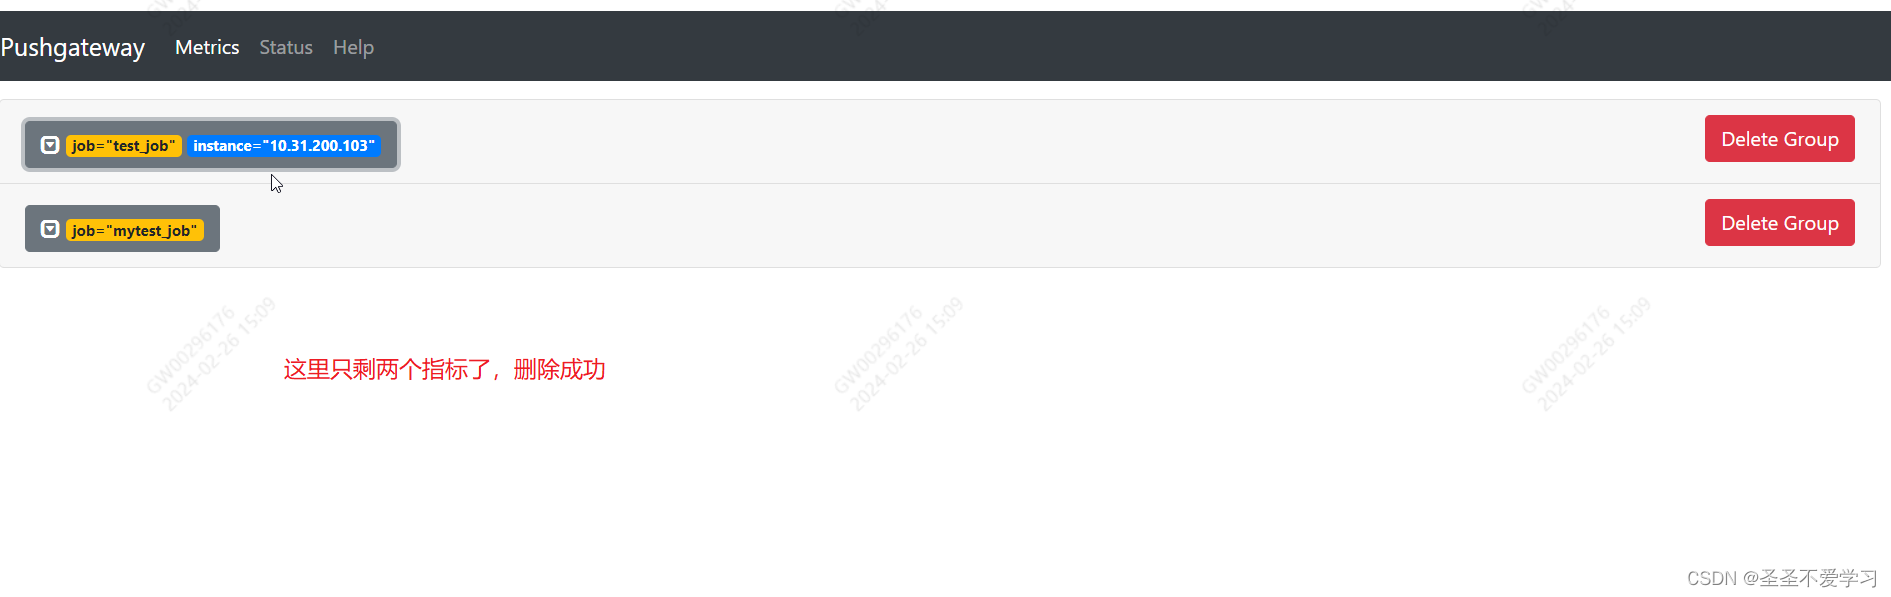
1.7.1 web页面删除
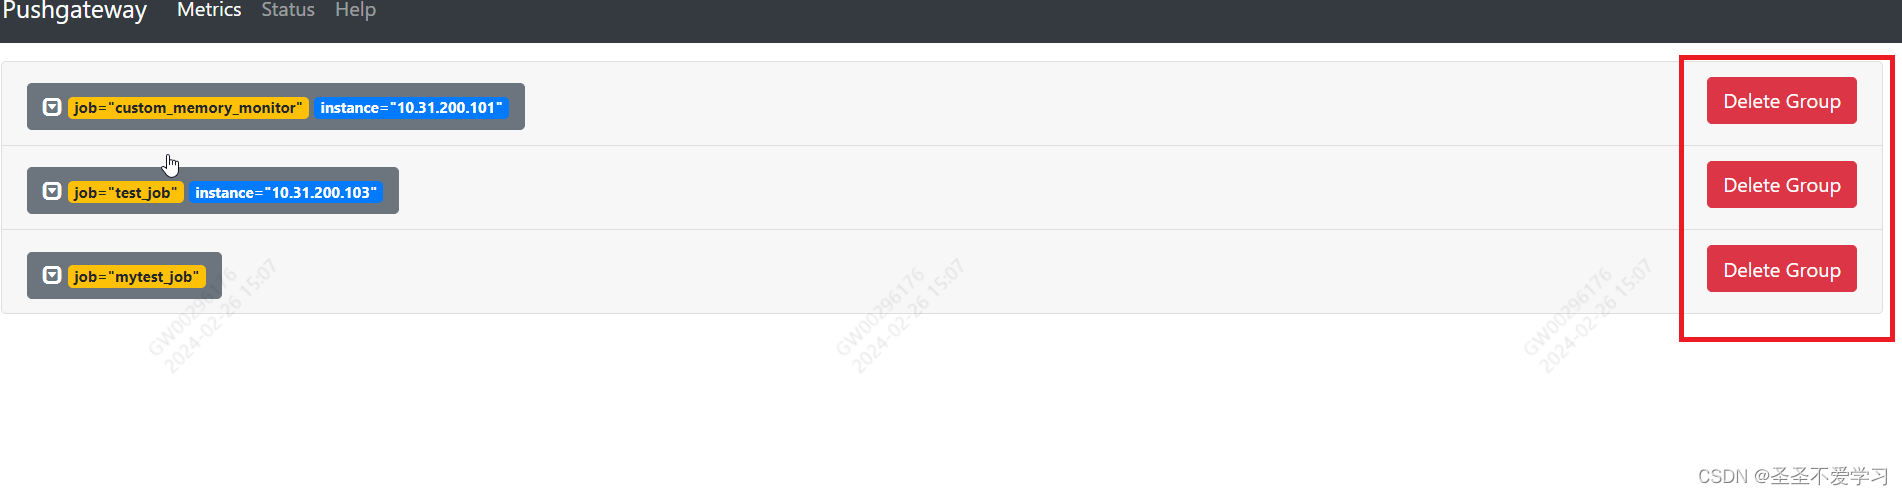
1.7.2 通过api接口删除
[root@node01 ~]# curl -x delete http://10.31.200.103:9091/metrics/job/custom_memory_monitor/instance/10.31.200.101
2. prometheus联邦集群(federation)
2.1 使用场景
2.2 部署prometheus联邦环境
2.2.1 环境准备
2.2.1 部署3台prometheus
所有prometheus节点相同操作
~]# mkdir /apps
~]# cd /apps/
apps]#
apps]# wget https://github.com/prometheus/prometheus/releases/download/v2.49.1/prometheus-2.49.1.linux-amd64.tar.gz
apps]# ln -s prometheus-2.49.1.linux-amd64 prometheus
apps]# ll prometheus
lrwxrwxrwx 1 root root 29 2月  26 16:10 prometheus -> prometheus-2.49.1.linux-amd64

apps]# cat /etc/systemd/system/prometheus.service
[unit]
description=prometheus server
documentation=https://prometheus.io/docs/introduction/overview/
after=network.target

[service]
restart=on-failure
workingdirectory=/apps/prometheus/
execstart=/apps/prometheus/prometheus --config.file=/apps/prometheus/prometheus.yml --web.enable-lifecycle

[install]
wantedby=multi-user.target

apps]# systemctl daemon-reload
apps]# systemctl enable prometheus.service
created symlink from /etc/systemd/system/multi-user.target.wants/prometheus.service to /etc/systemd/system/prometheus.service.
apps]# systemctl start prometheus.service

[root@prometheus-federation-2 apps]# netstat -lntup |grep prometheus
tcp6       0      0 :::9090                 :::*                    listen      1737/prometheus
2.2.2 部署node-export
所有节点相同操作
在这里插入代码片~]# mkdir /apps
~]# cd /apps
apps]# wget https://github.com/prometheus/node_exporter/releases/download/v1.7.0/node_exporter-1.7.0.linux-amd64.tar.gz

[root@node01 apps]# tar xf node_exporter-1.7.0.linux-amd64.tar.gz
[root@node01 apps]# ln -s node_exporter-1.7.0.linux-amd64 node_exporter
[root@node01 apps]# ll node_exporter
lrwxrwxrwx 1 root root 31 2月  26 16:37 node_exporter -> node_exporter-1.7.0.linux-amd64

apps]# cat /etc/systemd/system/node-exporter.service
[unit]
description=prometheus node exporter
after=network.target

[service]
execstart=/apps/node_exporter/node_exporter

[install]
wantedby=multi-user.target
apps]# systemctl daemon-reload
apps]# systemctl enable node-exporter.service
created symlink from /etc/systemd/system/multi-user.target.wants/node-exporter.service to /etc/systemd/system/node-exporter.service.
apps]# systemctl start node-exporter.service
apps]#

[root@node01 apps]# ss -lntup |grep export
tcp    listen     0      128    [::]:9100               [::]:*                   users:(("node_exporter",pid=1215,fd=3))
2.3 调整prometheus相关节点的配置文件
2.3.1 调整联邦节点的配置文件
2.3.1.1 联邦节点一
[root@prometheus-federation-1 ~]# cd /apps/prometheus
[root@prometheus-federation-1 prometheus]# cat prometheus.yml
global:
scrape_interval: 15s # set the scrape interval to every 15 seconds. default is every 1 minute.
evaluation_interval: 15s # evaluate rules every 15 seconds. the default is every 1 minute.
# scrape_timeout is set to the global default (10s).
# alertmanager configuration
alerting:
alertmanagers:
- static_configs:
- targets:
# - alertmanager:9093
# load rules once and periodically evaluate them according to the global 'evaluation_interval'.
rule_files:
# - "first_rules.yml"
# - "second_rules.yml"
# a scrape configuration containing exactly one endpoint to scrape:
# here it's prometheus itself.
scrape_configs:
# the job name is added as a label `job=<job_name>` to any timeseries scraped from this config.
- job_name: "prometheus"
# metrics_path defaults to '/metrics'
# scheme defaults to 'http'.
static_configs:
- targets: ["localhost:9090"]
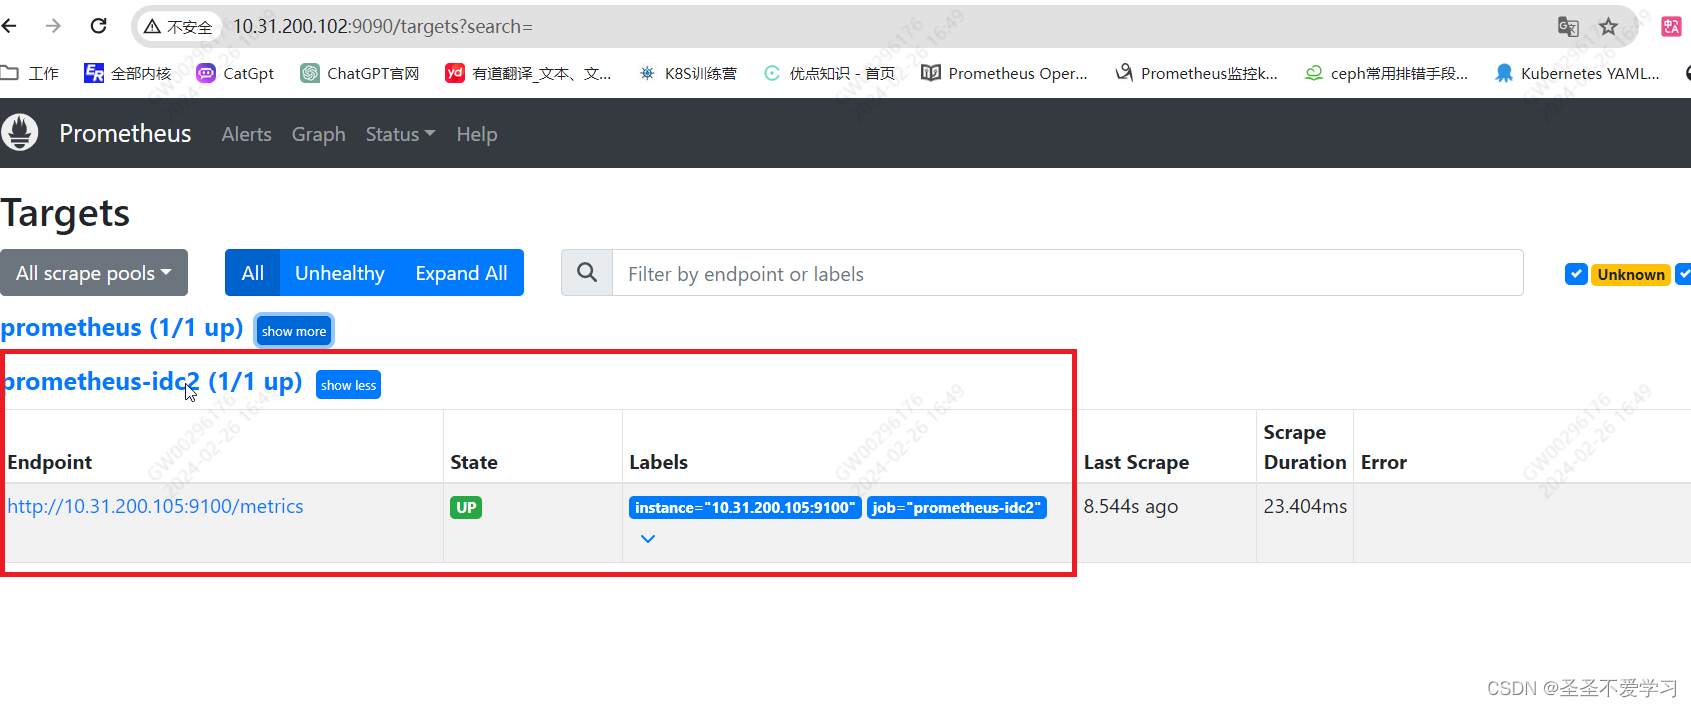
- job_name: "prometheus-idc1" # 添加监控节点
static_configs:
- targets: ["10.31.200.103:9100","10.31.200.104:9100"]
[root@prometheus-federation-1 prometheus]# systemctl restart prometheus.service
2.3.1.2 联邦节点二
[root@prometheus-federation-2 ~]# cat /apps/prometheus/prometheus.yml
# my global config
global:
scrape_interval: 15s # set the scrape interval to every 15 seconds. default is every 1 minute.
evaluation_interval: 15s # evaluate rules every 15 seconds. the default is every 1 minute.
# scrape_timeout is set to the global default (10s).
# alertmanager configuration
alerting:
alertmanagers:
- static_configs:
- targets:
# - alertmanager:9093
# load rules once and periodically evaluate them according to the global 'evaluation_interval'.
rule_files:
# - "first_rules.yml"
# - "second_rules.yml"
# a scrape configuration containing exactly one endpoint to scrape:
# here it's prometheus itself.
scrape_configs:
# the job name is added as a label `job=<job_name>` to any timeseries scraped from this config.
- job_name: "prometheus"
# metrics_path defaults to '/metrics'
# scheme defaults to 'http'.
static_configs:
- targets: ["localhost:9090"]
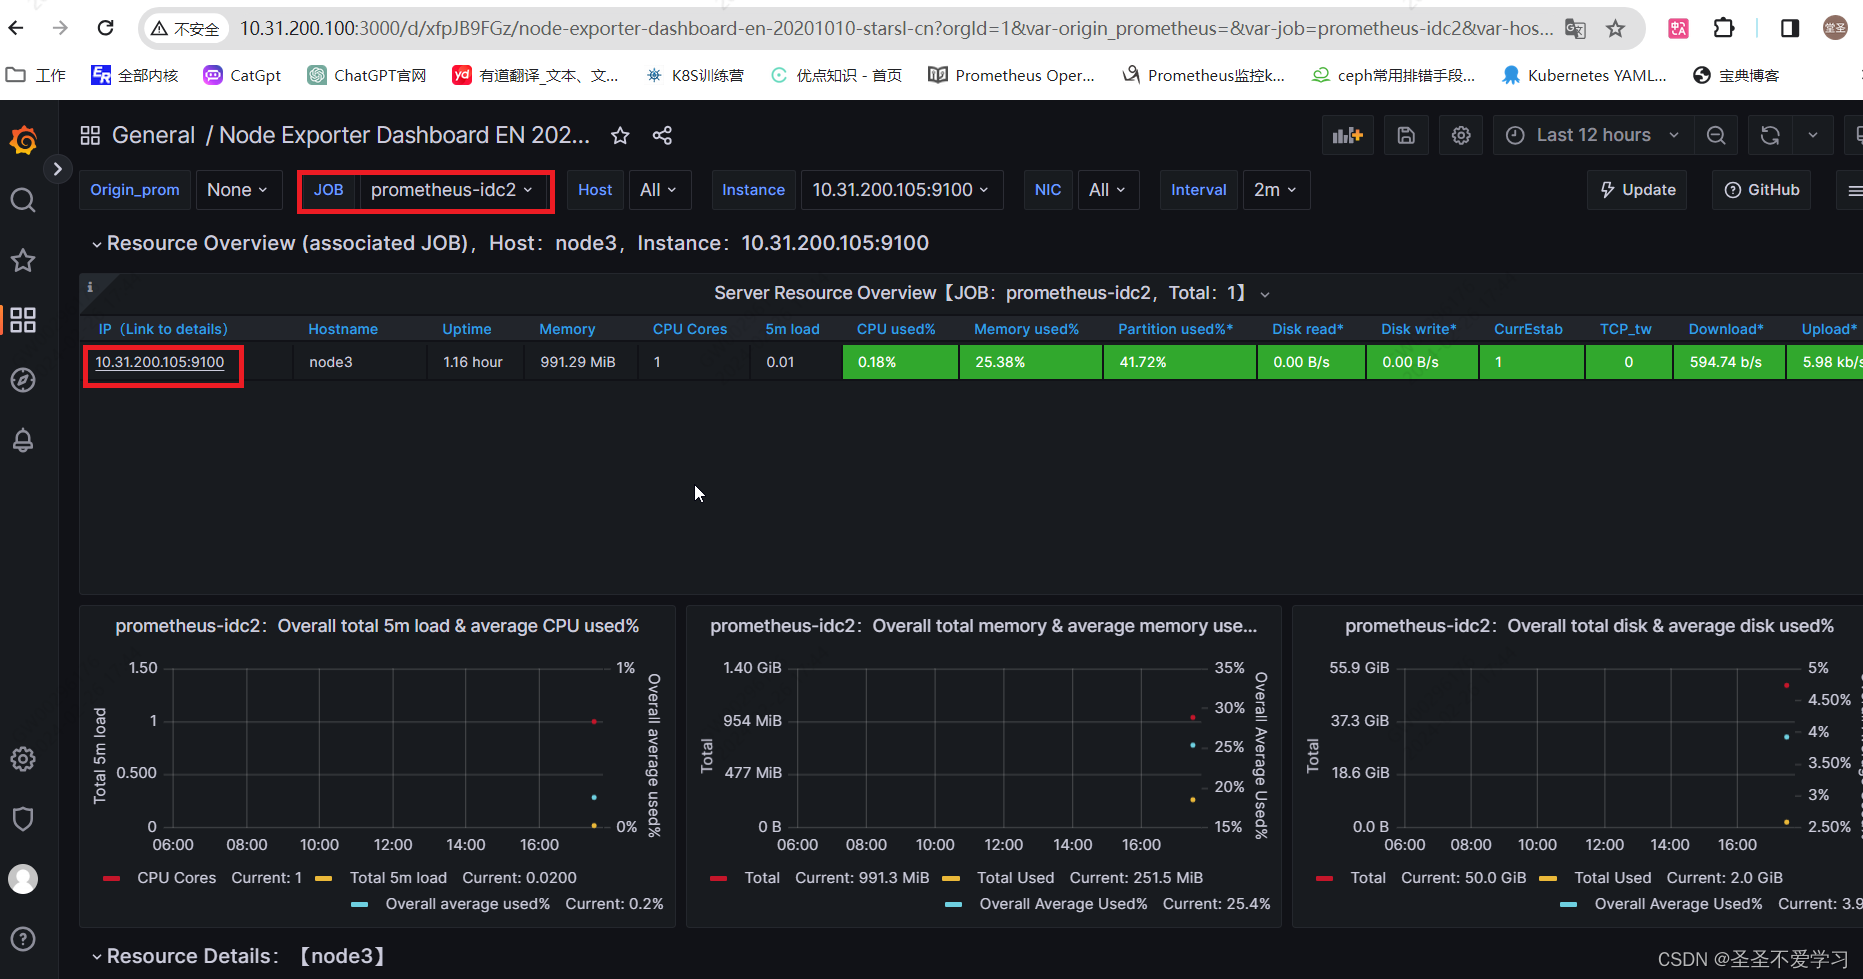
- job_name: "prometheus-idc2" # 添加监控节点
static_configs:
- targets: ["10.31.200.105:9100"]
[root@prometheus-federation-2 ~]# systemctl restart prometheus.service
2.3.2 配置prometheus server监控联邦节点
2.3.2.1 调整配置
[root@prometheus-server prometheus]# cat prometheus.yml
global:
scrape_interval: 15s
evaluation_interval: 15s
alerting:
alertmanagers:
- static_configs:
- targets:
rule_files:
scrape_configs:
- job_name: "prometheus"
static_configs:
- targets: ["localhost:9090"]
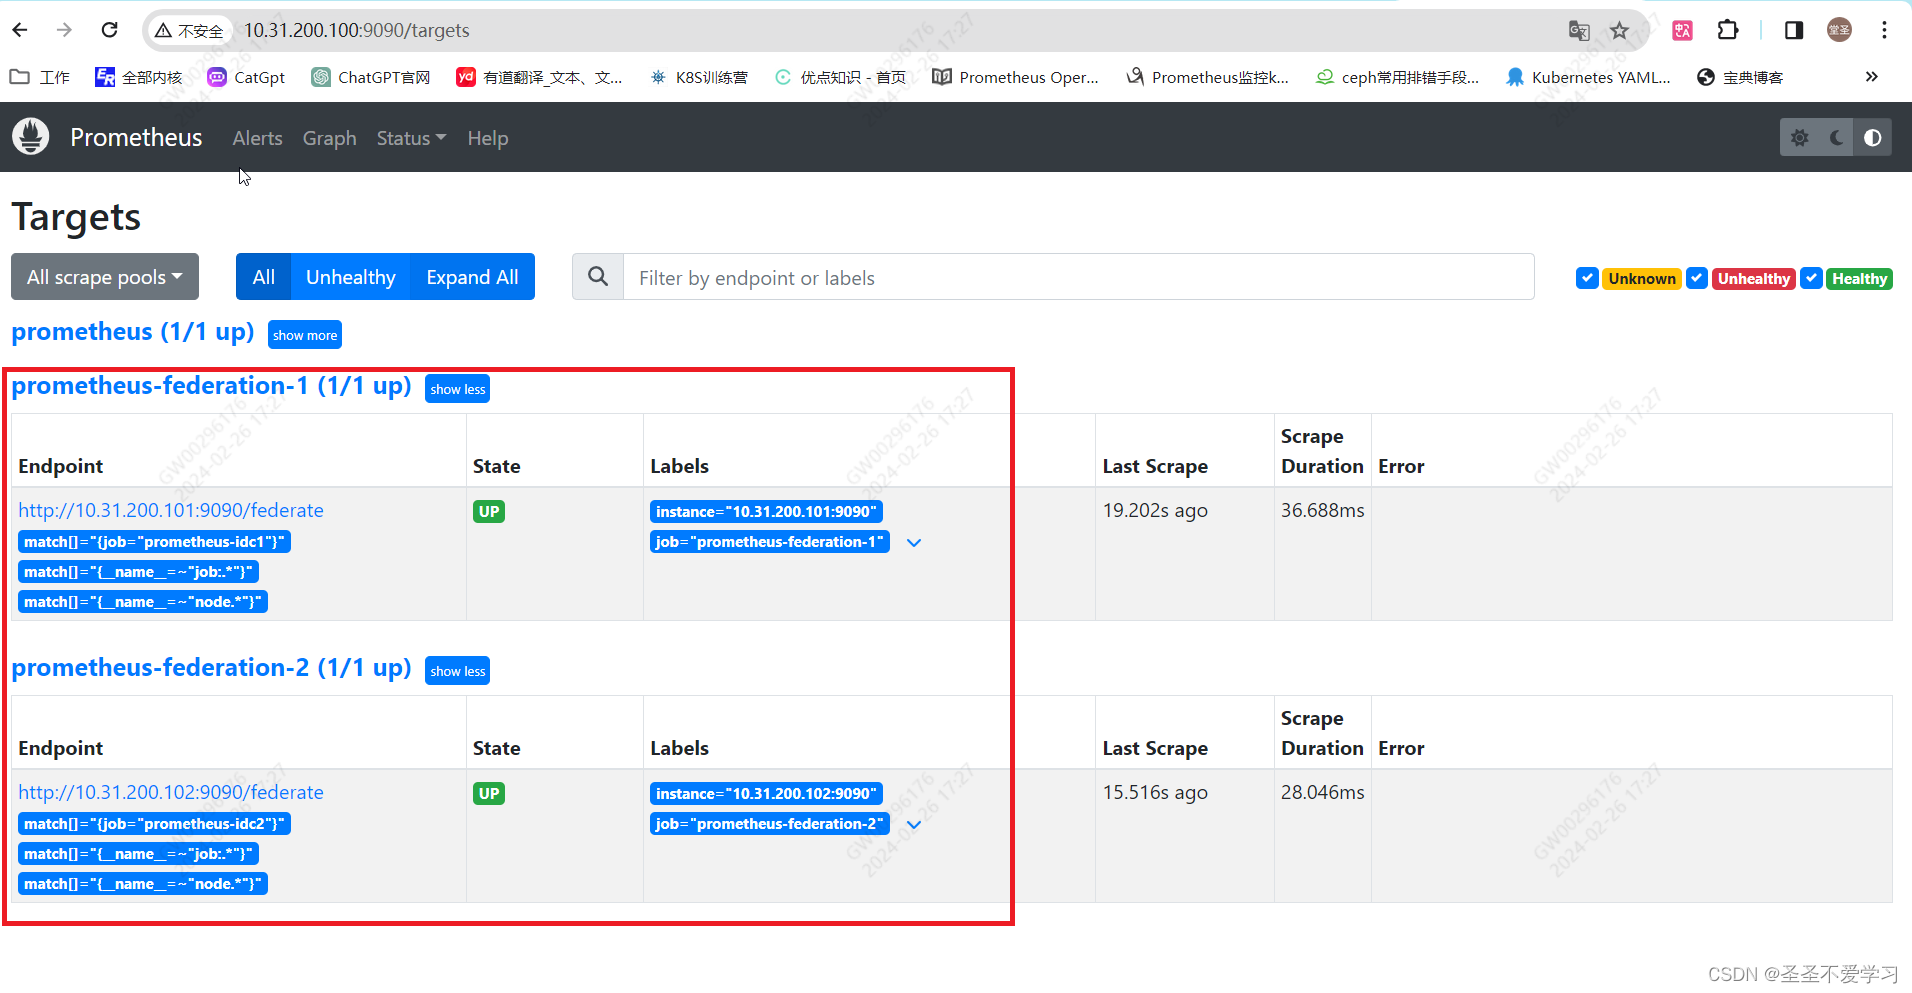
- job_name: "prometheus-federation-1" # 联邦节点1监控配置
scrape_interval: 10s
honor_labels: true # 保留原标签。防止prometheus收集数据后修改我们自定义的标签(prometheus中存在相同数据,那么这个标签不会被更新,添加honor_labels参数可以避免标签被覆盖)。
metrics_path: /federate # 通过该接口收集联邦节点的指标数据(该接口不能直接访问,命令行访问需要传参)。
params: # 定义访问/federate接口时的参数
'match[]':
- '{job="prometheus-idc1"}' # 匹配job是prometheus-idc1的
- '{__name__=~"job:.*"}' # 匹配名称是job:.*的
- '{__name__=~"node.*"}' # 匹配名称是node.*的
static_configs:
- targets:
- '10.31.200.101:9090'
- job_name: "prometheus-federation-2" # 联邦节点2监控配置
scrape_interval: 10s
honor_labels: true
metrics_path: /federate
params:
'match[]':
- '{job="prometheus-idc2"}'
- '{__name__=~"job:.*"}'
- '{__name__=~"node.*"}'
static_configs:
- targets:
- '10.31.200.102:9090'
[root@prometheus-server prometheus]# systemctl restart prometheus.service
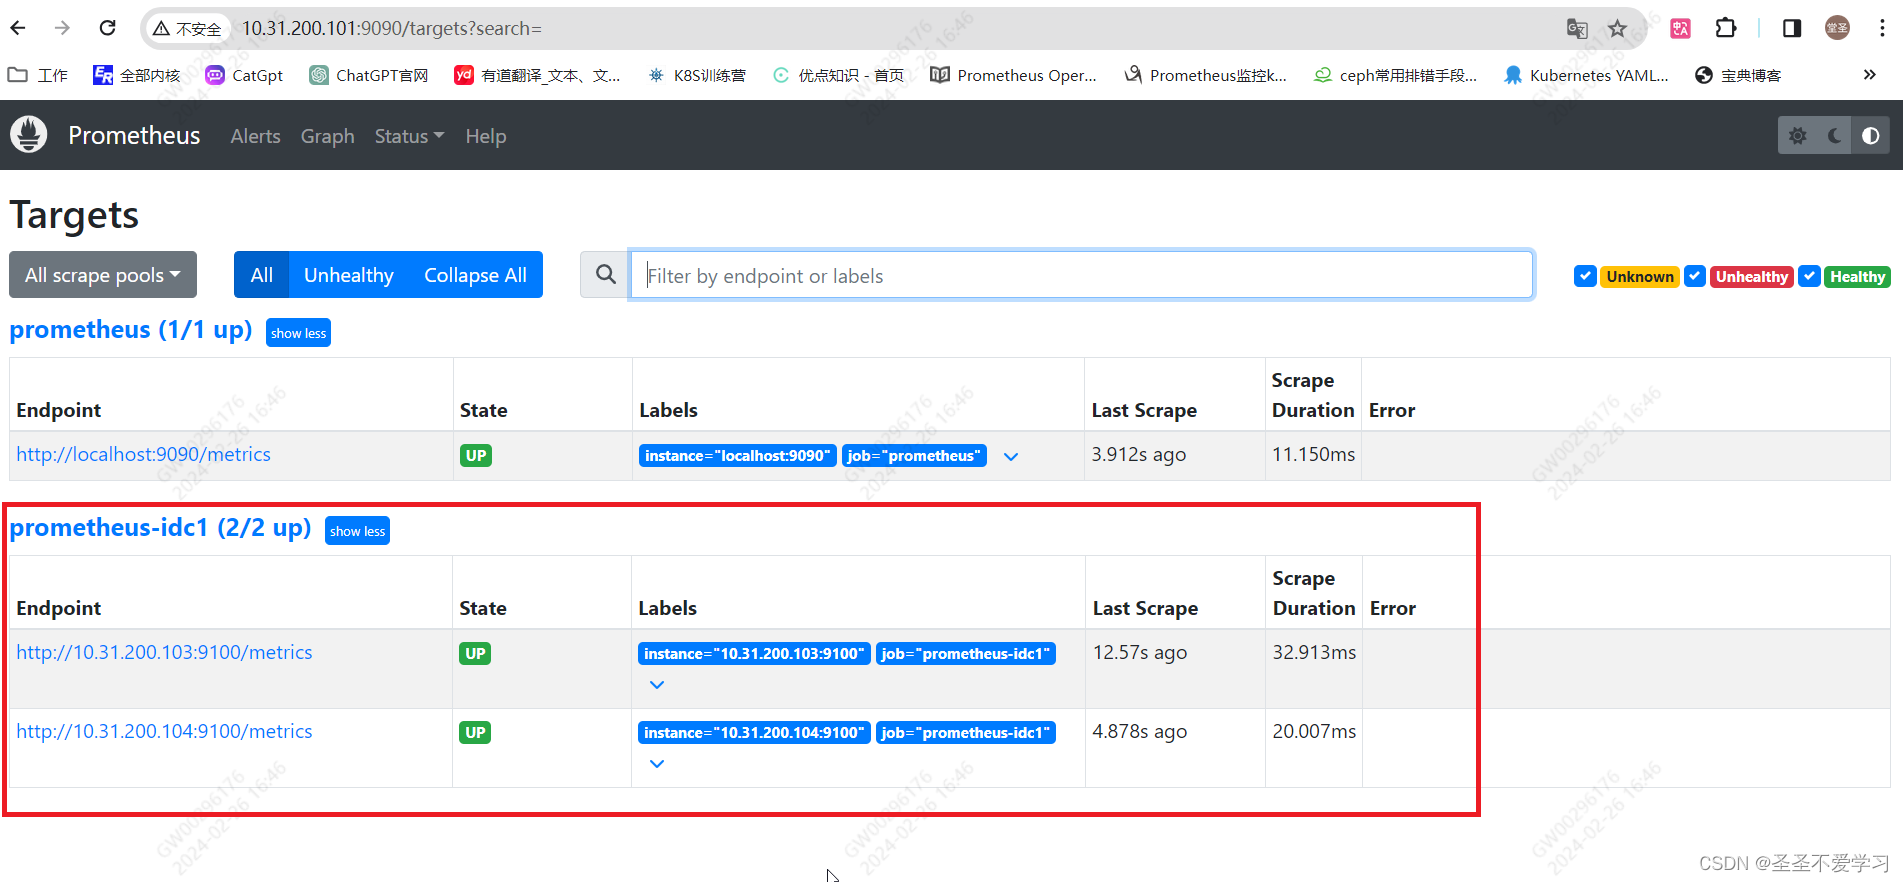
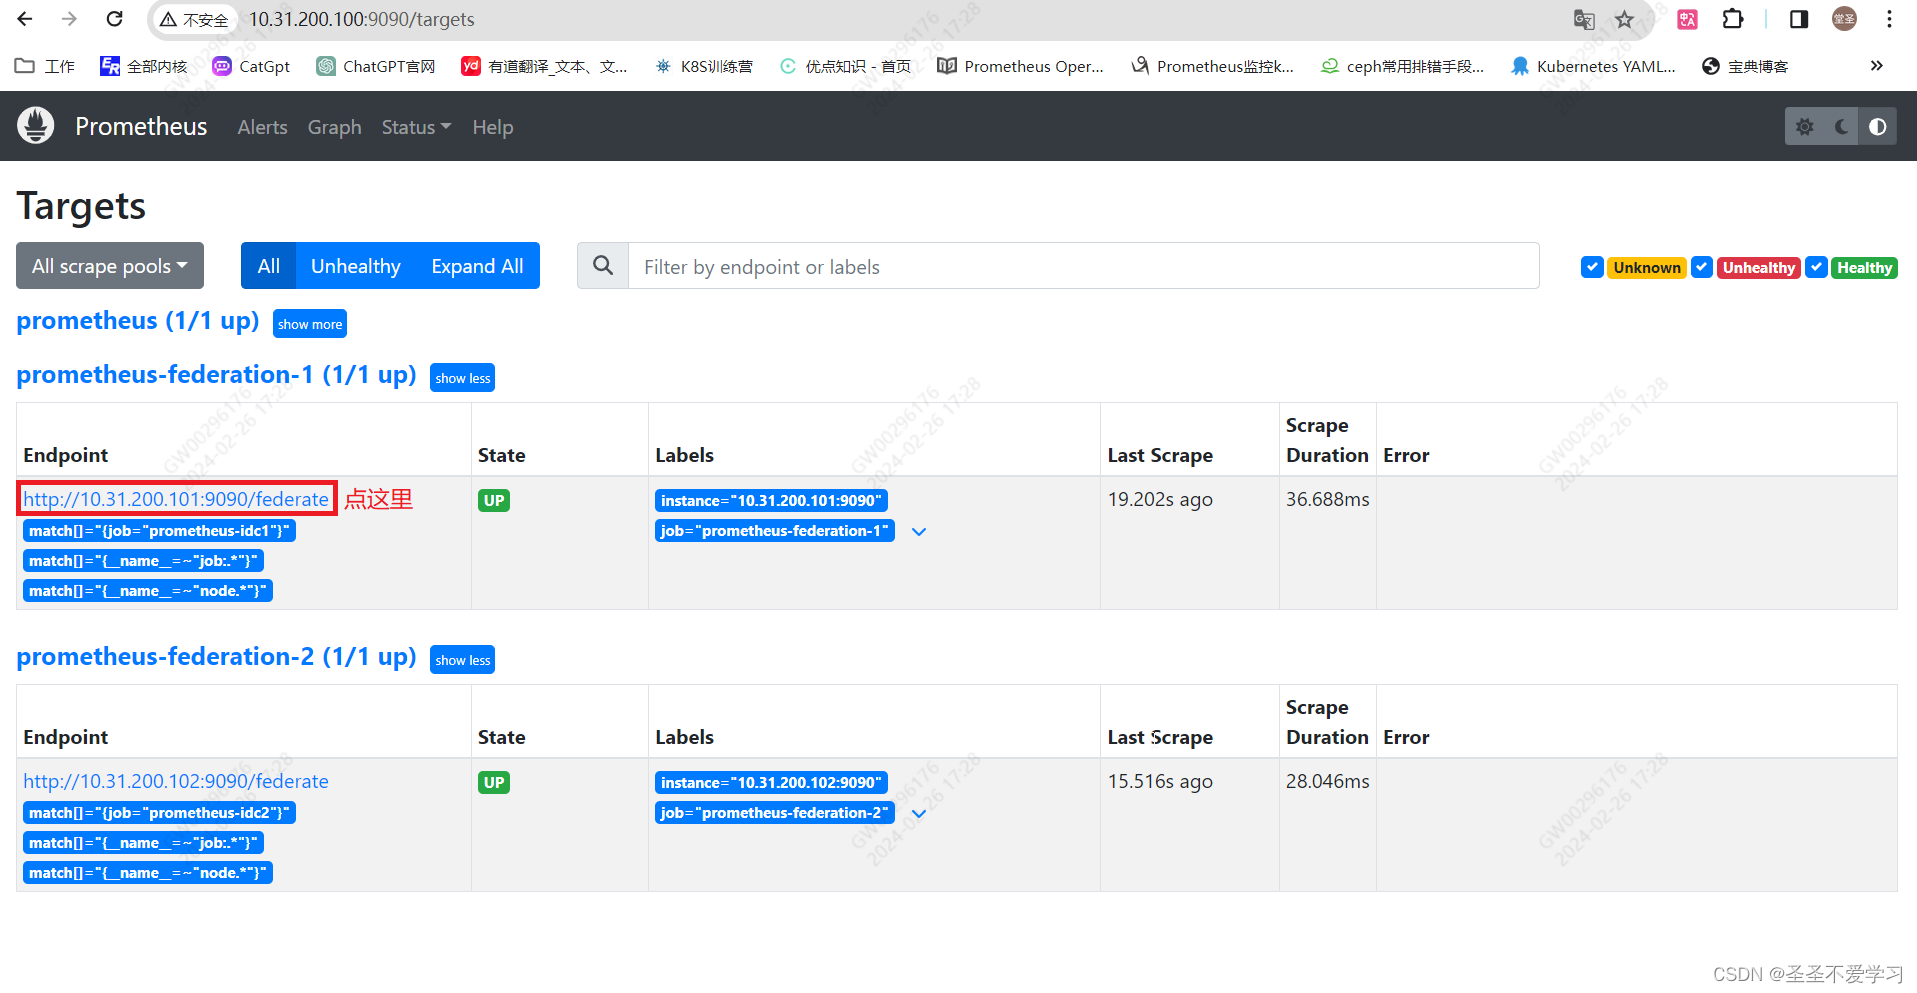
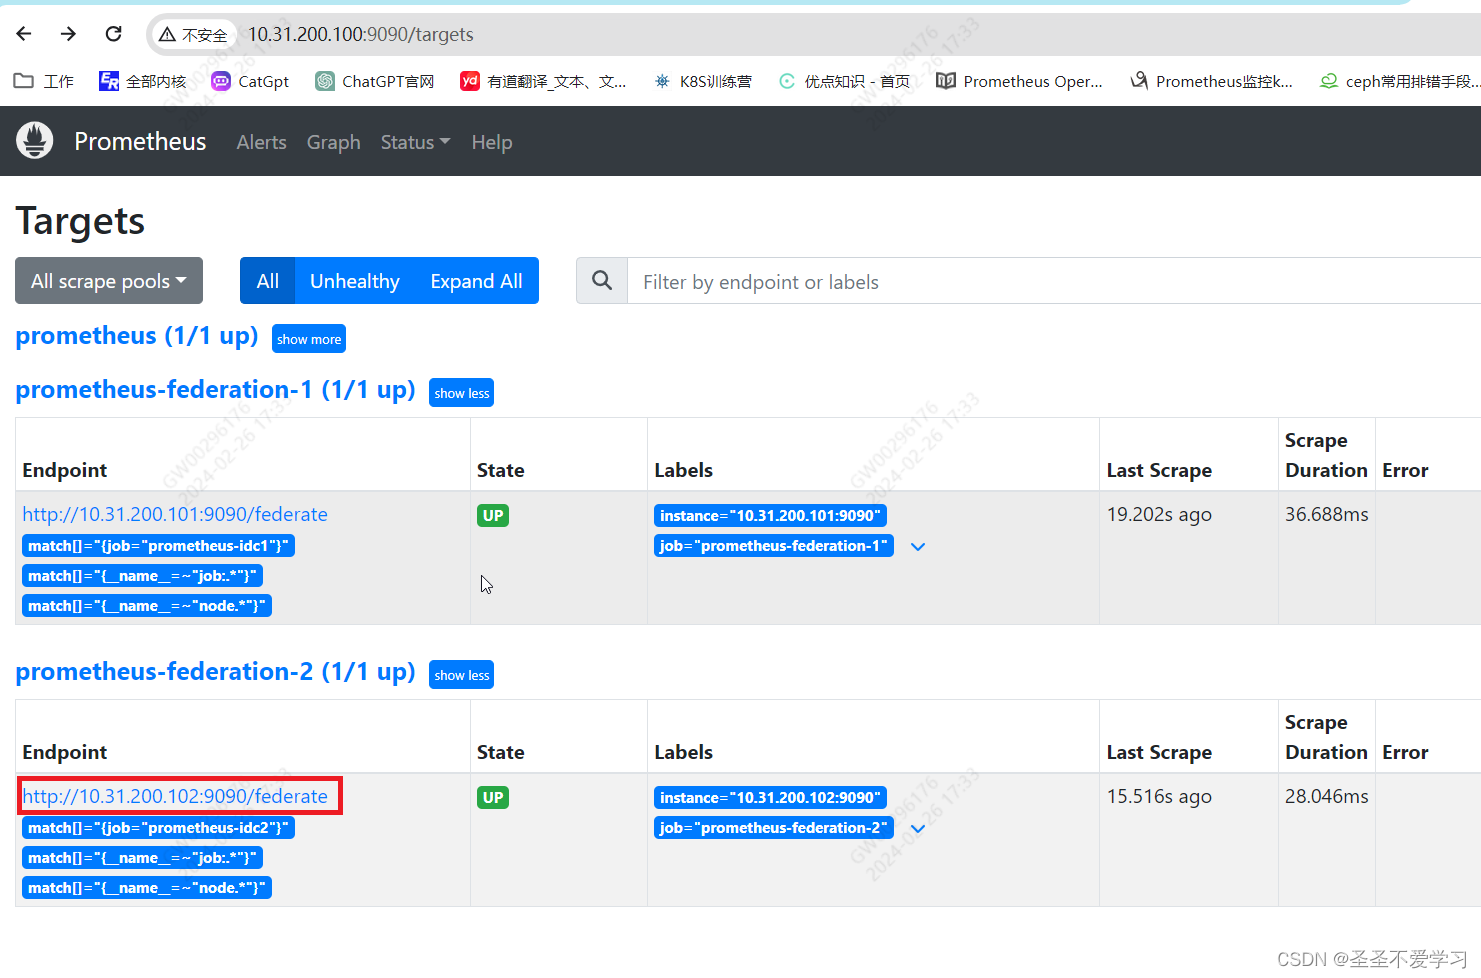
2.3.2.2 web页面查看配置是否生效
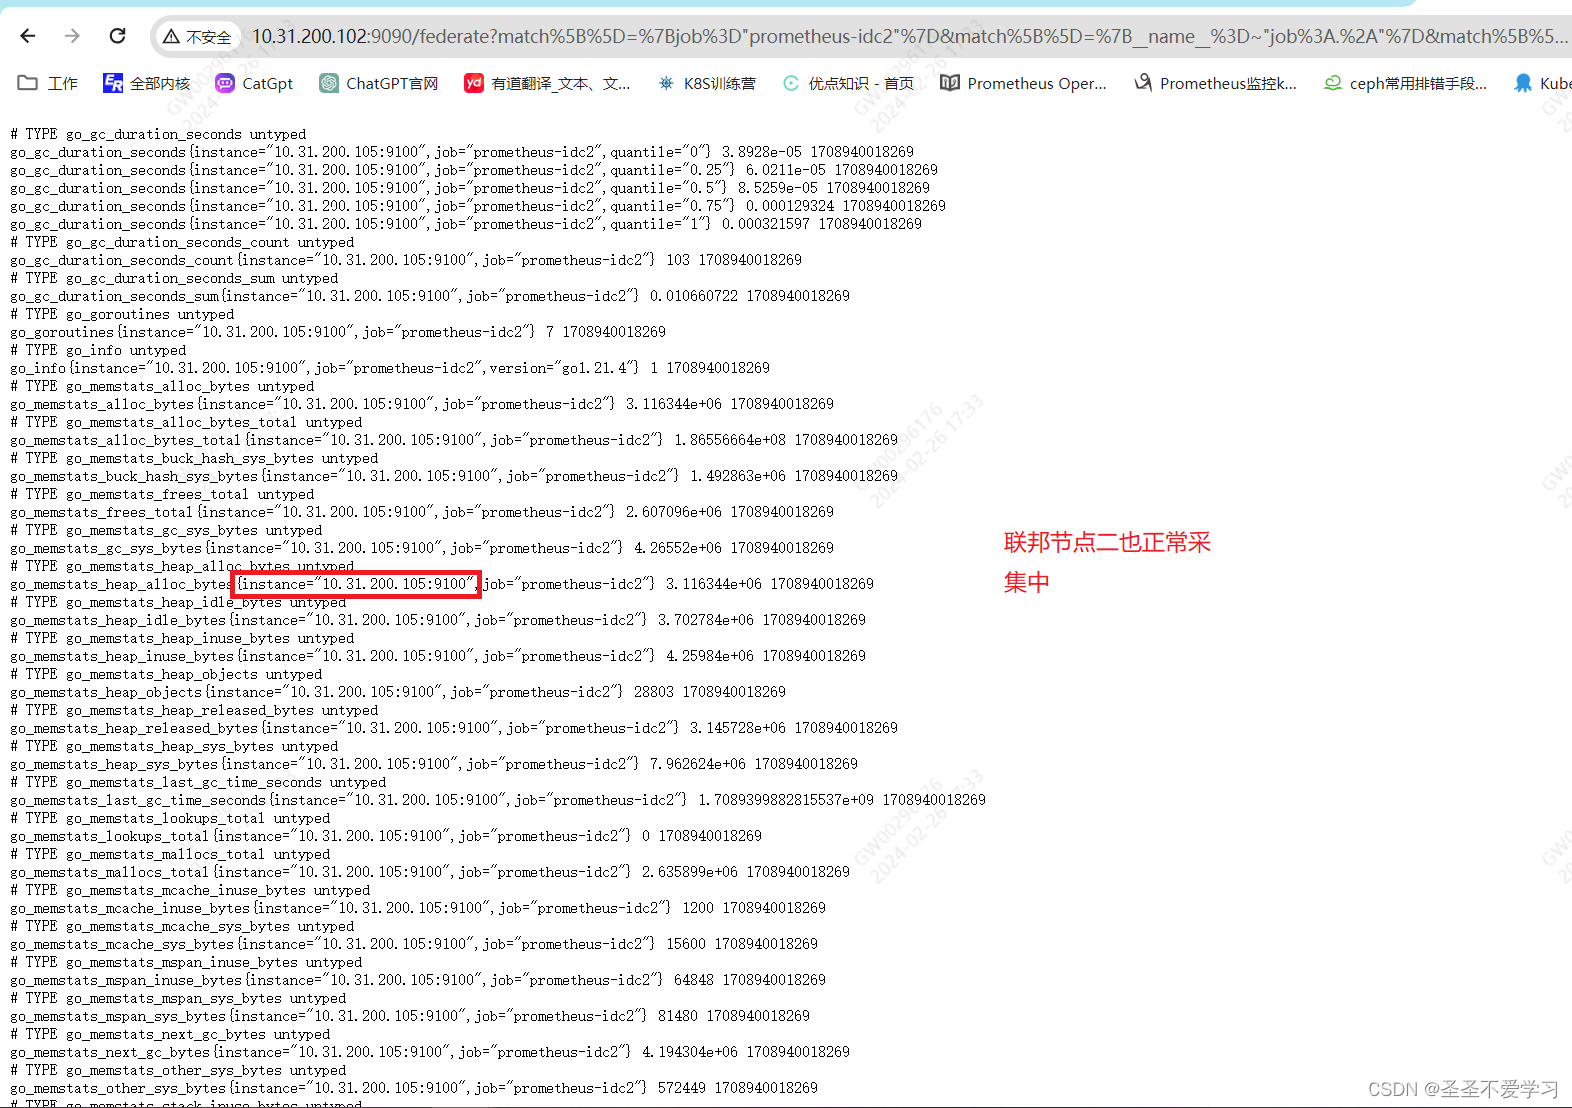
2.3.2.3 web页面查看数据是否采集成功
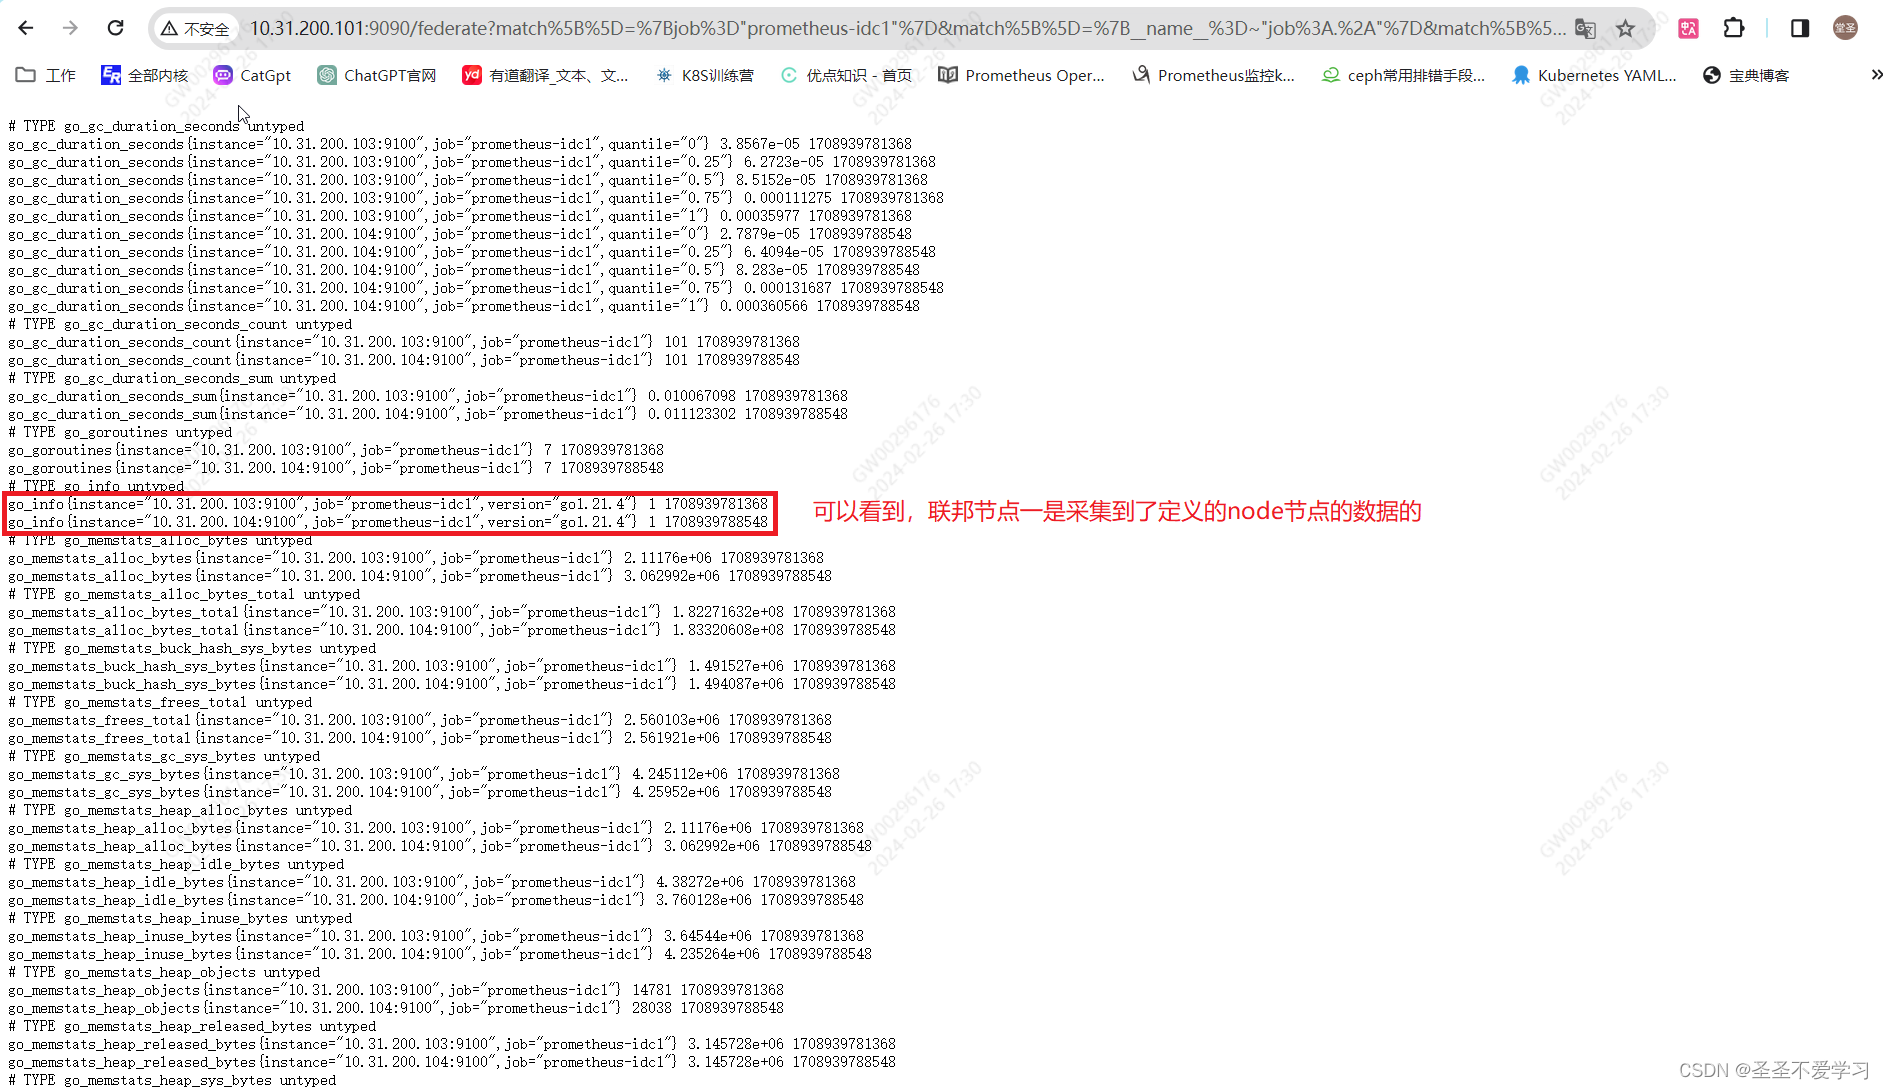
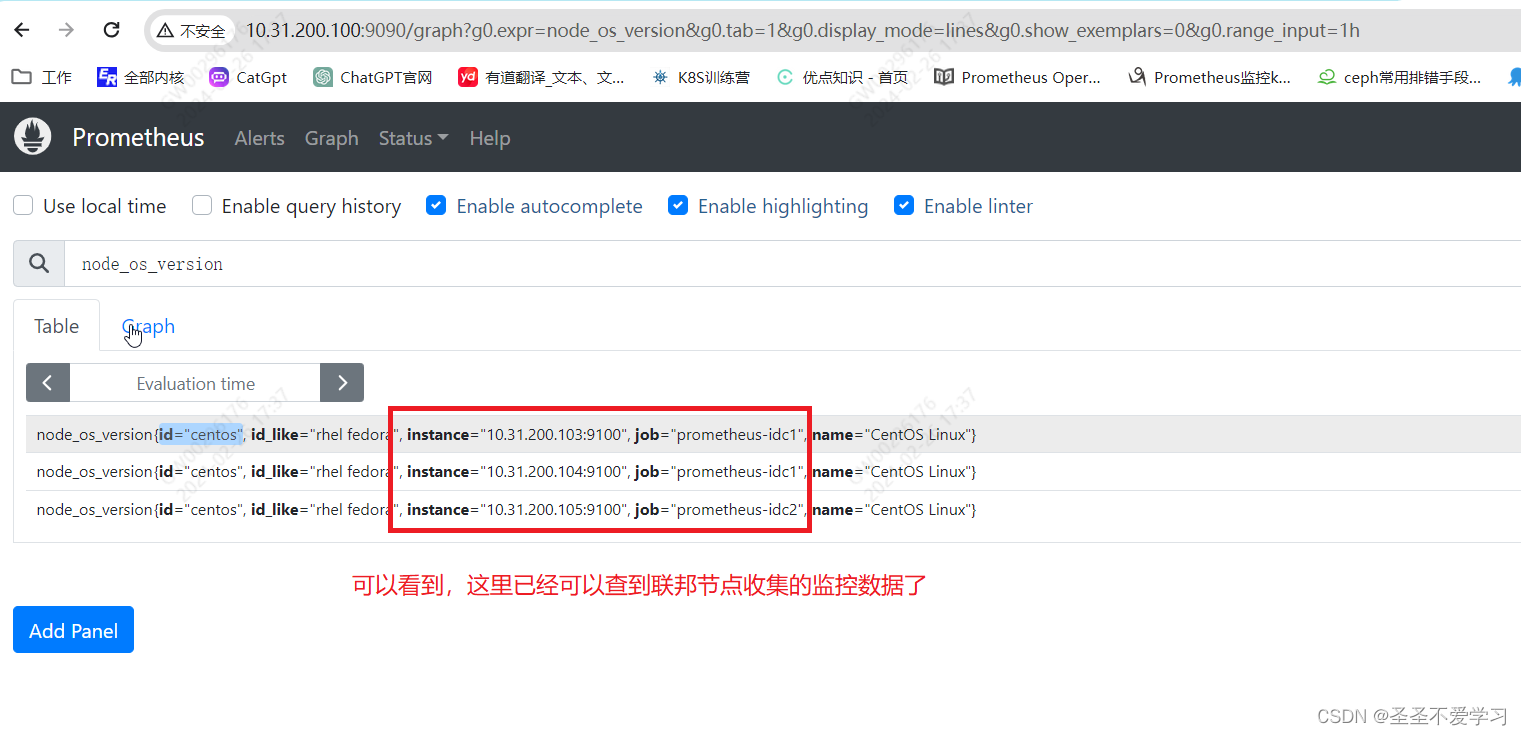
2.3.3 prometheus server查询联邦节点收集的数据


发表评论