一、数据集分析
该手写数据为sklearn内置数据集,导入数据集:
from sklearn.datasets import load_digits1.1 数据集规格
- 1797个样本,每个样本包括8*8像素的图像和一个[0, 9]整数的标签
- 数据集data中,每一个样本均有64个数据位float64型。
- 关于手写数字识别问题:通过训练一个8x8 的手写数字图片中每个像素点不同的灰度值,来判定数字,是一个分类问题.
内置文件来自作者的解说:
    """load and return the digits dataset (classification).

    each datapoint is a 8x8 image of a digit.

    =================   ==============
    classes                         10
    samples per class             ~180
    samples total                 1797
    dimensionality                  64
    features             integers 0-16
    =================   ==============

    this is a copy of the test set of the uci ml hand-written digits datasets
    https://archive.ics.uci.edu/ml/datasets/optical+recognition+of+handwritten+digits

    read more in the :ref:`user guide <digits_dataset>`.

    parameters
    ----------
    n_class : int, default=10
        the number of classes to return. between 0 and 10.

    return_x_y : bool, default=false
        if true, returns ``(data, target)`` instead of a bunch object.
        see below for more information about the `data` and `target` object.

        .. versionadded:: 0.18

    as_frame : bool, default=false
        if true, the data is a pandas dataframe including columns with
        appropriate dtypes (numeric). the target is
        a pandas dataframe or series depending on the number of target columns.
        if `return_x_y` is true, then (`data`, `target`) will be pandas
        dataframes or series as described below.

        .. versionadded:: 0.23

    returns
    -------
    data : :class:`~sklearn.utils.bunch`
        dictionary-like object, with the following attributes.

        data : {ndarray, dataframe} of shape (1797, 64)
            the flattened data matrix. if `as_frame=true`, `data` will be
            a pandas dataframe.
        target: {ndarray, series} of shape (1797,)
            the classification target. if `as_frame=true`, `target` will be
            a pandas series.
        feature_names: list
            the names of the dataset columns.
        target_names: list
            the names of target classes.

            .. versionadded:: 0.20

        frame: dataframe of shape (1797, 65)
            only present when `as_frame=true`. dataframe with `data` and
            `target`.

            .. versionadded:: 0.23
        images: {ndarray} of shape (1797, 8, 8)
            the raw image data.
        descr: str
            the full description of the dataset.

    (data, target) : tuple if ``return_x_y`` is true
        a tuple of two ndarrays by default. the first contains a 2d ndarray of
        shape (1797, 64) with each row representing one sample and each column
        representing the features. the second ndarray of shape (1797) contains
        the target samples.  if `as_frame=true`, both arrays are pandas objects,
        i.e. `x` a dataframe and `y` a series.

        .. versionadded:: 0.18

    examples
    --------
    to load the data and visualize the images::

        >>> from sklearn.datasets import load_digits
        >>> digits = load_digits()
        >>> print(digits.data.shape)
        (1797, 64)
        >>> import matplotlib.pyplot as plt
        >>> plt.gray()
        >>> plt.matshow(digits.images[0])
        <...>
        >>> plt.show()
"""翻译(翻译的一言难尽,将就一下吧![]() ):
):
1.2 加载数据
# 获取数据集数据和标签
datas = load_digits()
x_data = datas.data
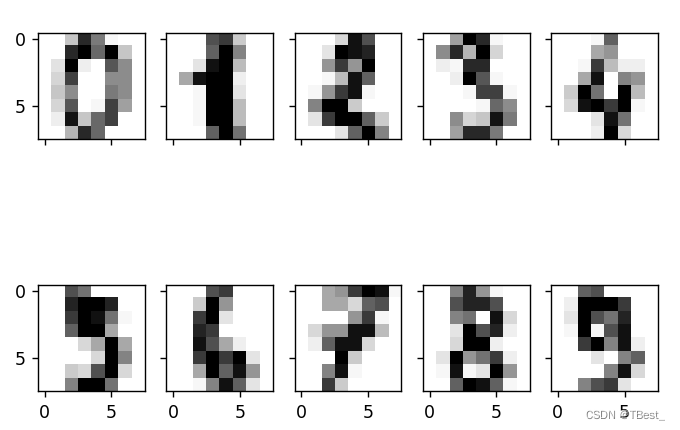
y_data = datas.target1.3 展示数据集中前十个数据
代码:
from matplotlib import pyplot as plt

#  展示前十个数据的图像
fig, ax = plt.subplots(
    nrows=2,
    ncols=5,
    sharex=true,
    sharey=true, )
ax = ax.flatten()
for i in range(10):
    ax[i].imshow(datas.data[i].reshape((8, 8)), cmap='greys', interpolation='nearest')
plt.show()
图像:
二、数据处理
2.1 划分数据集
# 划分数据集
x_train, x_test, y_train, y_test = train_test_split(x_data, y_data, test_size=0.3)
三、建立模型
3.1 逻辑回归
3.1.1 logisticregression()主要参数
3.2 建立逻辑回归模型
# 建立逻辑回归模型
model = logisticregression(max_iter=10000, random_state=42, multi_class='multinomial')

# 训练模型
model.fit(x_train, y_train)
四、模型评估
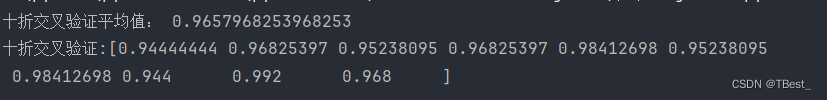
4.1 十折交叉验证
scores = cross_val_score(model, x_train, y_train, cv=10)  # 十折交叉验证
k = 0
for i in scores:
    k += i
print("十折交叉验证平均值:", k / 10)
print(f"十折交叉验证:{scores}\n")
结果:
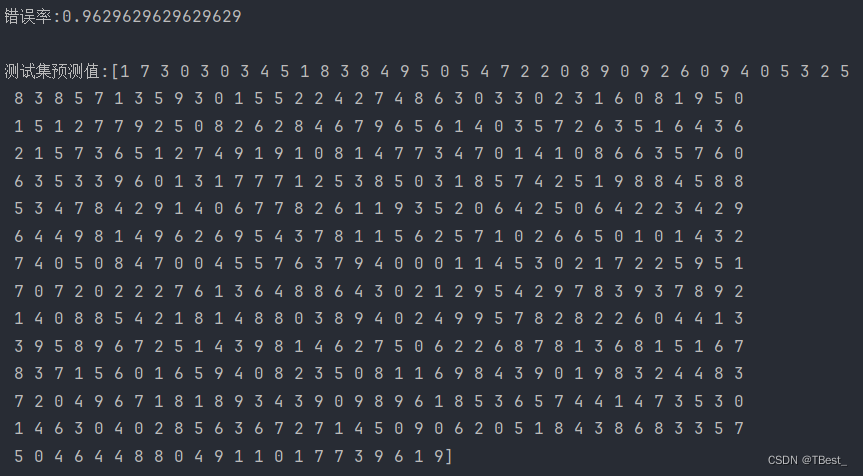
4.2 错误率
y_pred = model.predict(x_test)
error_rate = model.score(x_test, y_test)

print(f"错误率:{error_rate}\n")
print(f"测试集预测值:{y_pred}\n")
结果:
五、源码
from sklearn.linear_model import logisticregression

from sklearn.datasets import load_digits
from sklearn.model_selection import cross_val_score, train_test_split
from matplotlib import pyplot as plt

# 获取数据集数据和标签
datas = load_digits()
x_data = datas.data
y_data = datas.target

#  展示前十个数据的图像
fig, ax = plt.subplots(
    nrows=2,
    ncols=5,
    sharex=true,
    sharey=true, )
ax = ax.flatten()
for i in range(10):
    ax[i].imshow(datas.data[i].reshape((8, 8)), cmap='greys', interpolation='nearest')
plt.show()

# 划分数据集
x_train, x_test, y_train, y_test = train_test_split(x_data, y_data, test_size=0.3)
# 建立逻辑回归模型
model = logisticregression(max_iter=10000, random_state=42, multi_class='multinomial')
scores = cross_val_score(model, x_train, y_train, cv=10)  # 十折交叉验证
k = 0
for i in scores:
    k += i
print("十折交叉验证平均值:", k / 10)
model.fit(x_train, y_train)
y_pred = model.predict(x_test)
error_rate = model.score(x_test, y_test)

print(f"十折交叉验证:{scores}\n")
print(f"错误率:{error_rate}\n")
print(f"测试集预测值:{y_pred}\n")


发表评论