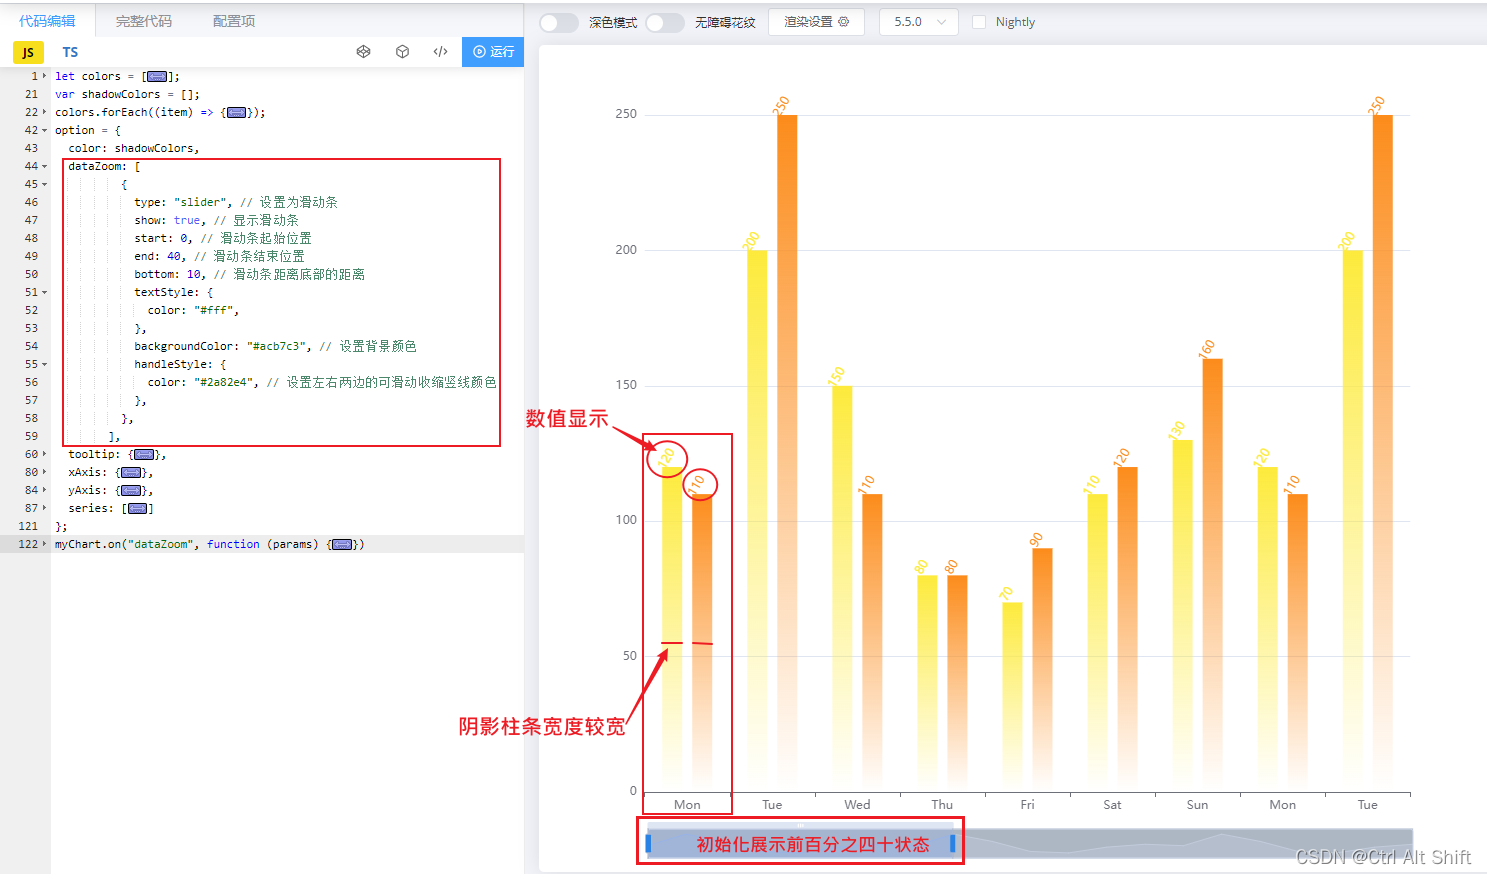
当数值过多时,显示所有柱条看着会很凌乱且文字会挤在一起,于是就需要监听datazoom的滑动,拿到对应的阈值后做出相应的配置。
“datazoom” 事件通常用于响应用户对图表进行数据缩放的操作。
这里是datazoom官网api地址:点击跳转至官网文档的datazoom介绍
初始时状态如下图:
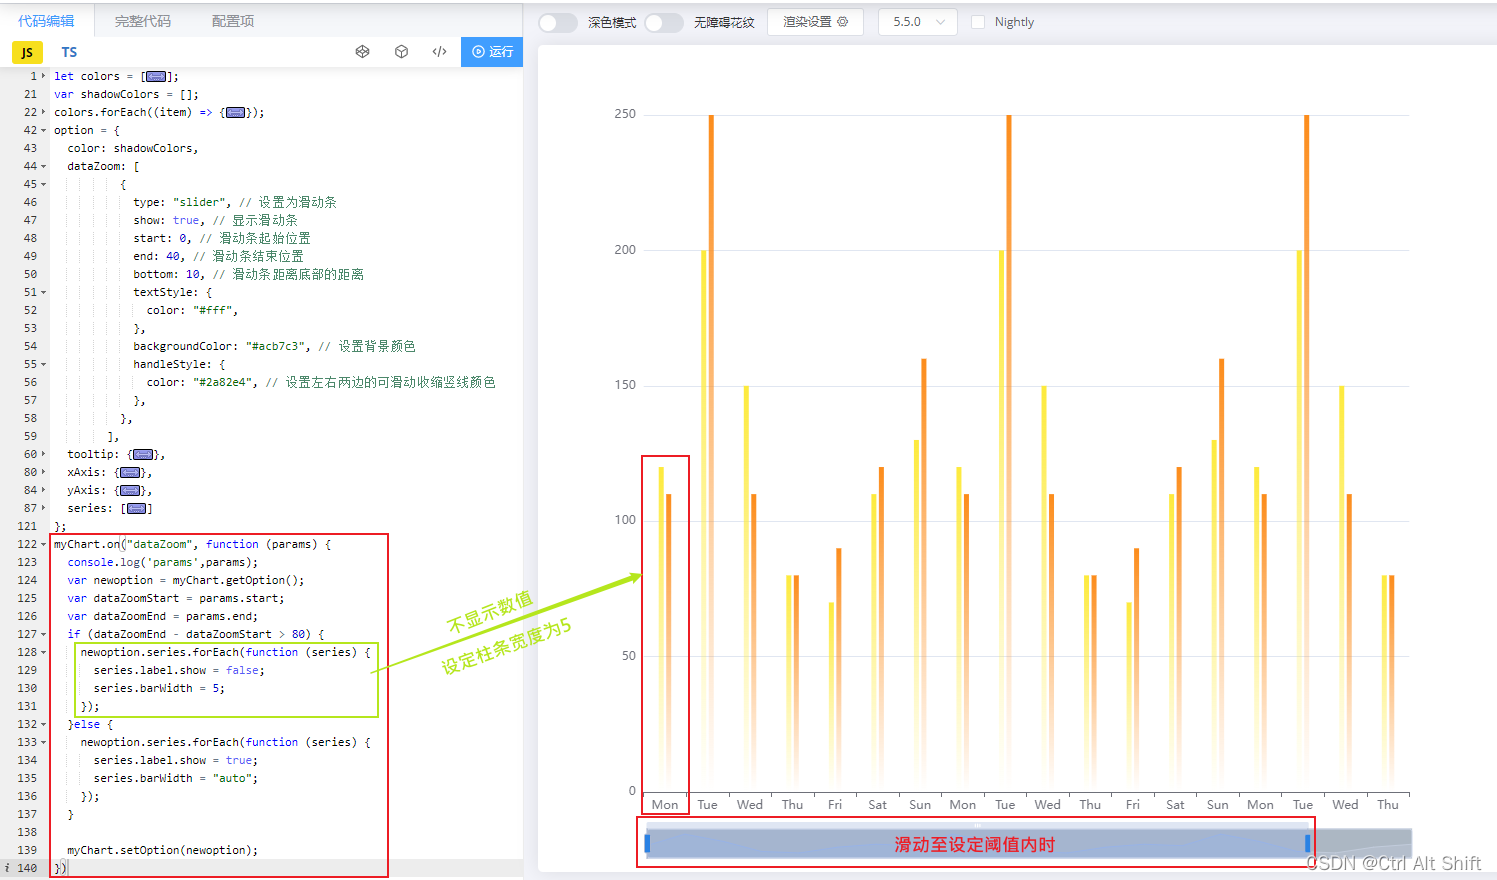
滑动x轴至设定范围内时:
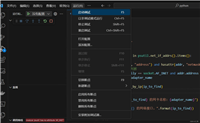
监听datazoom
mychart为图表元素,在 “datazoom” 事件上绑定了一个回调函数,当用户在图表上使用数据缩放时,这个回调函数会被触发。
import * as echarts from 'echarts';
var chartdom = document.getelementbyid('main');
var mychart = echarts.init(chartdom);

mychart.on("datazoom", function (params) {
})
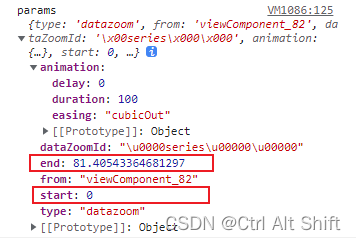
params值
这里可以获取到当前datazoom的开始位置(start)和结束位置(end)
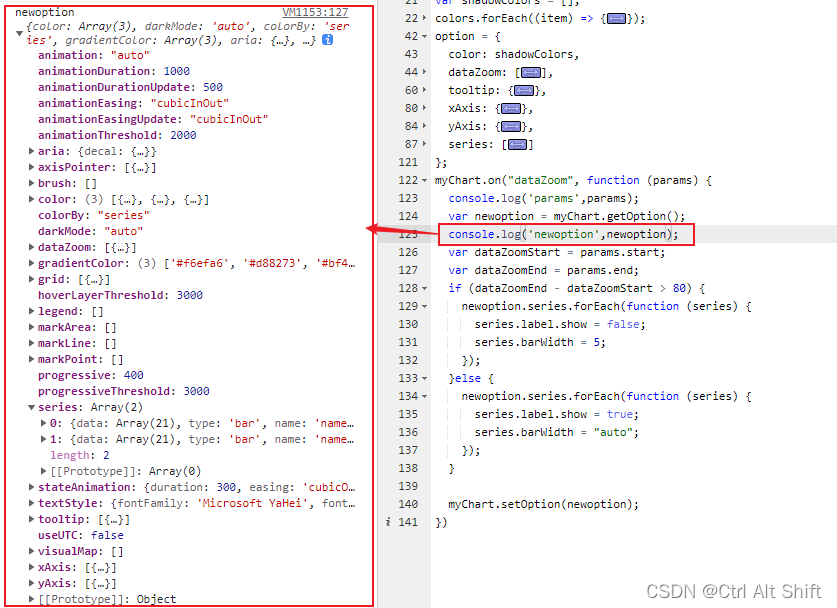
获取图表的option
mychart.getoption() 和 mychart.setoption(newoption) 是 echarts 中常用的两个方法,它们分别用于获取当前图表的配置选项和设置新的配置选项。
以下为mychart.getoption()返回的值,若有其他需要控制的,都可以举一反三,根据这些值的位置对其进行设置,不局限于本文的控制柱条的宽度以及数值的显示隐藏。
控制柱条宽度及数值的显示与隐藏
这里通过循环图表的option配置中的series数组,设置其数值文本是否显示,以及柱条宽度
series.label.show 和 series.barwidth
// 在用户使用数据缩放时触发该事件
mychart.on('datazoom', function (params) {
  // 输出参数信息到控制台
  console.log('params', params);

  // 获取当前图表的配置选项
  var newoption = mychart.getoption();

  // 获取数据缩放的起始位置和结束位置
  var datazoomstart = params.start;
  var datazoomend = params.end;

  // 根据数据缩放的范围对图表进行调整
  if (datazoomend - datazoomstart > 80) {
    // 如果数据缩放范围大于80,设置柱状图的标签不显示并设置柱状宽度为5
    newoption.series.foreach(function (series) {
      series.label.show = false;//隐藏顶部数值
      series.barwidth = 5;//柱条宽度为5
    });
  } else {
    // 如果数据缩放范围小于等于80,设置柱状图的标签显示并设置柱状宽度为'auto'
    newoption.series.foreach(function (series) {
      series.label.show = true;//显示顶部数值
      series.barwidth = 'auto';//柱条宽度自适应
    });
  }

  // 根据调整后的配置选项更新图表
  mychart.setoption(newoption);
});

// 设置图表的初始配置选项
option && mychart.setoption(option);
全部代码(echarts示例可直接粘贴使用)
let colors = [
          {
            color: {
              botom: "rgba(253, 234, 60,0)",
              top: "rgba(253, 234, 60,1)",
            },
          },
          {
            color: {
              botom: "rgba(252, 140, 27,0)",
              top: "rgba(252, 140, 27,1)",
            },
          },
          {
            color: {
              botom: "rgba(100, 218, 217,0)",
              top: "rgba(100, 218, 217,1)",
            },
          },
];
var shadowcolors = [];
colors.foreach((item) => {
        var colorobj = {
          type: "linear",
          x: 0,
          y: 1,
          x2: 0,
          y2: 0,
          colorstops: [
            {
              offset: 0,
              color: item.color.botom, // 0% 处的颜色
            },
            {
              offset: 1,
              color: item.color.top, // 100% 处的颜色
            },
          ],
        };
        shadowcolors.push(colorobj);
});
console.log('shadowcolors',shadowcolors);
option = {
  color: shadowcolors,
  datazoom: [
          {
            type: "slider", // 设置为滑动条
            show: true, // 显示滑动条
            start: 0, // 滑动条起始位置
            end: 40, // 滑动条结束位置
            bottom: 10, // 滑动条距离底部的距离
            textstyle: {
              color: "#fff",
            },
            backgroundcolor: "#acb7c3", // 设置背景颜色
            handlestyle: {
              color: "#2a82e4", // 设置左右两边的可滑动收缩竖线颜色
            },
          },
        ],
  tooltip: {
          trigger: "axis",
          axispointer: {
            type: "shadow", // 显示阴影指示器
          },
          formatter: function (indexs) {
            var data = [];
            indexs.foreach((item) => {
              data.push({
                  seriesname: item.seriesname,
                  value: item.value,
              });
            });
            var content = "";
            data.foreach((item) => {
              content += item.seriesname + ": " + item.value + "<br>";
            });
            return content;
          },
        },
  xaxis: {
    type: 'category',
    data: ['mon', 'tue', 'wed', 'thu', 'fri', 'sat', 'sun','mon', 'tue', 'wed', 'thu', 'fri', 'sat', 'sun','mon', 'tue', 'wed', 'thu', 'fri', 'sat', 'sun']
  },
  yaxis: {
    type: 'value'
  },
  series: [
    {
      data: [120, 200, 150, 80, 70, 110, 130,120, 200, 150, 80, 70, 110, 130,120, 200, 150, 80, 70, 110, 130],
      type: 'bar',
      name:'name1',
      barwidth: 10,
      bargap: 1, //柱子之间间距
      label: {
        show: true,
        position: "top",
        color: "white",
        rotate: 60,
        textstyle: {
          color: colors[0].color.top
        },
      },
    },
    {
      data: [110, 250, 110, 80, 90, 120, 160,110, 250, 110, 80, 90, 120, 160,110, 250, 110, 80, 90, 120, 160],
      type: 'bar',
      name:'name2',
      barwidth: 10,
      bargap: 1, //柱子之间间距
      label: {
        show: true,
        position: "top",
        color: "white",
        rotate: 60,
        textstyle: {
          color: colors[1].color.top
        },
      },
    },
    {
      data: [20, 220, 140, 70, 70, 100, 30,20, 220, 140, 70, 70, 100, 30,20, 220, 140, 70, 70, 100, 30],
      type: 'bar',
      name:'name3',
      barwidth: 10,
      bargap: 1, //柱子之间间距
      label: {
        show: true,
        position: "top",
        color: "white",
        rotate: 60,
        textstyle: {
          color: colors[2].color.top
        },
      },
    },
  ]
};
mychart.on("datazoom", function (params) {
  var newoption = mychart.getoption();
  var datazoomstart = params.start;
  var datazoomend = params.end;
  if (datazoomend - datazoomstart > 70) {
    newoption.series.foreach(function (series) {
      series.label.show = false;
    });
  }else {
    newoption.series.foreach(function (series) {
      series.label.show = true;
    });
  }

  mychart.setoption(newoption);
})

发表评论