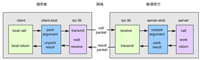
一、简介
今天是《net 高级调试》的第七篇文章。上一篇文章我们说了值类型,引用类型,数组等的内存表现形式。有了这个基础,我们可以更好的了解我们的程序在运行时的状态,内存里有什么东西,它们的结构组成是什么样子的,对我们调试程序是更有帮助的。今天,我们要说一些和线程有关的话题,虽然和线程相关,但是不是多线程的知识,不是线程安全的知识。今天我们讨论的是如何查看线程,它的表现形式,以及线程的调用栈,调用栈,又分为托管线程的调用栈和非托管线程的调用栈,这些也是我们高级调试必须掌握的。有了这些基础,我们就知道了程序的开始端点,调试的起点我们就找到了。虽然这些都是基础,如果这些掌握不好,以后的高级调试的道路,也不好走。当然了,第一次看视频或者看书,是很迷糊的,不知道如何操作,还是那句老话,一遍不行,那就再来一遍,还不行,那就再来一遍,俗话说的好,书读千遍,其意自现。
如果在没有说明的情况下,所有代码的测试环境都是 net framewok 4.8,但是,有时候为了查看源码,可能需要使用 net core 的项目,我会在项目章节里进行说明。好了,废话不多说,开始我们今天的调试工作。
调试环境我需要进行说明,以防大家不清楚,具体情况我已经罗列出来。
操作系统:windows professional 10
调试工具:windbg preview(可以去microsoft store 去下载)
开发工具:visual studio 2022
net 版本:net framework 4.8
coreclr源码:源码下载
二、基础知识
1、线程类相关介绍
1.1、简介
在高级调试的过程中,很难不和 线程、线程栈 打交道,所以好好的学习并掌握有关线程操作的命令是很有必要的。
2、获取 线程列表 的命令
2.1、查看线程列表。
可以使用【!t】命令获取所有的托管线程。
2.2、使用 net 7.0 查看线程列表
可以使用【!t】命令获取所有的托管线程,如果我们想查看 clr 的线程对象的结构就只能使用开源版本了,这里使用net 7.0。
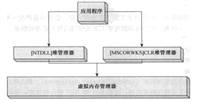
3、查看非托管线程栈
windbg 是随 windows 成长起来的非托管调试器,它自带的命令只能查看非托管调用栈,因为 c# 中的线程栈是托管函数,而托管函数是一种运行时编译的,所以这个命令往往看不到托管部分。
3.1、使用 k 命令查看非托管线程栈
【k】命令可以查看线程栈,但是没有办法显示托管函数,作为补充,可以使用【!clrstack】命令。
3.2、使用 kb 命令查看线程栈。
很多时候我们需要获取非托管函数的参数,这个时候我们可以使用【kb】命令。
3.3、查看托管函数栈
sos 提供了一个专门查看托管函数调用栈的命令,毕竟只有 jit更熟悉托管函数,也知道编译后的机器码放在什么位置。
这个命令就是【!clrstack】。
!clrstack -a:这个命令表示将线程栈中的所有局部变量和参数全部输出。
!clrstack -p:这个命令表示将线程栈中的参数全部输出。
!clrstack -l:这个命令表示将线程栈中的所有局部变量全部输出。
我们还可以查看所有托管线程栈,可以使用【~*e】命令。
3.4、查看托管和非托管合体
使用【!dumpstack】命令查看托管和非托管的线程栈。
3.5、执行所有线程的 dumpstack。
如果我们想查看所有线程的线程栈,可以使用【!eestack】,也可以使用【~*e !dumpstack】,结果是一样的。
三、测试过程
废话不多说,这一节是具体的调试操作的过程,又可以说是眼见为实的过程,在开始之前,我还是要啰嗦两句,这一节分为两个部分,第一部分是测试的源码部分,没有代码,当然就谈不上测试了,调试必须有载体。第二部分就是根据具体的代码来证实我们学到的知识,是具体的眼见为实。
1、测试源码
1.1、example_7_1_1


 1 namespace example_7_1_1
 2 {
 3     internal class program
 4     {
 5         static void main(string[] args)
 6         {
 7             int a = 10;
 8             int b = 11;
 9             test(12);
10             console.readline();
11         }
12
13         private static void test(int c)
14         {
15             task.run(() => { run1(); });
16             task.run(() => { run2(); });
17             task.run(() => { run3(); });
18         }
19
20         private static void run1()
21         {
22             console.writeline($"tid={environment.currentmanagedthreadid},run1 正在运行");
23             console.readline();
24             console.writeline($"tid={environment.currentmanagedthreadid},run1 结束运行");
25         }
26
27         private static void run2()
28         {
29             console.writeline($"tid={environment.currentmanagedthreadid},run2 正在运行");
30             console.readline();
31             console.writeline($"tid={environment.currentmanagedthreadid},run2 结束运行");
32         }
33
34         private static void run3()
35         {
36             console.writeline($"tid={environment.currentmanagedthreadid},run3 正在运行");
37             console.readline();
38             console.writeline($"tid={environment.currentmanagedthreadid},run3 结束运行");
39         }
40     }
41 }
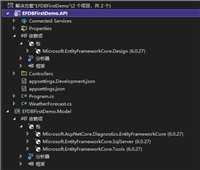
1.2、example_7_1_2(特别说明,这个项目是 net 7.0)
 1 namespace example_7_1_2
 2 {
 3     internal class program
 4     {
 5         static void main(string[] args)
 6         {
 7             console.writeline("hello, world!");
 8             debugger.break();
 9         }
10     }
11 }
2、眼见为实
项目的所有操作都是一样的,所以就在这里说明一下,但是每个测试例子,都需要重新启动,并加载相应的应用程序,加载方法都是一样的。流程如下:我们编译项目,打开 windbg,点击【文件】----》【launch executable】附加程序,打开调试器的界面,程序已经处于中断状态。我们需要使用【g】命令,继续运行程序,然后到达指定地点停止后,我们可以点击【break】按钮,就可以调试程序了。有时候可能需要切换到主线程,可以使用【~0s】命令。
2.1、使用 【!t】命令查看进程中有多少个托管线程。
测试源码:example_7_1_1
 1 0:012> !t
 2 threadcount:      6
 3 unstartedthread:  0
 4 backgroundthread: 5
 5 pendingthread:    0
 6 deadthread:       0
 7 hosted runtime:   no
 8                                                                          lock
 9        id osid threadobj    state gc mode     gc alloc context  domain   count apt exception
10    0    1 2ef4 00c73930     2a020 preemptive  02b94f38:00000000 00c6d758 1     mta
11    5    2 39c0 00cb0728     2b220 preemptive  00000000:00000000 00c6d758 0     mta (finalizer)
12    9    3 17dc 00cdc010   3029220 preemptive  02b9c6c8:00000000 00c6d758 0     mta (threadpool worker)
13   10    4  a18 00cdc9b8   3029220 preemptive  02b98350:00000000 00c6d758 0     mta (threadpool worker)
14   11    5 31d0 00cdd360   3029220 preemptive  02b9a350:00000000 00c6d758 0     mta (threadpool worker)
15   13    6  9a0 00ce05c0   1029220 preemptive  02b9e1e8:00000000 00c6d758 0     mta (threadpool worker)
threadcount:有多少个托管线程,这个进程里面有6个。
unstartedthread:已经创建,但是还没有使用的线程,当前数量是0。
backgroundthread:后台线程的数量,这个进程里面有5个。
pendingthread:阻塞的线程的数量,当前这个进程是0个阻塞的线程。
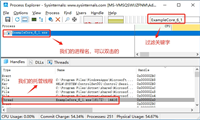
deadthread:当一个线程完成任务,但是还没有被回收,这个阶段的线程就是死线程,也就是说这个线程对象底层的数据结构的 osid 已经销毁。
以上就是介绍的主要名称,下面接着介绍,列表的每一项。我们使用 c# thread 类型声明一个线程的时候,其实在操作系统和clr都有一个数据结构相对应,有了 osid我们才可以在任务管理器中看到线程对象。
第一列,没有标题,是 windbgthreadid,windbg 自己的给 thread 打了一个标记,便于以后使用,也可以区分托管线程和非托管线程。
第二列 id:是托管线程,也就是我们 thread 类型的标识符 id,就是 这段代码的值:environment.currentmanagedthreadid
第三列 osid:操作系统线程的 id,
第四列 threadobj:clr 底层的 thread 线程对象,可以使用【dp】命令观察其中的内容,我们查看托管线程 id=3 的【00cdc010】内容,红色标注就是托管线程的id,就是3。
1 0:012> dp 00cdc010
2 00cdc010  72074bd4 03029220 00000000 055ff680
3 00cdc020  00000000 00c6d758 00000000 00000003
4 00cdc030  00cdc034 00cdc034 00cdc034 00000000
5 00cdc040  00000000 baad0000 00c6ed50 0094f000
6 00cdc050  02b9c6c8 02b9dfe8 00003d10 00000000
7 00cdc060  00000000 00000000 00000000 00000000
8 00cdc070  00000000 baadf00d 70ad2c60 00cdc850
9 00cdc080  00000000 00000000 00000000 00000000
第五列 state:clr 层面的线程状态,03029220 就是托管线程的状态。我们可以点进去或者使用【!threadstate】命令查看线程状态详情,当前就是托管线程是3的状态。
1 0:012> !threadstate 3029220
2     legal to join(可以执行 join 操作)
3     background(是后台线程)
4     clr owns(是clr 拥有的线程)
5     in multi threaded apartment(是mta模式)
6     fully initialized(已经完全初始化)
7     thread pool worker thread(是线程池线程)
8     interruptible(可执行中断操作)
第六列 gc mode:表示当前的线程有没有操作托管堆的权限。
第七列 gc alloc context:缓冲区的开始节点和结束节点,每个线程在托管堆中分配一个对象,都有一个缓冲区,这个就是确定了缓冲区起始和结束。
第八列 domain:表示当前线程所属于的域。
第九列 lock count:表示当前的线程有多少个托管锁。
第十列 apt:表示线程是 sta(线程串行模式,wpf、winform) 模式还是 mta (多线程并行模式)模式。
第十一列 exception:在当前线程上发生了异常,会把这个异常和这个线程关联起来。
finalizer 表示当前是终结器线程,threadpool worker 表示线程是线程池的线程。
2.2、如何查看 clr thread 的结构,也就是查看 threadobj 的结构。
测试源码:example_7_1_2(net 7.0项目)
如果我们想在 net framework 环境下查看 clr 线程对象的结构是很难的,因为他是不开源的,所以我们只能新建 net 7.0 的项目。
输出所有的线程列表。
 1 0:000> !t
 2 threadcount:      3
 3 unstartedthread:  0
 4 backgroundthread: 2
 5 pendingthread:    0
 6 deadthread:       0
 7 hosted runtime:   no
 8                                                                                                             lock
 9  dbg   id     osid threadobj           state gc mode     gc alloc context                  domain           count apt exception
10    0    1      624 00000199dfd0cae0    2a020 preemptive  00000199e440ad60:00000199e440c750 00000199dfd02dd0 -00001 mta
11    5    2     1344 00000199dfd51dd0    21220 preemptive  0000000000000000:0000000000000000 00000199dfd02dd0 -00001 ukn (finalizer)
12    6    3     3b40 000001da763b15e0    2b220 preemptive  0000000000000000:0000000000000000 00000199dfd02dd0 -00001 mta
然后,我们使用【dt】命令,查看线程的结构。
  1 0:000> dt coreclr!thread 00000199dfd0cae0
  2    +0x000 m_stacklocalallocator : (null)
  3    =00007ffd`027a8af0 m_detachcount    : 0n0
  4    =00007ffd`027a8af4 m_activedetachcount : 0n0
  5    +0x008 m_state          : volatile<enum thread::threadstate>
  6    +0x00c m_fpreemptivegcdisabled : volatile<unsigned long>
  7    +0x010 m_pframe         : 0x0000008a`24f7e478 frame
  8    +0x018 m_pdomain        : 0x00000199`dfd02dd0 appdomain
  9    +0x020 m_threadid       : 1
 10    +0x028 m_phead          : 0x00000199`dfd0cb10 lockentry
 11    +0x030 m_embeddedentry  : lockentry
 12    +0x050 m_pblockinglock  : volatileptr<deadlockawarelock,deadlockawarelock *>
 13    +0x058 m_alloc_context  : gc_alloc_context
 14    +0x090 m_thalloccontextobj : typehandle
 15    +0x098 m_pteb           : 0x0000008a`24c20000 _nt_tib
 16    +0x0a0 m_prcwstack      : 0x00000199`dfd0d710 rcwstackheader
 17    +0x0a8 m_threadtasks    : 0 (no matching name)
 18    +0x0ac m_statenc        : 100 ( tsnc_existinthreadstore )
 19    +0x0b0 m_dwforbidsuspendthread : volatile<long>
 20    +0x0b4 m_dwhashcodeseed : 0xdfca504a
 21    +0x0b8 m_ploadlimiter   : (null)
 22    +0x0c0 m_aborttype      : 0
 23    +0x0c8 m_abortendtime   : 0xffffffff`ffffffff
 24    +0x0d0 m_rudeabortendtime : 0xffffffff`ffffffff
 25    +0x0d8 m_frudeabortinitiated : 0n0
 26    +0x0dc m_abortcontroller : 0n0
 27    +0x0e0 m_abortrequestlock : 0n0
 28    +0x0e4 m_threwcontrolforthread : 0
 29    +0x0e8 m_oscontext      : 0x00000199`dfd0d210 _context
 30    +0x0f0 m_ppendingtypeload : (null)
 31    +0x0f8 m_link           : slink
 32    +0x100 m_dwlasterror    : 0
 33    +0x108 m_cachestackbase : 0x0000008a`24f80000 void
 34    +0x110 m_cachestacklimit : 0x0000008a`24e00000 void
 35    +0x118 m_cachestacksufficientexecutionlimit : 0x0000008a`24e20000
 36    +0x120 m_cachestackstackallocnonriskyexecutionlimit : 0x0000008a`24e80000
 37    +0x128 m_pvhjretaddr    : 0xcccccccc`cccccccc void
 38    +0x130 m_ppvhjretaddrptr : 0xcccccccc`cccccccc  -> ????
 39    +0x138 m_hijackedfunction : 0xbaadf00d`baadf00d methoddesc
 40    +0x140 m_userinterrupt  : 0n0
 41    +0x148 m_debugsuspendevent : clrevent
 42    +0x158 m_eventwait      : clrevent
 43    +0x168 m_waiteventlink  : waiteventlink
 44    +0x198 m_threadhandle   : 0x00000000`000001e0 void
 45    +0x1a0 m_threadhandleforclose : 0xffffffff`ffffffff void
 46    +0x1a8 m_threadhandleforresume : 0xffffffff`ffffffff void
 47    +0x1b0 m_weownthreadhandle : 0n1
 48    +0x1b8 m_osthreadid     : 0x624
 49    +0x1c0 m_exposedobject  : 0x00000199`dfc411f8 objecthandle__
 50    +0x1c8 m_stronghndtoexposedobject : 0x00000199`dfc413f8 objecthandle__
 51    +0x1d0 m_priority       : 0x80000000
 52    +0x1d4 m_externalrefcount : 1
 53    +0x1d8 m_tracecallcount : 0n0
 54    +0x1e0 m_lastthrownobjecthandle : (null)
 55    +0x1e8 m_ltoisunhandled : 0n0
 56    +0x1f0 m_exceptionstate : threadexceptionstate
 57    +0x398 m_debuggerfiltercontext : (null)
 58    +0x3a0 m_pprofilerfiltercontext : (null)
 59    +0x3a8 m_hijacklock     : volatile<long>
 60    +0x3b0 m_hcurrnotification : 0xbaadf00d`baadf00d objecthandle__
 61    +0x3b8 m_finteropdebugginghijacked : 0n0
 62    +0x3bc m_profilercallbackstate : 0
 63    +0x3c0 m_dwprofilerevacuationcounters : [33] volatile<unsigned long>
 64    +0x444 m_workerthreadpoolcompletioncount : 0
 65    =00007ffd`027b3cc0 s_workerthreadpoolcompletioncountoverflow : 0
 66    +0x448 m_iothreadpoolcompletioncount : 0
 67    =00007ffd`027b3cc8 s_iothreadpoolcompletioncountoverflow : 0
 68    +0x44c m_monitorlockcontentioncount : 0
 69    =00007ffd`027a8ad8 s_monitorlockcontentioncountoverflow : 0
 70    +0x450 m_preventasync   : 0n0
 71    =00007ffd`027a6204 m_debugwillsynccount : 0n-1
 72    +0x458 m_psavedredirectcontext : (null)
 73    +0x460 m_poscontextbuffer : (null)
 74    +0x468 m_threadlocalblock : threadlocalblock
 75    +0x490 m_tailcalltls    : tailcalltls
 76    +0x4a0 m_dwavinruntimeimplokaycount : 0
 77    +0x4a8 m_pexceptionduringstartup : (null)
 78    +0x4b0 m_debuggeractivepatchskipper : volatileptr<debuggerpatchskip,debuggerpatchskip *>
 79    +0x4b8 m_fallowprofilercallbacks : 0n1
 80    +0x4c0 m_piocompletioncontext : 0x00000199`dfd0da40 void
 81    +0x4c8 m_dwthreadhandlebeingused : volatile<long>
 82    =00007ffd`027a8ad0 s_fcleanfinalizedthread : 0n0
 83    +0x4d0 m_pcreatingthrowableforexception : (null)
 84    +0x4d8 m_dwindexclauseforcatch : 0
 85    +0x4e0 m_sfestablisherofactualhandlerframe : stackframe
 86    +0x4e8 debugblockinginfo : threaddebugblockinginfo
 87    +0x4f0 m_fdisablecomobjecteagercleanup : 0
 88    +0x4f1 m_fhasdeadthreadbeenconsideredforgctrigger : 0
 89    +0x4f4 m_random         : clrrandom
 90    +0x5e0 m_uliinitializespycookie : _ularge_integer 0x0
 91    +0x5e8 m_finitializespyregistered : 0
 92    +0x5f0 m_plaststactxcookie : (null)
 93    +0x5f8 m_fgcspecial     : 0
 94    +0x600 m_pgcframe       : 0x0000008a`24f7e790 gcframe
 95    +0x608 m_wcpugroup      : 0
 96    +0x610 m_paffinitymask  : 0
 97    +0x618 m_pallloggedtypes : (null)
 98    +0x620 m_gcmodeonsuspension : volatile<unsigned long>
 99    +0x624 m_activityid     : _guid {00000000-0000-0000-0000-000000000000}
100    +0x634 m_hijackreturnkind : ff ( rt_illegal )
101    =00007ffd`027a8b40 dead_threads_non_alloc_bytes : 0
102    +0x638 m_currentpreparecodeconfig : (null)
103    +0x640 m_isinforbidsuspendfordebuggerregion : 0
104    =00007ffd`027ba3d0 s_pfnqueueuserapc2proc : (null)
105    +0x641 m_haspendingactivation : 0
+0x020 m_threadid : 1表示托管线程的id。因为我打印的是 threadobj 为00000199dfd0cae0 线程的结构。m 表示management 托管的。
我们可以继续看看 gc alloc context,在输出的结构中有这样一行代码:+0x058 m_alloc_context : gc_alloc_context,蓝色的字体,可以点击,相当于执行【dx】命令。
1 0:000> dx -r1 (*((coreclr!gc_alloc_context *)0x199dfd0cb38))
2 (*((coreclr!gc_alloc_context *)0x199dfd0cb38))                 [type: gc_alloc_context]
3     [+0x000] alloc_ptr        : 0x199e440ad60 : 0x0 [type: unsigned char *]
4     [+0x008] alloc_limit      : 0x199e440c750 : 0x0 [type: unsigned char *]
5     [+0x010] alloc_bytes      : 50920 [type: __int64](小对象堆的大小)
6     [+0x018] alloc_bytes_uoh  : 17416 [type: __int64](大对象堆的大小)
7     [+0x020] gc_reserved_1    : 0x0 [type: void *]
8     [+0x028] gc_reserved_2    : 0x0 [type: void *]
9     [+0x030] alloc_count      : 0 [type: int]
2.3、使用 windbg 的【k】命令查看非托管函数。
测试源码:example_7_1_1
这里操作需要切换到主线程上,执行命令【~0s】,然后使用【k】命令。
 1 0:010> ~0s
 2 eax=00000000 ebx=00000090 ecx=00000000 edx=00000000 esi=00f3f444 edi=00000000
 3 eip=77c310fc esp=00f3f32c ebp=00f3f38c iopl=0         nv up ei pl nz na po nc
 4 cs=0023  ss=002b  ds=002b  es=002b  fs=0053  gs=002b             efl=00000202
 5 ntdll!ntreadfile+0xc:
 6 77c310fc c22400          ret     24h
 7
 8
 9 0:000> k
10  # childebp retaddr
11 00 00f3f38c 75dbf25c     ntdll!ntreadfile+0xc
12 01 00f3f38c 70f79b71     kernelbase!readfile+0xec
13 02 00f3f3fc 716ab275     mscorlib_ni+0x4b9b71
14 03 00f3f428 716ab17b     ...
15 warning: frame ip not in any known module. following frames may be wrong.(无法显示托管函数)
16 09 00f3f4b8 71faf036     0x2e9088e
17 0a 00f3f4c4 71fb22da     clr!calldescrworkerinternal+0x34
18 0b 00f3f518 71fb859b     clr!calldescrworkerwithhandler+0x6b
19 0c 00f3f588 7215b11b     clr!methoddesccallsite::calltargetworker+0x16a
20 0d 00f3f6ac 7215b7fa     clr!runmain+0x1b3
21 0e 00f3f918 7215b727     clr!assembly::executemainmethod+0xf7
22 0f 00f3fdfc 7215b8a8     clr!systemdomain::executemainmethod+0x5ef
23 10 00f3fe54 7215b9ce     clr!executeexe+0x4c
24 11 00f3fe94 72157305     clr!_corexemaininternal+0xdc
25 12 00f3fed0 7275fa84     clr!_corexemain+0x4d
26 13 00f3ff08 7285e81e     mscoreei!_corexemain+0xd6
27 14 00f3ff18 72864338     mscoree!shellshim__corexemain+0x9e
28 15 00f3ff30 7636f989     mscoree!_corexemain_exported+0x8
29 16 00f3ff30 77c27084     kernel32!basethreadinitthunk+0x19
30 17 00f3ff8c 77c27054     ntdll!__rtluserthreadstart+0x2f
31 18 00f3ff9c 00000000     ntdll!_rtluserthreadstart+0x1b
但是我们可以使用 sos的【!clrstack】命令显示托管函数。
 1 0:000> !clrstack
 2 os thread id: 0xc08 (0)
 3 child sp       ip call site
 4 00f3f3ac 77c310fc [inlinedcallframe: 00f3f3ac]
 5 00f3f3a8 70f79b71 domainneutralilstubclass.il_stub_pinvoke(microsoft.win32.safehandles.safefilehandle, byte*, int32, int32 byref, intptr)
 6 00f3f3ac 716ab275 [inlinedcallframe: 00f3f3ac] microsoft.win32.win32native.readfile(..., int32, int32 byref, intptr)
 7 00f3f410 716ab275 system.io.__consolestream.readfilenative(.., int32 byref) [f:\dd\ndp\clr\src\bcl\system\io\__consolestream.cs @ 205]
 8 00f3f444 716ab17b system.io.__consolestream.read(byte[], int32, int32) [f:\dd\ndp\clr\src\bcl\system\io\__consolestream.cs @ 134]
 9 00f3f464 70f5e6a3 system.io.streamreader.readbuffer() [f:\dd\ndp\clr\src\bcl\system\io\streamreader.cs @ 595]
10 00f3f474 70f5eb5b system.io.streamreader.readline() [f:\dd\ndp\clr\src\bcl\system\io\streamreader.cs @ 748]
11 00f3f490 717f3786 system.io.textreader+synctextreader.readline() [f:\dd\ndp\clr\src\bcl\system\io\textreader.cs @ 363]
12 00f3f4a0 71651845 system.console.readline() [f:\dd\ndp\clr\src\bcl\system\console.cs @ 1984]
13 00f3f4a8 02e9088e example_7_1_1.program.main(system.string[]) [e:\visual studio 2022\...\example_7_1_1\program.cs @ 13]
14 00f3f62c 71faf036 [gcframe: 00f3f62c]
2.4、使用【kb】命令查看线程栈,提取 ntdll!ntreadfile 的第一个参数。
测试源码:example_7_1_1
 1 0:000> kb
 2  # childebp retaddr      args to child
 3 00 00f3f38c 75dbf25c     00000090 00000000 00000000 ntdll!ntreadfile+0xc
 4 01 00f3f38c 70f79b71     00000090 02f35d18 00000100 kernelbase!readfile+0xec
 5 02 00f3f3fc 716ab275     00000000 00f3f444 00000100 mscorlib_ni+0x4b9b71
 6 03 00f3f428 716ab17b     00f3f444 00000000 00000001 mscorlib_ni!system.io.__consolestream.readfilenative+0x89 [f:\dd\ndp\clr\src\bcl\system\io\__consolestream.cs @ 205]
 7 04 00f3f454 70f5e6a3     00000100 00000000 02f3a210 mscorlib_ni!system.io.__consolestream.read+0x9f [f:\dd\ndp\clr\src\bcl\system\io\__consolestream.cs @ 134]
 8 05 00f3f46c 70f5eb5b     00000001 00000000 00f3f55c mscorlib_ni!system.io.streamreader.readbuffer+0x33 [f:\dd\ndp\clr\src\bcl\system\io\streamreader.cs @ 595]
 9 06 00f3f488 717f3786     00000000 00f3f4d0 00f3f4a0 mscorlib_ni!system.io.streamreader.readline+0xe3 [f:\dd\ndp\clr\src\bcl\system\io\streamreader.cs @ 748]
10 07 00f3f498 71651845     00f3f4b8 02e9088e 00000000 mscorlib_ni!system.io.textreader.synctextreader.readline+0x1a [f:\dd\ndp\clr\src\bcl\system\io\textreader.cs @ 363]
11 08 00f3f4a0 02e9088e     00000000 0000000b 0000000a mscorlib_ni!system.console.readline+0x15 [f:\dd\ndp\clr\src\bcl\system\console.cs @ 1984]
12 warning: frame ip not in any known module. following frames may be wrong.
13 09 00f3f4b8 71faf036     0116a628 00f3f518 71fb22da 0x2e9088e
14 0a 00f3f4c4 71fb22da     00f3f55c 00f3f508 720a23d0 clr!calldescrworkerinternal+0x34
15 0b 00f3f518 71fb859b     00f3f570 02f324bc 00000000 clr!calldescrworkerwithhandler+0x6b
16 0c 00f3f588 7215b11b     00f3f664 6a38df42 02d04d78 clr!methoddesccallsite::calltargetworker+0x16a
17 0d 00f3f6ac 7215b7fa     00f3f6f0 00000000 6a38d0f6 clr!runmain+0x1b3
18 0e 00f3f918 7215b727     00000000 6a38d412 00b70000 clr!assembly::executemainmethod+0xf7
19 0f 00f3fdfc 7215b8a8     6a38d7ba 00000000 00000000 clr!systemdomain::executemainmethod+0x5ef
20 10 00f3fe54 7215b9ce     6a38d77a 00000000 721572e0 clr!executeexe+0x4c
21 11 00f3fe94 72157305     6a38d73e 00000000 721572e0 clr!_corexemaininternal+0xdc
22 12 00f3fed0 7275fa84     8ee8ef1f 72864330 7275fa20 clr!_corexemain+0x4d
23 13 00f3ff08 7285e81e     72864330 72750000 00f3ff30 mscoreei!_corexemain+0xd6
24 14 00f3ff18 72864338     72864330 7636f989 00c95000 mscoree!shellshim__corexemain+0x9e
25 15 00f3ff30 7636f989     00c95000 7636f970 00f3ff8c mscoree!_corexemain_exported+0x8
26 16 00f3ff30 77c27084     00c95000 281a60a3 00000000 kernel32!basethreadinitthunk+0x19
27 17 00f3ff8c 77c27054     ffffffff 77c462ae 00000000 ntdll!__rtluserthreadstart+0x2f
28 18 00f3ff9c 00000000     00000000 00000000 00000000 ntdll!_rtluserthreadstart+0x1b
ntdll!ntreadfile 方法的第一个参数是一个 handle,我们可以使用【!handle】命令+ f 参数显示详情。console.readline()方法底层就是 file 的句柄。
 1 0:000> !handle 00000090 f
 2 handle 90
 3   type             file
 4   attributes       0
 5   grantedaccess    0x12019f:
 6          readcontrol,synch
 7          read/list,write/add,append/subdir/createpipe,readea,writeea,readattr,writeattr
 8   handlecount      2
 9   pointercount     65531
10   no object specific information available
2.5、我们使用【!clrstack】命令查看托管函数。
测试源码:example_7_1_1
!clrstack 执行效果
 1 0:000> !clrstack
 2 os thread id: 0xc08 (0)
 3 child sp       ip call site
 4 00f3f3ac 77c310fc [inlinedcallframe: 00f3f3ac]
 5 00f3f3a8 70f79b71 domainneutralilstubclass.il_stub_pinvoke(..., byte*, int32, int32 byref, intptr)
 6 00f3f3ac 716ab275 [inlinedcallframe: 00f3f3ac] microsoft.win32.win32native.readfile(... byte*, int32, int32 byref, intptr)
 7 00f3f410 716ab275 system.io.__consolestream.readfilenative(.. int32 byref) [f:\dd\ndp\clr\src\bcl\system\io\__consolestream.cs @ 205]
 8 00f3f444 716ab17b system.io.__consolestream.read(byte[], int32, int32) [f:\dd\ndp\clr\src\bcl\system\io\__consolestream.cs @ 134]
 9 00f3f464 70f5e6a3 system.io.streamreader.readbuffer() [f:\dd\ndp\clr\src\bcl\system\io\streamreader.cs @ 595]
10 00f3f474 70f5eb5b system.io.streamreader.readline() [f:\dd\ndp\clr\src\bcl\system\io\streamreader.cs @ 748]
11 00f3f490 717f3786 system.io.textreader+synctextreader.readline() [f:\dd\ndp\clr\src\bcl\system\io\textreader.cs @ 363]
12 00f3f4a0 71651845 system.console.readline() [f:\dd\ndp\clr\src\bcl\system\console.cs @ 1984]
13 00f3f4a8 02e9088e example_7_1_1.program.main(system.string[]) [e:\visual studio 2022\...\example_7_1_1\program.cs @ 13]
14 00f3f62c 71faf036 [gcframe: 00f3f62c]
!clrstack -a:显示所有参数和局部变量,关注红色标注的。
 1 0:000> !clrstack -a
 2 os thread id: 0xc08 (0)
 3 child sp       ip call site
 4 00f3f3ac 77c310fc [inlinedcallframe: 00f3f3ac]
 5 00f3f3a8 70f79b71 domainneutralilstubclass.il_stub_pinvoke(microsoft.win32.safehandles.safefilehandle, byte*, int32, int32 byref, intptr)
 6     parameters:
 7         <no data>
 8         <no data>
 9         <no data>
10         <no data>
11         <no data>
12 ...(内容太多,就省略了,也没用)
13
14 00f3f4a8 02e9088e example_7_1_1.program.main(system.string[]) [e:\visual studio 2022\..\example_7_1_1\program.cs @ 13]
15     parameters:(参数)
16         args (0x00f3f4b4) = 0x02f324bc(参数)
17     locals:(局部变量)
18         0x00f3f4b0 = 0x0000000a
19         0x00f3f4ac = 0x0000000b
20
21 00f3f62c 71faf036 [gcframe: 00f3f62c]
!clrstack -l:显示所有局部变量,关注红色标注的。
 1 0:000> !clrstack -l
 2 os thread id: 0xc08 (0)
 3 child sp       ip call site
 4 00f3f3ac 77c310fc [inlinedcallframe: 00f3f3ac]
 5 00f3f3a8 70f79b71 domainneutralilstubclass.il_stub_pinvoke(microsoft.win32.safehandles.safefilehandle, byte*, int32, int32 byref, intptr)
 6 ...(内容太多,就省略了,也没用)
 7
 8 00f3f4a8 02e9088e example_7_1_1.program.main(system.string[]) [e:\visual studio 2022\...\example_7_1_1\program.cs @ 13]
 9     locals:(只有局部变量)
10         0x00f3f4b0 = 0x0000000a
11         0x00f3f4ac = 0x0000000b
12
13 00f3f62c 71faf036 [gcframe: 00f3f62c]
!clrstack -p:显示所有参数,关注红色标注的。
 1 0:000> !clrstack -p
 2 os thread id: 0xc08 (0)
 3 child sp       ip call site
 4 00f3f3ac 77c310fc [inlinedcallframe: 00f3f3ac]
 5 00f3f3a8 70f79b71 domainneutralilstubclass.il_stub_pinvoke(microsoft.win32.safehandles.safefilehandle, byte*, int32, int32 byref, intptr)
 6     parameters:
 7         <no data>
 8         <no data>
 9         <no data>
10         <no data>
11         <no data>
12
13 ...(内容太多,就省略了,也没用)
14
15 00f3f4a8 02e9088e example_7_1_1.program.main(system.string[]) [e:\visual studio 2022\...\example_7_1_1\program.cs @ 13]
16     parameters:(只有参数)
17         args (0x00f3f4b4) = 0x02f324bc
18
19 00f3f62c 71faf036 [gcframe: 00f3f62c]
2.6、使用【~*e】查看所有托管线程栈。
测试源码:example_7_1_1
~ 命令输出所有线程列表。
 1 0:000> ~
 2 .  0  id: 2074.c08 suspend: 1 teb: 00c98000 unfrozen
 3    1  id: 2074.2cdc suspend: 1 teb: 00c9b000 unfrozen
 4    2  id: 2074.3bec suspend: 1 teb: 00c9e000 unfrozen
 5    3  id: 2074.1a34 suspend: 1 teb: 00ca1000 unfrozen
 6    4  id: 2074.3858 suspend: 1 teb: 00ca4000 unfrozen
 7    5  id: 2074.379c suspend: 1 teb: 00ca7000 unfrozen
 8    6  id: 2074.3088 suspend: 1 teb: 00caa000 unfrozen
 9    7  id: 2074.2c54 suspend: 1 teb: 00cad000 unfrozen
10    8  id: 2074.20dc suspend: 1 teb: 00cb0000 unfrozen
11    9  id: 2074.2014 suspend: 1 teb: 00cb3000 unfrozen
12 # 10  id: 2074.187c suspend: 1 teb: 00cc2000 unfrozen
13   11  id: 2074.2b64 suspend: 1 teb: 00cb9000 unfrozen
14   12  id: 2074.1358 suspend: 1 teb: 00cbc000 unfrozen
15   13  id: 2074.6e8 suspend: 1 teb: 00cbf000 unfrozen
~* 命令,显示所有线程列表和入口函数。
 1 0:000> ~*
 2 .  0  id: 2074.c08 suspend: 1 teb: 00c98000 unfrozen
 3       start: 00402bca
 4       priority: 0  priority class: 32  affinity: f
 5    1  id: 2074.2cdc suspend: 1 teb: 00c9b000 unfrozen
 6       start: ntdll!tppworkerthread (77c10c90)
 7       priority: 0  priority class: 32  affinity: f
 8    2  id: 2074.3bec suspend: 1 teb: 00c9e000 unfrozen
 9       start: ntdll!tppworkerthread (77c10c90)
10       priority: 0  priority class: 32  affinity: f
11    3  id: 2074.1a34 suspend: 1 teb: 00ca1000 unfrozen
12       start: ntdll!tppworkerthread (77c10c90)
13       priority: 0  priority class: 32  affinity: f
14    4  id: 2074.3858 suspend: 1 teb: 00ca4000 unfrozen
15       start: clr!debuggerrcthread::threadprocstatic (721565d0)
16       priority: 0  priority class: 32  affinity: f
17    5  id: 2074.379c suspend: 1 teb: 00ca7000 unfrozen
18       start: clr!thread::intermediatethreadproc (72074b60)
19       priority: 2  priority class: 32  affinity: f
20    6  id: 2074.3088 suspend: 1 teb: 00caa000 unfrozen
21       start: combase!crpcthreadcache::rpcworkerthreadentry (7731bcc0)
22       priority: 0  priority class: 32  affinity: f
23    7  id: 2074.2c54 suspend: 1 teb: 00cad000 unfrozen
24       start: ntdll!tppworkerthread (77c10c90)
25       priority: 0  priority class: 32  affinity: f
26    8  id: 2074.20dc suspend: 1 teb: 00cb0000 unfrozen
27       start: ntdll!tppworkerthread (77c10c90)
28       priority: 0  priority class: 32  affinity: f
29    9  id: 2074.2014 suspend: 1 teb: 00cb3000 unfrozen
30       start: clr!thread::intermediatethreadproc (72074b60)
31       priority: 0  priority class: 32  affinity: f
32 # 10  id: 2074.187c suspend: 1 teb: 00cc2000 unfrozen
33       start: ntdll!dbguiremotebreakin (77c6cee0)
34       priority: 0  priority class: 32  affinity: f
35   11  id: 2074.2b64 suspend: 1 teb: 00cb9000 unfrozen
36       start: clr!thread::intermediatethreadproc (72074b60)
37       priority: 0  priority class: 32  affinity: f
38   12  id: 2074.1358 suspend: 1 teb: 00cbc000 unfrozen
39       start: clr!thread::intermediatethreadproc (72074b60)
40       priority: 0  priority class: 32  affinity: f
41   13  id: 2074.6e8 suspend: 1 teb: 00cbf000 unfrozen
42       start: clr!thread::intermediatethreadproc (72074b60)
43       priority: 0  priority class: 32  affinity: f
~*e !clrstack 命令执行的结果,内容太多,折叠了。
  1 0:000> ~*e !clrstack
  2 os thread id: 0xc08 (0)
  3 child sp       ip call site
  4 00f3f3ac 77c310fc [inlinedcallframe: 00f3f3ac]
  5 00f3f3a8 70f79b71 domainneutralilstubclass.il_stub_pinvoke(microsoft.win32.safehandles.safefilehandle, byte*, int32, int32 byref, intptr)
  6 00f3f3ac 716ab275 [inlinedcallframe: 00f3f3ac] microsoft.win32.win32native.readfile(microsoft.win32.safehandles.safefilehandle, byte*, int32, int32 byref, intptr)
  7 00f3f410 716ab275 system.io.__consolestream.readfilenative(microsoft.win32.safehandles.safefilehandle, byte[], int32, int32, boolean, boolean, int32 byref) [f:\dd\ndp\clr\src\bcl\system\io\__consolestream.cs @ 205]
  8 00f3f444 716ab17b system.io.__consolestream.read(byte[], int32, int32) [f:\dd\ndp\clr\src\bcl\system\io\__consolestream.cs @ 134]
  9 00f3f464 70f5e6a3 system.io.streamreader.readbuffer() [f:\dd\ndp\clr\src\bcl\system\io\streamreader.cs @ 595]
 10 00f3f474 70f5eb5b system.io.streamreader.readline() [f:\dd\ndp\clr\src\bcl\system\io\streamreader.cs @ 748]
 11 00f3f490 717f3786 system.io.textreader+synctextreader.readline() [f:\dd\ndp\clr\src\bcl\system\io\textreader.cs @ 363]
 12 00f3f4a0 71651845 system.console.readline() [f:\dd\ndp\clr\src\bcl\system\console.cs @ 1984]
 13 00f3f4a8 02e9088e example_7_1_1.program.main(system.string[]) [e:\visual studio 2022\source\projects\advanceddebug.netframework.test\example_7_1_1\program.cs @ 13]
 14 00f3f62c 71faf036 [gcframe: 00f3f62c]
 15 os thread id: 0x2cdc (1)
 16 unable to walk the managed stack. the current thread is likely not a
 17 managed thread. you can run !threads to get a list of managed threads in
 18 the process
 19 failed to start stack walk: 80070057
 20 os thread id: 0x3bec (2)
 21 unable to walk the managed stack. the current thread is likely not a
 22 managed thread. you can run !threads to get a list of managed threads in
 23 the process
 24 failed to start stack walk: 80070057
 25 os thread id: 0x1a34 (3)
 26 unable to walk the managed stack. the current thread is likely not a
 27 managed thread. you can run !threads to get a list of managed threads in
 28 the process
 29 failed to start stack walk: 80070057
 30 os thread id: 0x3858 (4)
 31 unable to walk the managed stack. the current thread is likely not a
 32 managed thread. you can run !threads to get a list of managed threads in
 33 the process
 34 failed to start stack walk: 80070057
 35 os thread id: 0x379c (5)
 36 child sp       ip call site
 37 050cfd48 77c3166c [debuggeru2mcatchhandlerframe: 050cfd48]
 38 os thread id: 0x3088 (6)
 39 unable to walk the managed stack. the current thread is likely not a
 40 managed thread. you can run !threads to get a list of managed threads in
 41 the process
 42 failed to start stack walk: 80070057
 43 os thread id: 0x2c54 (7)
 44 unable to walk the managed stack. the current thread is likely not a
 45 managed thread. you can run !threads to get a list of managed threads in
 46 the process
 47 failed to start stack walk: 80070057
 48 os thread id: 0x20dc (8)
 49 unable to walk the managed stack. the current thread is likely not a
 50 managed thread. you can run !threads to get a list of managed threads in
 51 the process
 52 failed to start stack walk: 80070057
 53 os thread id: 0x2014 (9)
 54 child sp       ip call site
 55 0596f060 77c3166c [gcframe: 0596f060]
 56 0596f1b0 77c3166c [helpermethodframe: 0596f1b0] system.threading.monitor.enter(system.object)
 57 0596f220 717f377b system.io.textreader+synctextreader.readline() [f:\dd\ndp\clr\src\bcl\system\io\textreader.cs @ 363]
 58 0596f230 71651845 system.console.readline() [f:\dd\ndp\clr\src\bcl\system\console.cs @ 1984]
 59 0596f238 02e90b59 example_7_1_1.program.run1() [e:\visual studio 2022\source\projects\advanceddebug.netframework.test\example_7_1_1\program.cs @ 26]
 60 0596f274 02e90a94 example_7_1_1.program+c.b__1_0() [e:\visual studio 2022\source\projects\advanceddebug.netframework.test\example_7_1_1\program.cs @ 18]
 61 0596f280 70f1d4bb system.threading.tasks.task.innerinvoke() [f:\dd\ndp\clr\src\bcl\system\threading\tasks\task.cs @ 2884]
 62 0596f28c 70f1b731 system.threading.tasks.task.execute() [f:\dd\ndp\clr\src\bcl\system\threading\tasks\task.cs @ 2498]
 63 0596f2b0 70f1b6fc system.threading.tasks.task.executioncontextcallback(system.object) [f:\dd\ndp\clr\src\bcl\system\threading\tasks\task.cs @ 2861]
 64 0596f2b4 70eb8604 system.threading.executioncontext.runinternal(system.threading.executioncontext, system.threading.contextcallback, system.object, boolean) [f:\dd\ndp\clr\src\bcl\system\threading\executioncontext.cs @ 980]
 65 0596f320 70eb8537 system.threading.executioncontext.run(system.threading.executioncontext, system.threading.contextcallback, system.object, boolean) [f:\dd\ndp\clr\src\bcl\system\threading\executioncontext.cs @ 928]
 66 0596f334 70f1b4b2 system.threading.tasks.task.executewiththreadlocal(system.threading.tasks.task byref) [f:\dd\ndp\clr\src\bcl\system\threading\tasks\task.cs @ 2827]
 67 0596f398 70f1b357 system.threading.tasks.task.executeentry(boolean) [f:\dd\ndp\clr\src\bcl\system\threading\tasks\task.cs @ 2767]
 68 0596f3a8 70f1b29d system.threading.tasks.task.system.threading.ithreadpoolworkitem.executeworkitem() [f:\dd\ndp\clr\src\bcl\system\threading\tasks\task.cs @ 2704]
 69 0596f3ac 70e8eb7d system.threading.threadpoolworkqueue.dispatch() [f:\dd\ndp\clr\src\bcl\system\threading\threadpool.cs @ 820]
 70 0596f3fc 70e8e9db system.threading._threadpoolwaitcallback.performwaitcallback() [f:\dd\ndp\clr\src\bcl\system\threading\threadpool.cs @ 1161]
 71 0596f61c 71faf036 [debuggeru2mcatchhandlerframe: 0596f61c]
 72 os thread id: 0x187c (10)
 73 unable to walk the managed stack. the current thread is likely not a
 74 managed thread. you can run !threads to get a list of managed threads in
 75 the process
 76 failed to start stack walk: 80070057
 77 os thread id: 0x2b64 (11)
 78 child sp       ip call site
 79 05b2f018 77c3166c [gcframe: 05b2f018]
 80 05b2f0f8 77c3166c [helpermethodframe_1obj: 05b2f0f8] system.threading.monitor.enter(system.object)
 81 05b2f170 717f377b system.io.textreader+synctextreader.readline() [f:\dd\ndp\clr\src\bcl\system\io\textreader.cs @ 363]
 82 05b2f180 71651845 system.console.readline() [f:\dd\ndp\clr\src\bcl\system\console.cs @ 1984]
 83 05b2f188 02e90c31 example_7_1_1.program.run2() [e:\visual studio 2022\source\projects\advanceddebug.netframework.test\example_7_1_1\program.cs @ 33]
 84 05b2f1c4 02e90acc example_7_1_1.program+c.b__1_1() [e:\visual studio 2022\source\projects\advanceddebug.netframework.test\example_7_1_1\program.cs @ 19]
 85 05b2f1d0 70f1d4bb system.threading.tasks.task.innerinvoke() [f:\dd\ndp\clr\src\bcl\system\threading\tasks\task.cs @ 2884]
 86 05b2f1dc 70f1b731 system.threading.tasks.task.execute() [f:\dd\ndp\clr\src\bcl\system\threading\tasks\task.cs @ 2498]
 87 05b2f200 70f1b6fc system.threading.tasks.task.executioncontextcallback(system.object) [f:\dd\ndp\clr\src\bcl\system\threading\tasks\task.cs @ 2861]
 88 05b2f204 70eb8604 system.threading.executioncontext.runinternal(system.threading.executioncontext, system.threading.contextcallback, system.object, boolean) [f:\dd\ndp\clr\src\bcl\system\threading\executioncontext.cs @ 980]
 89 05b2f270 70eb8537 system.threading.executioncontext.run(system.threading.executioncontext, system.threading.contextcallback, system.object, boolean) [f:\dd\ndp\clr\src\bcl\system\threading\executioncontext.cs @ 928]
 90 05b2f284 70f1b4b2 system.threading.tasks.task.executewiththreadlocal(system.threading.tasks.task byref) [f:\dd\ndp\clr\src\bcl\system\threading\tasks\task.cs @ 2827]
 91 05b2f2e8 70f1b357 system.threading.tasks.task.executeentry(boolean) [f:\dd\ndp\clr\src\bcl\system\threading\tasks\task.cs @ 2767]
 92 05b2f2f8 70f1b29d system.threading.tasks.task.system.threading.ithreadpoolworkitem.executeworkitem() [f:\dd\ndp\clr\src\bcl\system\threading\tasks\task.cs @ 2704]
 93 05b2f2fc 70e8eb7d system.threading.threadpoolworkqueue.dispatch() [f:\dd\ndp\clr\src\bcl\system\threading\threadpool.cs @ 820]
 94 05b2f34c 70e8e9db system.threading._threadpoolwaitcallback.performwaitcallback() [f:\dd\ndp\clr\src\bcl\system\threading\threadpool.cs @ 1161]
 95 05b2f56c 71faf036 [debuggeru2mcatchhandlerframe: 05b2f56c]
 96 os thread id: 0x1358 (12)
 97 child sp       ip call site
 98 05c6f480 77c3166c [gcframe: 05c6f480]
 99 05c6f5d0 77c3166c [helpermethodframe: 05c6f5d0] system.threading.monitor.enter(system.object)
100 05c6f640 717f377b system.io.textreader+synctextreader.readline() [f:\dd\ndp\clr\src\bcl\system\io\textreader.cs @ 363]
101 05c6f650 71651845 system.console.readline() [f:\dd\ndp\clr\src\bcl\system\console.cs @ 1984]
102 05c6f658 02e90d41 example_7_1_1.program.run3() [e:\visual studio 2022\source\projects\advanceddebug.netframework.test\example_7_1_1\program.cs @ 40]
103 05c6f694 02e90cb4 example_7_1_1.program+c.b__1_2() [e:\visual studio 2022\source\projects\advanceddebug.netframework.test\example_7_1_1\program.cs @ 20]
104 05c6f6a0 70f1d4bb system.threading.tasks.task.innerinvoke() [f:\dd\ndp\clr\src\bcl\system\threading\tasks\task.cs @ 2884]
105 05c6f6ac 70f1b731 system.threading.tasks.task.execute() [f:\dd\ndp\clr\src\bcl\system\threading\tasks\task.cs @ 2498]
106 05c6f6d0 70f1b6fc system.threading.tasks.task.executioncontextcallback(system.object) [f:\dd\ndp\clr\src\bcl\system\threading\tasks\task.cs @ 2861]
107 05c6f6d4 70eb8604 system.threading.executioncontext.runinternal(system.threading.executioncontext, system.threading.contextcallback, system.object, boolean) [f:\dd\ndp\clr\src\bcl\system\threading\executioncontext.cs @ 980]
108 05c6f740 70eb8537 system.threading.executioncontext.run(system.threading.executioncontext, system.threading.contextcallback, system.object, boolean) [f:\dd\ndp\clr\src\bcl\system\threading\executioncontext.cs @ 928]
109 05c6f754 70f1b4b2 system.threading.tasks.task.executewiththreadlocal(system.threading.tasks.task byref) [f:\dd\ndp\clr\src\bcl\system\threading\tasks\task.cs @ 2827]
110 05c6f7b8 70f1b357 system.threading.tasks.task.executeentry(boolean) [f:\dd\ndp\clr\src\bcl\system\threading\tasks\task.cs @ 2767]
111 05c6f7c8 70f1b29d system.threading.tasks.task.system.threading.ithreadpoolworkitem.executeworkitem() [f:\dd\ndp\clr\src\bcl\system\threading\tasks\task.cs @ 2704]
112 05c6f7cc 70e8eb7d system.threading.threadpoolworkqueue.dispatch() [f:\dd\ndp\clr\src\bcl\system\threading\threadpool.cs @ 820]
113 05c6f81c 70e8e9db system.threading._threadpoolwaitcallback.performwaitcallback() [f:\dd\ndp\clr\src\bcl\system\threading\threadpool.cs @ 1161]
114 05c6fa3c 71faf036 [debuggeru2mcatchhandlerframe: 05c6fa3c]
115 os thread id: 0x6e8 (13)
116 child sp       ip call site
117 getframecontext failed: 1
118 00000000 00000000
2.7、使用【!dumpstack】命令查看托管和非托管的线程栈。
测试源码:example_7_1_1
需要切换到主线程,然后执行命令【!dumpstack】
 1 0:000> !dumpstack
 2 os thread id: 0x710 (0)
 3 current frame: ntdll!ntreadfile+0xc
 4 childebp retaddr  caller, callee
 5 00daef38 75dbf25c kernelbase!readfile+0xec, calling ntdll!ntreadfile
 ......
66 00daf7d0 71fb9704 clr!alloc+0x142, calling clr!_eh_epilog3
67 00daf7d8 71fc3cbc clr!hndlogsetevent+0x15, calling clr!gceventenabledsetgchandle
68 00daf9b0 77c052fe ntdll!rtlallocateheap+0x3e, calling ntdll!rtlpallocateheapinternal
69 00daf9d0 7213ca2c clr!eestartuphelper+0xabb, calling clr!_eh_epilog3
70 00daf9d4 7213b55b clr!eestartup+0xb8, calling clr!_seh_epilog4
71 00dafa0c 7215b8a8 clr!executeexe+0x4c, calling clr!systemdomain::executemainmethod
72 00dafa64 7215b9ce clr!_corexemaininternal+0xdc, calling clr!executeexe
73 00dafaa4 72157305 clr!_corexemain+0x4d, calling clr!_corexemaininternal
74 00dafae0 7275fa84 mscoreei!_corexemain+0xd6
75 00dafafc 7636f4c4 kernel32!getprocaddressstub+0x14, calling kernelbase!getprocaddressforcaller
76 00dafb18 7285e81e mscoree!shellshim__corexemain+0x9e
77 00dafb28 72864338 mscoree!_corexemain_exported+0x8, calling mscoree!shellshim__corexemain
78 00dafb30 7636f989 kernel32!basethreadinitthunk+0x19
79 00dafb40 77c27084 ntdll!__rtluserthreadstart+0x2f
80 00dafb9c 77c27054 ntdll!_rtluserthreadstart+0x1b, calling ntdll!__rtluserthreadstart
我们可以使用【!dumpstack -ee】只查看托管栈。
 1 0:000> !dumpstack -ee
 2 os thread id: 0x710 (0)
 3 current frame:
 4 childebp retaddr  caller, callee
 5 00daef9c 70f79b71 (methoddesc 70c438c4 +0x69 domainneutralilstubclass.il_stub_pinvoke(microsoft.win32.safehandles.safefilehandle, byte*, int32, int32 byref, intptr))
 6 00daefc8 70f79b71 (methoddesc 70c438c4 +0x69 domainneutralilstubclass.il_stub_pinvoke(microsoft.win32.safehandles.safefilehandle, byte*, int32, int32 byref, intptr))
 7 00daf00c 716ab275 (methoddesc 70cf7a24 +0x89 system.io.__consolestream.readfilenative(microsoft.win32.safehandles.safefilehandle, byte[], int32, int32, boolean, boolean, int32 byref))
 8 00daf038 716ab17b (methoddesc 70cf7a4c +0x9f system.io.__consolestream.read(byte[], int32, int32))
 9 00daf064 70f5e6a3 (methoddesc 70c2d964 +0x33 system.io.streamreader.readbuffer())
10 00daf07c 70f5eb5b (methoddesc 70c2d96c +0xe3 system.io.streamreader.readline())
11 00daf098 717f3786 (methoddesc 70d22100 +0x1a system.io.textreader+synctextreader.readline())
12 00daf0a8 71651845 (methoddesc 70c19e00 +0x15 system.console.readline())
13 00daf0b0 0144088e (methoddesc 01184d78 +0x46 example_7_1_1.program.main(system.string[]))
2.8、使用【!eestack】和【~*e !dumpstack】查看所有的线程栈。
测试源码:example_7_1_1
1 0:000> !eestack
2 ---------------------------------------------
3 thread   0
4 current frame: ntdll!ntreadfile+0xc
5 childebp retaddr  caller, callee
6 。。。。
7 内容太多,省略了。
~*e !dumpstack执行效果
1 0:000> ~*e !dumpstack
2 os thread id: 0x710 (0)
3 current frame: ntdll!ntreadfile+0xc
4 childebp retaddr  caller, callee
5 00daef38 75dbf25c kernelbase!readfile+0xec, calling ntdll!ntreadfile
6 ......
7 内容太多,省略了。
eestack 命令,可以增加参数,比如:-short,我们可以使用 sos 的帮助命令查看某个命令的解释,比如:eestack。
 1 0:010> !sos.help eestack
 2 -------------------------------------------------------------------------------
 3 !eestack [-short] [-ee]
 4
 5 this command runs !dumpstack on all threads in the process. the -ee option is
 6 passed directly to !dumpstack. the -short option tries to narrow down the
 7 output to "interesting" threads only, which is defined by
 8
 9 1) the thread has taken a lock.(可以显示具有锁的线程)
10 2) the thread has been "hijacked" in order to allow a garbage collection.(可以显示被“劫持”的线程)
11 3) the thread is currently in managed code.(可以显示托管线程)
12
13 see the documentation for !dumpstack for more info.
四、总结
终于写完了,今天这篇文章是第七篇。我们了解了线程和线程调用栈,那调试起来我们就知道如何开始了,知道如何查找参数和局部变量,知道线程栈地址,哦我们可以输出线程栈的内容,对值类型和引用类型了解的也更深入了,当然对线程了解也更深入了,终于做到知其一也知其二了。其实这些知识是相互作用的,不是独立的,任何一个环节的调试,都需要很多技巧。好了,不说了,不忘初心,继续努力,希望老天不要辜负努力的人。
发表评论