1.安装
在vue项目中打开终端执行命令:
npm install echarts --save
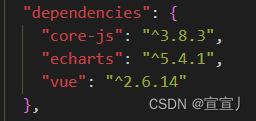
下载后在package.json文件中可以看到下载的echarts版本:
2.导入
在需要使用echarts图表的页面中导入:
import * as echarts from "echarts";
如果多个地方使用的话可以通过全局引入:
import * as echarts from 'echarts'
// 挂载到vue实例
vue.prototype.$echarts = echarts
3.绘制静态图表
在需要用到echarts的地方设置一个有宽高的div盒子
<div>
   <div
   ref="chart"
   style="width:800px;height:600px;margin: auto">
    </div>
</div>
定义echarts关系图的数据
  data() {
   return {
     data: [
       {
         name: "node 1",
         x: 300,
         y: 300,
       },
       {
         name: "node 2",
         x: 800,
         y: 300,
       },
       {
         name: "node 3",
         x: 550,
         y: 100,
       },
       {
         name: "node 4",
         x: 550,
         y: 500,
       },
     ],
     links: [
       {
         source: 0,
         target: 1,
         symbolsize: [5, 20],
         label: {
           show: true,
         },
         linestyle: {
           width: 5,
           curveness: 0.2,
         },
       },
       {
         source: "node 2",
         target: "node 1",
         label: {
           show: true,
         },
         linestyle: {
           curveness: 0.2,
         },
       },
       {
         source: "node 1",
         target: "node 3",
       },
       {
         source: "node 2",
         target: "node 3",
       },
       {
         source: "node 2",
         target: "node 4",
       },
       {
         source: "node 1",
         target: "node 4",
       },
     ],
     num: 0,  // 点击次数
   };
 },
在methods中定义实例化echarts对象的方法,在mounted生命周期中调用(确保dom元素已经挂载到页面当中)
mounted() {
    this.getechartdata();
  },
  methods: {
    getechartdata() {
      const chart = this.$refs.chart;
       // 初始化echarts
      this.mychart = echarts.init(chart);
      let that = this;
       // option就是需要引进echarts关系图中的代码
      let option = {
        title: {
          text: "basic graph",
        },
        tooltip: {},
        animationdurationupdate: 1500,
        animationeasingupdate: "quinticinout",
        series: [
          {
            type: "graph",
            layout: "none",
            symbolsize: 50,
            roam: true,
            label: {
              show: true,
            },
            edgesymbol: ["circle", "arrow"],
            edgesymbolsize: [4, 10],
            edgelabel: {
              fontsize: 20,
            },
            linestyle: {
              opacity: 0.9,
              width: 2,
              curveness: 0,
            },
            // data: []
            data: that.data,
            // links: [],
            links: that.links,
          },
        ],
      };
       // option数据放入图表中
      this.mychart.setoption(option);
    },
  },
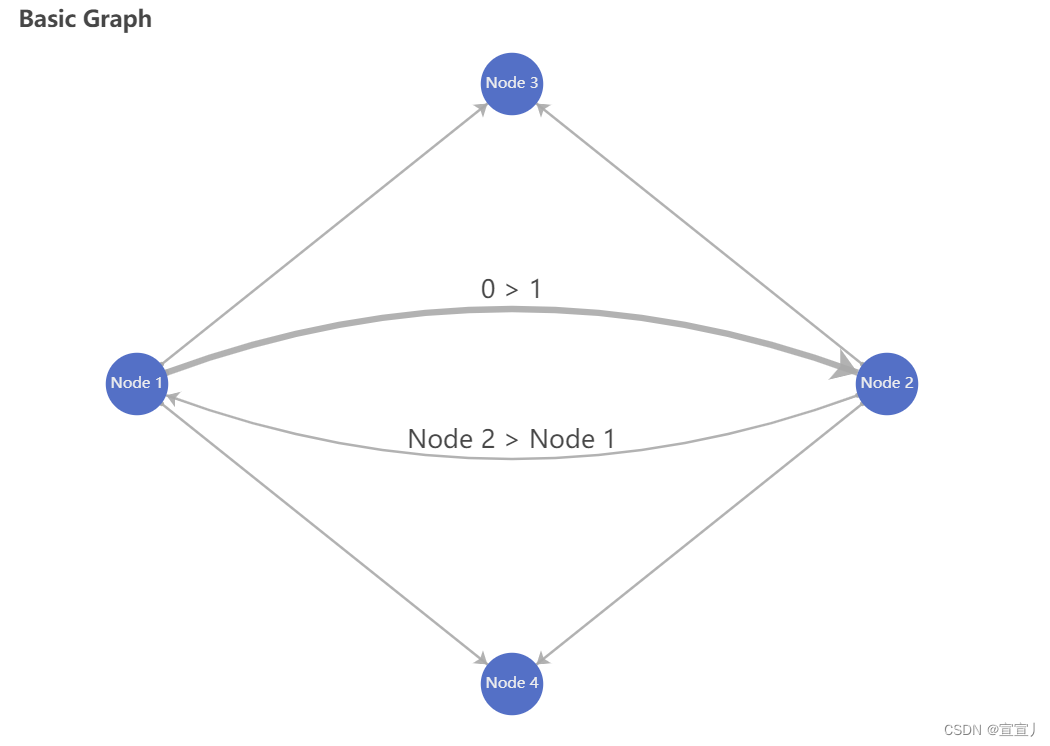
启动项目,在页面中看到如下效果:
4.关系图节点点击事件
上面只是展示了静态的关系图,如节点数据太多,各节点关系复杂,就可只展示主要数据,其他可通过点击节点查看各节点关系
需求:新建一个node5,node5和node2有关系,点击node2展示node5节点
在上面原本的getechartdata()方法中,添加关系图的节点点击事件
通过事件参数param中的datatype属性值确认点击的对象是关系图节点还是节点之间的边缘,值为node时点击的是节点,值为edge时点击的是边缘
通过param中的dataindex值确定点击的节点元素
完整代码如下:
getechartdata() {
      const chart = this.$refs.chart;
      // 初始化echarts
      this.mychart = echarts.init(chart);
      let that = this;
      // option就是需要引进echarts关系图中的代码
      let option = {
        title: {
          text: "basic graph",
        },
        tooltip: {},
        animationdurationupdate: 1500,
        animationeasingupdate: "quinticinout",
        series: [
          {
            type: "graph",
            layout: "none",
            symbolsize: 50,
            roam: true,
            label: {
              show: true,
            },
            edgesymbol: ["circle", "arrow"],
            edgesymbolsize: [4, 10],
            edgelabel: {
              fontsize: 20,
            },
            linestyle: {
              opacity: 0.9,
              width: 2,
              curveness: 0,
            },
            // data: []
            data: that.data,
            // links: [],
            links: that.links,
          },
        ],
      };

      // echarts图表的点击事件,可通过param参数确认点击的对象
      that.mychart.on("click", function (param) {
        if (param.datatype == "node") {
            // node2的 param.dataindex 值为1
          if (param.dataindex == 1) {
              // 判断点击的次数,单数显示node5数据,双数隐藏
            that.num++;
            if (that.num % 2 == 1) {
              that.data.push({
                name: "node 5",
                x: 900,
                y: 300,
              });
              that.links.push({
                source: "node 2",
                target: "node 5",
              });
              that.mychart.setoption(option);
            } else {
              that.data.pop();
              that.links.pop();
              that.mychart.setoption(option);
            }
          }
        } else {
          console.log("点击了边", param);
        }
      });
      // option数据放入图表中
      this.mychart.setoption(option);
    },
最终效果如下:
总结
以上为个人经验,希望能给大家一个参考,也希望大家多多支持代码网。


发表评论