前言
vue中使用echarts图,并且使用他的点击事件就会发现一个问题,第一次我echarts图的点击事件是生效的而且正常的,但是一旦重新渲染这个echarts图以后,就会出现再重新渲染一次,(相当于2次渲染echarts图),点击事件会被调用2次,第二次重新渲染,点击事件就会被调用3次,这个问题。
问题展示
(我这里是调用后台,我的日历刷新一次时间,就会重新渲染一次我的echarts图)
正常点击事件
(前,点击一次调用一次后台)
异常
(当我选了日历以后,重新渲染echarts图,再点击的时候,重新渲染几次,点击多几次)
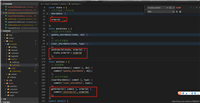
解决办法
再渲染echarts图前加
this.mychart.off('click') // 这里很重要!!解决重复点击
this.mychart = echarts.init(this.$refs.chart);
          this.mychart.off('click') // 这里很重要!!解决重复点击
          this.mychart.setoption({
封装组件源码
<template>
  <div class="echarts" ref="chart"></div>
</template>

<script>
  const echarts = require('echarts');
  export default {
    props:{
      data:{//echarts数据
        type:array,
        default:()=>[]
      },
      params:object,
    },
    data () {
      return {
        name:'柱图',
        mychart:null,
      };
    },
    components: {},
    mounted() {
      this.initcharts(this.data);
    },
    watch:{
      data(val){
          this.initcharts(val);
      }
    },

    methods: {
      initcharts(data){
        if(data.length==0){
          return;
        }
        let unit = this.params.unit;//单位
        /**
         * 处理数据
         */
        // let dataaxis = ['10.24', '10.25', '10.26', '10.27', '10.28', '10.29', '今日'];
        // let ydata =  [220, 182, 191, 234, 290, 330, 310];
        let dataaxis = [];
        let ydata = [];
        data.foreach(item => {
          dataaxis.push(item.date);//日期
          ydata.push(item.value);//积分
        });
        let maxlengthval = ydata.length-1;

        /**
         * 获取数据内部最大值,+100来设置背景图高度
         */
        var max = ydata.reduce( (a,b)=> b > a ? b : a );//获取最大值
        var datashadow = [];
        var ymax;
        if(max<100){
          ymax = max+30;
        }else if(max>100 && max<500){
          ymax = max+100;
        }else{
           ymax = max+200;
        }
        for (var i = 0; i < ydata.length; i++) {
            datashadow.push(ymax);
        }

          this.mychart = echarts.init(this.$refs.chart);
          this.mychart.off('click') // 这里很重要!!解决重复点击
          this.mychart.setoption({
              xaxis: {
                  data: dataaxis,
                  axislabel: {
                      inside: true,
                      textstyle: {
                          color: '#000',
                          fontsize:'100%'
                      }
                  },
                  axistick: {
                      show: false
                  },
                  axisline: {
                      show: false
                  },
                  position: "top",
                  z:10

              },
              yaxis: {
                  axisline: {
                      show: false
                  },
                  axistick: {
                      show: false
                  },
                  axislabel: {
                       show: false
                  },
                  splitline:{//网格线
                    show:false
                 }
              },
              datazoom: [
                  {
                      type: 'inside'
                  }
              ],
              series: [
                  { // for shadow
                      type: 'bar',
                      itemstyle: {
                          normal: {color: '#f6fbfe'},
                          emphasis: {color: 'rgba(255,188,117,.3)'}
                      },
                      bargap:'-100%',
                      barcategorygap:'40%',
                      data: datashadow,
                      animation: false
                  },
                  {
                      type: 'bar',
                      label: {
                          normal: {
                              show: true,
                              position: 'top',
                              color:'#000',
                              fontsize:'100%',
                              formatter: function (params) {
                                  return params.value+unit;
                              },
                          },
                      },
                      itemstyle: {
                          normal: {
                              // color: new echarts.graphic.lineargradient(
                              //     0, 0, 0, 1,
                              //     [
                              //         {offset: 0, color: '#ff3405'},
                              //         {offset: 0.5, color: '#ff6a47'},
                              //         {offset: 1, color: '#ff9076'}
                              //     ]
                              // )
                              color: function(params) {
                                        if(params.dataindex == maxlengthval){
                                          return new echarts.graphic.lineargradient(
                                              0, 0, 0, 1,
                                              [
                                                  {offset: 0, color: '#ff3405'},
                                                  {offset: 0.5, color: '#ff6a47'},
                                                  {offset: 1, color: '#ff9076'}
                                              ]
                                          );
                                        };
                                        return  new echarts.graphic.lineargradient(
                                              0, 0, 0, 1,
                                              [
                                                  {offset: 0, color: '#ffbd77'},
                                                  {offset: 0.5, color: '#ff9f38'},
                                                  {offset: 1, color: '#ff8505'}
                                              ]
                                          );
                                    }
                          },
                          emphasis: {
                              color: new echarts.graphic.lineargradient(
                                  0, 0, 0, 1,
                                  [
                                      {offset: 0, color: '#ff3405'},
                                      {offset: 0.5, color: '#ff6a47'},
                                      {offset: 1, color: '#ff9076'}
                                  ]
                              )
                          }
                      },
                      data: ydata
                  }
              ]

           })
        this.mychart.on('click',(params)=>{
             let name = '';
             data.foreach(item=>{
               if(item.date == params.name){
                 name = item.dateyear
               }
             })
              this.$emit('echartsclick',name);
           });
      },

    },
  }

</script>
<style lang='less' scoped>
  .echarts{
    width: 100%;
    height:100%;
  }
</style>
总结
以上为个人经验,希望能给大家一个参考,也希望大家多多支持代码网。


发表评论