一:背景
1. 讲故事
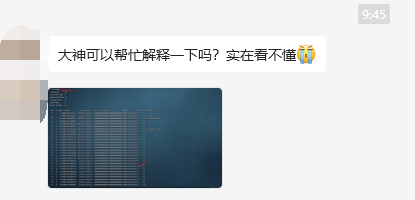
很多.net开发者在学习高级调试的时候,使用sos的命令输出会发现这里也看不懂那里也看不懂,比如截图中的这位朋友。

.net高级调试属于一个偏冷门的领域,国内可观测的资料比较少,所以很多东西需要你自己去探究源代码,然后用各种调试工具去验证,相关源代码如下:
- coreclr: https://github.com/dotnet/runtime
- windows: https://github.com/reactos/reactos
- linux: https://www.kernel.org/
这一篇权当抛砖引玉,来引导一下如何去探索。
二:windbg 分析
1. 复原现象
为了方便讲述先上一段简单的测试代码,来观察一下线程列表中所谓的 lockcount 列。
    internal class program
    {
        static void main(string[] args)
        {
            console.writeline("hello world...");
            debugger.break();
        }
    }
接下来用 windbg 附加一下,使用 !threads 命令观察输出。
0:000> !t
threadcount:      3
unstartedthread:  0
backgroundthread: 2
pendingthread:    0
deadthread:       0
hosted runtime:   no
                                                                                                            lock
 dbg   id     osid threadobj           state gc mode     gc alloc context                  domain           count apt exception
   0    1     14c8 000001a8b862dbb0    2a020 preemptive  000001a8ba1ddee0:000001a8ba1df478 000001a8b8623c20 0     mta
   5    2     71e0 000001a8d25740b0    2b220 preemptive  0000000000000000:0000000000000000 000001a8b8623c20 0     mta (finalizer)
   7    3     31b0 000001a8b86e7730  102a220 preemptive  0000000000000000:0000000000000000 000001a8b8623c20 0     mta (threadpool worker)
从上面的卦中可以看到 lock count=0,那这里的值取自源码的哪里呢?
2. 取自哪里
大家要知道每一行记录都是在coreclr thread中摘取出来的字段,言外之意就是可以把 thread 所有信息给展示出来,可以用 dt 命令,简化后如下:
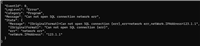
0:000> dt coreclr!thread 000001a8b862dbb0
   +0x000 __vfn_table : 0x00007ffd`d2f93c70
   =00007ffd`d30ce8d8 m_detachcount    : 0n0
   =00007ffd`d30ce8d4 m_activedetachcount : 0n0
   =00007ffd`d30cf4dc m_threadsatunsafeplaces : volatile<long>
   +0x008 m_state          : volatile<enum thread::threadstate>
   +0x00c m_fpreemptivegcdisabled : volatile<unsigned long>
   +0x010 m_pframe         : 0x0000006f`df57e328 frame
   +0x018 m_pdomain        : 0x000001a8`b8623c20 appdomain
   +0x020 m_dwlockcount    : 0
   +0x024 m_threadid       : 1
   ...
通过仔细分析卦中信息,可以发现这个 lockcount 其实就是 m_dwlockcount 字段,知道是这个字段之后接下来就是寻找coreclr源码啦,截图如下:
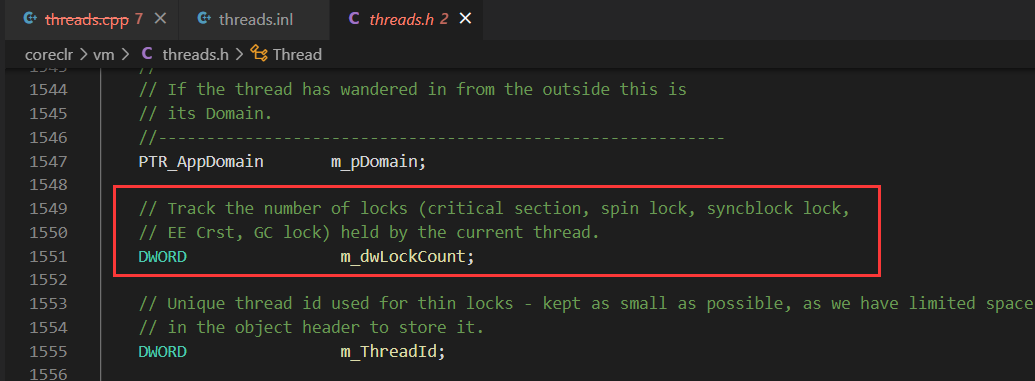
从源码注释中看的非常清楚,这个字段可用来跟踪5中锁。
- critical section
- spin lock
- syncblock lock
- ee crst
- gc lock
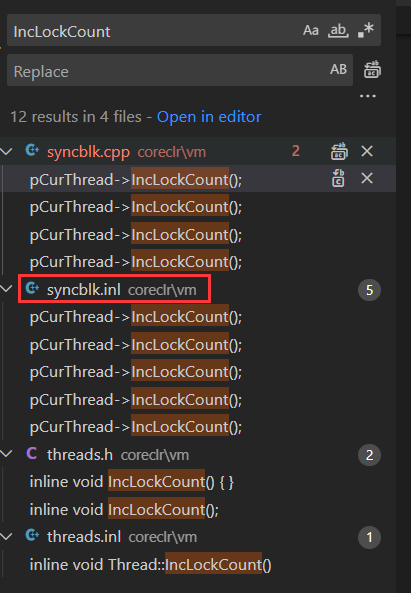
接下来搜索下源码看看 m_dwlockcount 是怎么更新的,可以发现如下两处,并且都是和同步块索引相关,截图如下:
inline void thread::inclockcount()
{
    limited_method_contract;
    _asserte(getthread() == this);
    m_dwlockcount++;
    _asserte(m_dwlockcount != 0 || hasthreadstatenc(tsnc_unbalancedlocks));
}
inline void thread::declockcount()
{
    limited_method_contract;
    _asserte(getthread() == this);
    _asserte(m_dwlockcount > 0 || hasthreadstatenc(tsnc_unbalancedlocks));
    m_dwlockcount--;
}
接下来要做的一件事就是如何自增 m_dwlockcount 值 来模拟达到这位朋友的 1024。
3. 如何模拟复现
其实当你知道是跟踪这五种锁,要模拟就非常简单了,为了方便讲述上一段测试代码,利用 lock 让 m_dwlockcount 字段不断自增,参考如下:
    internal class program
    {
        public static object[] locks;
        static void main(string[] args)
        {
            locks = enumerable.range(0, 100).select(i => new object()).toarray();
            foreach (var item in locks)
            {
                monitor.enter(item);
            }
            debugger.break();
            console.readline();
        }
    }
接下来用 windbg 附加观察一下。
0:000> !t
threadcount: 3
unstartedthread: 0
backgroundthread: 2
pendingthread: 0
deadthread: 0
hosted runtime: no
lock
dbg id osid threadobj state gc mode gc alloc context domain count apt exception
0 1 6c90 00000239840ddbb0 2a020 preemptive 0000023985b2bb38:0000023985b2d478 00000239840d3c20 100 mta
5 2 2178 00000239859640b0 2b220 preemptive 0000000000000000:0000000000000000 00000239840d3c20 0 mta (finalizer)
7 3 6d00 0000023984197700 102a220 preemptive 0000000000000000:0000000000000000 00000239840d3c20 0 mta (threadpool worker)
0:000> dt coreclr!thread 00000239840ddbb0
+0x000 __vfn_table : 0x00007ffd`d2f93c70
=00007ffd`d30ce8d8 m_detachcount : 0n0
=00007ffd`d30ce8d4 m_activedetachcount : 0n0
=00007ffd`d30cf4dc m_threadsatunsafeplaces : volatile<long>
+0x008 m_state : volatile<enum thread::threadstate>
+0x00c m_fpreemptivegcdisabled : volatile<unsigned long>
+0x010 m_pframe : 0x00000074`a937e888 frame
+0x018 m_pdomain : 0x00000239`840d3c20 appdomain
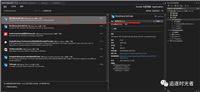
+0x020 m_dwlockcount : 0x64这里顺便提一下,如果你想实时观察 m_dwlockcount 更改的线程栈信息,可以在 thread+0x20处下一个ba硬件断点即可。
0:000> !t
threadcount:      3
unstartedthread:  0
backgroundthread: 2
pendingthread:    0
deadthread:       0
hosted runtime:   no
                                                                                                            lock
 dbg   id     osid threadobj           state gc mode     gc alloc context                  domain           count apt exception
   0    1     6188 00000290d550dbb0    2a020 preemptive  00000290d6f4ad20:00000290d6f4b478 00000290d5503c20 0     mta
   5    2     686c 00000290ef3f40b0    2b220 preemptive  0000000000000000:0000000000000000 00000290d5503c20 0     mta (finalizer)
   7    3     312c 00000290d55c7740  102a220 preemptive  0000000000000000:0000000000000000 00000290d5503c20 0     mta (threadpool worker)
0:000> ba w4 00000290d550dbb0+0x20
0:000> g
modload: 00007ffd`cff80000 00007ffd`cffd1000   c:\program files\dotnet\shared\microsoft.netcore.app\3.1.32\system.collections.dll
modload: 00007ffd`d00d0000 00007ffd`d0103000   c:\program files\dotnet\shared\microsoft.netcore.app\3.1.32\system.runtime.extensions.dll
breakpoint 1 hit
coreclr!jit_monenter_portable+0x65:
00007ffd`d298c8a5 4883c430        add     rsp,30h
0:000> kl 5
 # child-sp          retaddr               call site
00 000000b5`f917e780 00007ffd`72e917f4     coreclr!jit_monenter_portable+0x65
01 000000b5`f917e7c0 00007ffd`d29b6ca3     0x00007ffd`72e917f4
02 000000b5`f917e860 00007ffd`d294cc62     coreclr!calldescrworkerinternal+0x83
03 (inline function) --------`--------     coreclr!calldescrworkerwithhandler+0x57
04 000000b5`f917e8a0 00007ffd`d2953c29     coreclr!methoddesccallsite::calltargetworker+0x196
...
三:总结
还是那句话,国内.net高级调试方面的资料甚少,要想理解sos命令输出是什么意思,切记多看源码,其实本篇重要的不是知识,而是告诉你如何去探究新知的方法。
到此这篇关于.net高级调试之sos命令输出看不懂怎么办的文章就介绍到这了,更多相关.net sos命令输出内容请搜索代码网以前的文章或继续浏览下面的相关文章希望大家以后多多支持代码网!
发表评论