1、在agent上面准备脚本
查看oracle表空间的sql
set linesize 300
set tab off
set pagesize 1000
col tablespacename format a30
select substr(a.tablespace_name,1,30) tablespacename,
round(sum(a.bytes/1024/1024/1024),2) as "totle_size(g)",
round(sum(nvl(b.free_space1/1024/1024/1024,0)),2) as "free_space(g)",
round(sum(a.bytes/1024/1024/1024),2)-round(sum(nvl(b.free_space1/1024/1024/1024,0)),2) as "used_space(g)",
round((sum(a.bytes/1024/1024/1024)-sum(nvl(b.free_space1/1024/1024/1024,0))) *100/sum(a.bytes/1024/1024/1024),2) as "used_percent%",
round(sum((case when a.maxbytes = 0 then a.bytes else a.maxbytes end)/1024/1024/1024),2) as "max_size(g)",
round((sum(a.bytes/1024/1024/1024)-sum(nvl(b.free_space1/1024/1024/1024,0)))*100/sum((case when a.maxbytes = 0 then a.bytes else a.maxbytes end)/1024/1024/1024),2) as "max_percent%"
from dba_data_files a,
(select sum(nvl(bytes,0)) free_space1,
file_id
from dba_free_space
group by file_id
) b
where a.file_id = b.file_id(+)
group by a.tablespace_name
order by "used_percent%" desc;
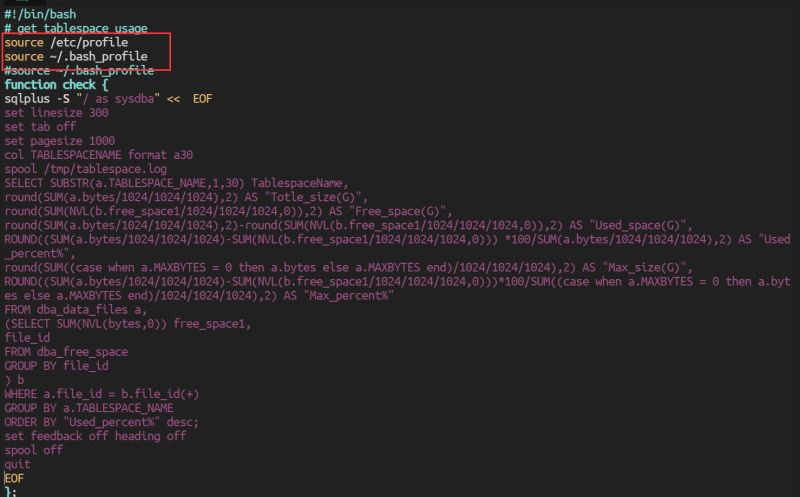
(1)定义查表空间使用率的脚本 /home/oracle/get_tablespace_usage.sh
#!/bin/bash
# get tablespace usage
export oracle_home=/u01/app/oracle/product/11.2.0.4/dbhome_1/
export path=$oracle_home/bin:$path
source /etc/profile
source ~/.oracle_profile
#source ~/.bash_profile
function check {
sqlplus -s "/ as sysdba" <<  eof
set linesize 300
set tab off
set pagesize 1000
col tablespacename format a30
spool /tmp/tablespace.log
select substr(a.tablespace_name,1,30) tablespacename,
round(sum(a.bytes/1024/1024/1024),2) as "totle_size(g)",
round(sum(nvl(b.free_space1/1024/1024/1024,0)),2) as "free_space(g)",
round(sum(a.bytes/1024/1024/1024),2)-round(sum(nvl(b.free_space1/1024/1024/1024,0)),2) as "used_space(g)",
round((sum(a.bytes/1024/1024/1024)-sum(nvl(b.free_space1/1024/1024/1024,0))) *100/sum(a.bytes/1024/1024/1024),2) as "used_percent%",
round(sum((case when a.maxbytes = 0 then a.bytes else a.maxbytes end)/1024/1024/1024),2) as "max_size(g)",
round((sum(a.bytes/1024/1024/1024)-sum(nvl(b.free_space1/1024/1024/1024,0)))*100/sum((case when a.maxbytes = 0 then a.bytes else a.maxbytes end)/1024/1024/1024),2) as "max_percent%"
from dba_data_files a,
(select sum(nvl(bytes,0)) free_space1,
file_id
from dba_free_space
group by file_id
) b
where a.file_id = b.file_id(+)
group by a.tablespace_name
order by "used_percent%" desc;
set feedback off heading off
spool off
quit
eof
};
check &> /dev/null
errors=`grep error /tmp/tablespace.log | wc -l`
if [ "$errors" -gt 0 ]; then
    echo "" > /tmp/tablespace.log
fi
chown oracle: get_tablespace_usage.sh chmod 755 get_tablespace_usage.sh
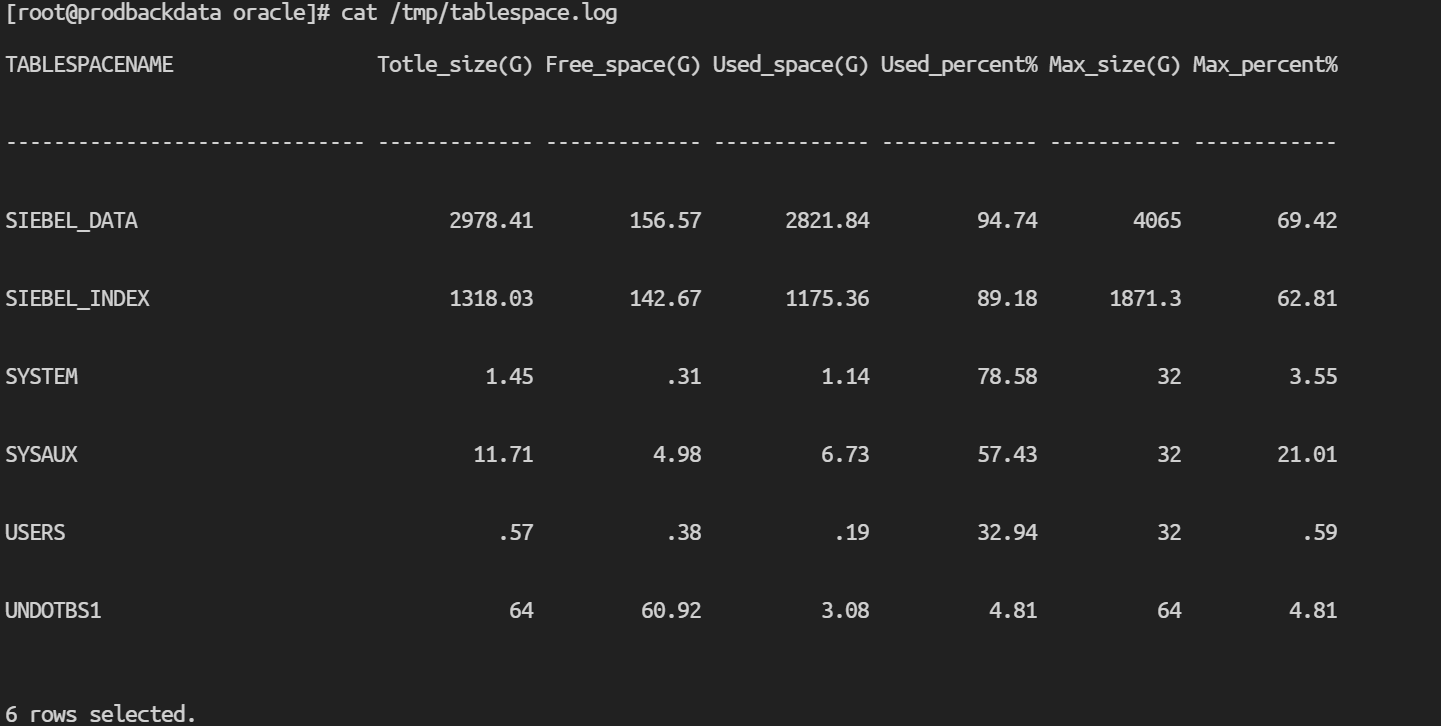
可以用oracle用户手动执行一下脚本,查看/tmp/tablespace.log中有没有内容输入, 必须要oracle用户。
(2)定义表空间自动发现的脚本
/etc/zabbix/scripts/discovery_tablespace.sh
#!/bin/bash
# zabbix auto discovery oracle tablespace
tablespaces=(`cat /tmp/tablespace.log | awk '{print $1}' | grep -v "^$"`)
length=${#tablespaces[@]}
printf "{\n"
printf '\t'"\"data\":["
for ((i=0;i<$length;i++))
do
    printf "\n\t\t{"
    printf "\"{#tablespace_name}\":\"${tablespaces[$i]}\"}"
    if [ $i -lt $[$length-1] ];then
        printf ","
    fi
done
    printf "\n\t]\n"
printf "}\n"
chmod 755 /etc/zabbix/scripts/discovery_tablespace.sh
(3)定义表空间监控项脚本
/etc/zabbix/scripts/tablespace_check.sh
#!/bin/bash
# oracle tablespace check
tablespace_name=$1
grep "\b$tablespace_name\b" /tmp/tablespace.log | awk '{print $2}'
chmod 755 /etc/zabbix/scripts/tablespace_check.sh
2、将脚本a放入crontab里面
su - oracle
crontab -e
	*/5 * * * * /home/oracle/get_tablespace_usage.sh
计划任务里的环境变量会与外面的不一致,导致脚本没有执行,因为/tmp/tablespace.log的修改时间没有变化。
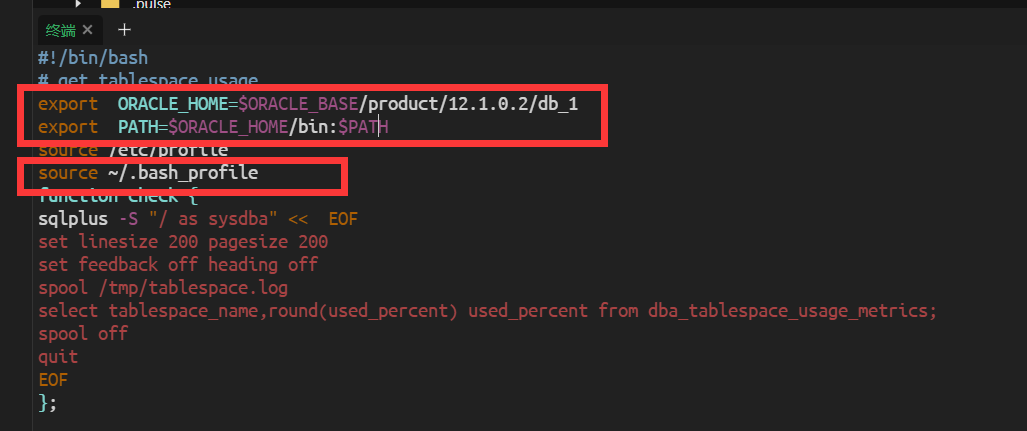
注意:!!! 需要在脚本中添加两行 或者在脚本中添加oracle_home的完整路径,例如第三行。
一般路径及文件是/home/oracle/.bash_profile
source的路径需要看oracle的环境变量写在哪个文件里
另一台服务器我也是这样写的脚本,把oracle的环境变量和环境变量文件都写上了,但是计划任务执行了,/tmp/tablespace.log文件的修改时间还是没有变化。
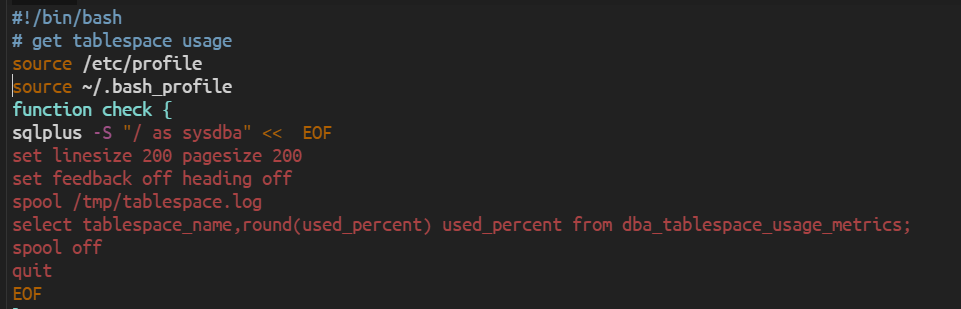
把第一个框框里的两句话删除就好了!!!,可能是自己写的oracle路径,和环境变量中的有冲突
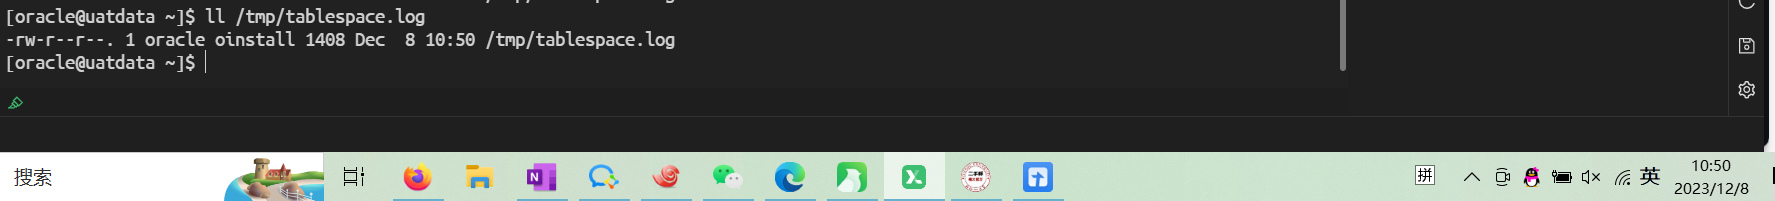
修改时间已是最新时间(计划任务执行的时间)
3、编辑agent参数
vim /etc/zabbix/zabbix_agent.d/oracle.conf
# tablespace usage
userparameter=discovery.tablespace,/etc/zabbix/scripts/discovery_tablespace.sh
userparameter=tablespace.check.[*],/etc/zabbix/scripts/tablespace_check.sh $1
我用这个方法zabbix报错找不到监控项
我只能用笨的方法,把表空间一个一个从/tmp/tablespace.log中取出来。
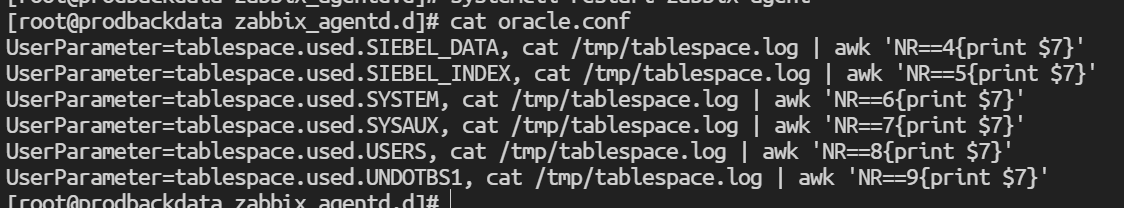
然后在zabbix页面中找到相应的主机一个一个添加监控项。
配置触发器,表空间大于90%触发,最后加入动作。
以上就是zabbix监控oracle表空间的操作方法的详细内容,更多关于zabbix监控oracle表空间的资料请关注代码网其它相关文章!


发表评论