mysql 查看某张表的历史sql
五花八门的工具 以至于现在对于基础操作已全然不知。正赶上 公司财政赤字的紧缩期,没有付费开启任何可视化操作工具,只能自己开挖底层,开挖最底层的binlog。
mysql本身并不直接提供查看某张表历史sql的功能,但可以通过以下几种方法间接实现:
1.查看mysql通用查询日志(需提前开启)
-- 查看通用日志是否开启
show variables like 'general_log%';

-- 如果开启,查看日志文件位置
show variables like 'general_log_file';

-- 临时开启通用日志(生产环境慎用)
set global general_log = 'on';
然后可以查询日志文件:
# linux下查看包含特定表的sql
grep -i '表名' /var/lib/mysql/localhost.log

# 或使用mysql命令行
mysql> select * from mysql.general_log
where argument like '%表名%'
and event_time > '2024-01-01';
2.查看慢查询日志
-- 查看慢查询日志设置
show variables like 'slow_query_log%';
show variables like 'long_query_time';

-- 查看慢查询日志位置
show variables like 'slow_query_log_file';
查看日志文件:
-- 使用mysqldumpslow工具分析
mysqldumpslow -s t -t 10 /path/to/slow.log | grep '表名'

-- 或直接查看
cat /path/to/slow.log | grep '表名'
3.使用performance_schema(mysql 5.6+)
-- 开启相关监控
update performance_schema.setup_consumers
set enabled = 'yes'
where name like '%statement%';

-- 查看历史语句(包含完整sql)
select * from performance_schema.events_statements_history
where sql_text like '%表名%'
order by event_time desc
limit 100;

-- 查看更详细的历史
select * from performance_schema.events_statements_history_long
where sql_text like '%表名%';
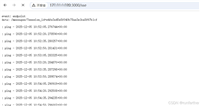
4.查看二进制日志(binlog)
-- 查看当前binlog文件
show master status;

-- 查看所有binlog文件
show binary logs;

-- 使用mysqlbinlog工具解析
mysqlbinlog --base64-output=decode-rows -v mysql-bin.000001 | grep -a5 -b5 '表名'
5.使用第三方工具或方案
a.数据库审计插件
-- 如使用mariadb审计插件
install plugin server_audit soname 'server_audit.so';
set global server_audit_events = 'query';
b.应用层记录
在应用程序中记录所有执行的sql:
// spring boot示例:使用aop记录sql
@aspect
@component
public class sqllogaspect {
    @before("execution(* com.example.mapper.*.*(..))")
    public void logsql(joinpoint joinpoint) {
        // 获取执行的sql并记录到日志文件
    }
}
6.推荐的最佳实践
方案一:实时监控设置
-- 1. 开启performance_schema
[mysqld]
performance_schema = on
performance-schema-consumer-events-statements-history-long = on

-- 2. 创建定期清理任务
create event cleanup_sql_history
on schedule every 1 day
do
delete from performance_schema.events_statements_history_long
where event_time < now() - interval 7 day;
方案二:使用proxysql或maxscale中间件
这些中间件可以记录所有经过的sql语句。
方案三:云数据库的解决方案
- aws rds/aurora:使用performance insights和enhanced monitoring
- 阿里云rds:使用sql审计功能
- 腾讯云cdb:使用数据库审计服务
注意事项:
- 性能影响:开启完整sql日志会对性能有影响
- 存储空间:需要足够的磁盘空间存储日志
- 安全性:日志中可能包含敏感信息,需做好保护
- 时效性:大部分历史记录都有保留时间限制
快速检查当前执行的sql:
-- 查看当前正在执行的sql
show processlist;

-- 查看更详细的信息
select * from information_schema.processlist
where info like '%表名%';

-- 使用performance_schema查看
select * from performance_schema.threads
where processlist_info like '%表名%';
选择哪种方法取决于你的具体需求、mysql版本以及是否愿意接受性能开销。对于生产环境,建议使用performance_schema或专门的审计工具。
以上就是mysql查看表的历史sql的几种实现方法的详细内容,更多关于mysql查看表的历史sql的资料请关注代码网其它相关文章!


发表评论