mysql cpu 占用过高时,排查具体占用资源的表需结合系统监控、数据库分析工具和 sql 诊断命令。
一、快速定位问题根源
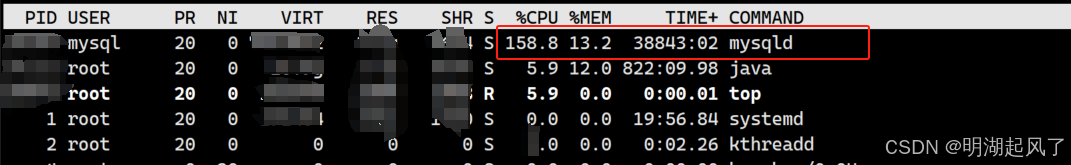
确认 mysql 进程占用 cpu
- 使用
top或htop命令查看系统进程,确认是否为mysqld进程导致 cpu 飙升。 - 若 mysql 进程持续占用 90% 以上 cpu,需深入分析数据库内部操作。
区分负载类型:qps 激增 vs. 慢查询
- qps 激增:对比 cpu 曲线与 qps(每秒查询量)曲线是否同步波动。若同步,说明高并发导致 cpu 压力。
- 计算 qps:
show global status like 'questions';  -- 获取总查询量
show global status like 'uptime';     -- 获取运行时间(秒)
-- qps = questions / uptime
- 慢查询为主:若 cpu 飙高而 qps 未明显上升,大概率是慢 sql 或锁竞争导致。
二、定位高资源消耗的表
方法 1:实时分析活跃线程
通过 show full processlist 或系统表查询当前执行的 sql 及操作的表:
-- 查看所有活跃线程(非 sleep 状态)
select * from information_schema.processlist
where command != 'sleep' and time > 10  -- 筛选执行时间>10秒的线程
order by time desc;
- 关键字段:
state:若为sending data、sorting result或creating tmp table,表示可能涉及全表扫描或复杂计算。info:显示正在执行的 sql,从中提取操作的表名。
方法 2:分析慢查询日志
- 开启慢查询日志:
set global slow_query_log = 'on';
set global long_query_time = 1;  -- 记录超过1秒的查询
set global slow_query_log_file = '/var/log/mysql/slow.log';
- 使用工具分析日志:
- **
pt-query-digest(percona toolkit)**:
- **
pt-query-digest /var/log/mysql/slow.log --limit 10 -- 输出消耗最高的前10个查询
- 输出结果关注点:
table:被频繁操作的表名。rows_examined:扫描行数过大(如百万级)的表。query_time:单次执行耗时长的 sql。
方法 3:通过 performance schema 定位表级操作
-- 查看消耗 cpu 最高的 sql 及其操作的表
select
  digest_text as query,
  schema_name as db,
  count_star as exec_count,
  sum_timer_wait/1e9 as total_time_sec,
  sum_rows_examined as rows_examined
from performance_schema.events_statements_summary_by_digest
order by total_time_sec desc
limit 10;
- 关键信息:
query字段可直接看到 sql 操作的表(如select * from orders)。- exec_count 该sql模式被执行的次数
- total_time_sec 该sql模式所有执行的总耗时(单位:皮秒,除以1e9转换为秒;例如:
sum_timer_wait=1234567890000→1.23456789秒;识别最耗时的sql模式 - rows_examined 该sql模式所有执行中检查的总行数;例如:
1000000(表示这个sql模式总共扫描了100万行),用于识别全表扫描或索引效率低下的查询
方法 4:检查表大小与索引状态
查询表空间占用:
select
  table_name,
  round((data_length + index_length)/1024/1024, 2) as size_mb,
  table_rows
from information_schema.tables
where table_schema = 'your_database'
order by size_mb desc;
- 大表(gb 级) 更容易因全表扫描导致 cpu 飙升。
- 小表但高扫描频次:可能索引缺失或统计信息过期。
检查索引有效性:
-- 查看表的索引情况
show index from your_table;
- 若
cardinality(基数)远小于实际行数,说明索引可能失效,需更新统计信息:
analyze table your_table;
三、针对性优化措施
紧急处理:
终止高消耗线程:
kill <thread_id>; -- 从 processlist 获取 thread_id
索引优化:
- 为高频查询的
where、join、order by字段添加索引。 - 避免索引失效:
- 禁止对索引列使用函数(如
where date(create_time) = ...)。 - 避免隐式类型转换(如字符串字段用数字查询)。
- 禁止对索引列使用函数(如
sql 重写:
- 拆分复杂查询(如将子查询改为 join)。
- 减少
select *,仅返回必要字段。 - 分页查询优化:用
where id > last_id limit n替代offset。
配置调整:
增加临时表大小,避免磁盘临时表:
tmp_table_size = 256m
max_heap_table_size = 256m
调整 innodb 缓冲池(通常设为物理内存的 70%):
innodb_buffer_pool_size = 8g
架构扩展:
- 读写分离:将查询分流到只读副本。
- 分库分表:对亿级大表按业务拆分。
排查工具推荐
| 工具类型 | 推荐工具 | 用途 |
|---|---|---|
| 系统监控 | top, htop, vmstat | 定位进程及线程级 cpu 占用 |
| sql 分析 | pt-query-digest, explain | 分析慢查询及执行计划 |
| 实时诊断 | show processlist, sys.schema | 查看活跃线程与资源消耗 |
| 可视化监控 | prometheus + grafana, pmm | 长期追踪性能指标(qps/cpu/锁) |
注意
- 锁竞争问题:若
show processlist显示大量线程状态为waiting for table lock,需检查长事务或死锁(information_schema.innodb_trx)。 - 外部因素:备份任务、批量数据维护也可能导致 cpu 短暂飙高,需结合操作日志排查。
以上就是mysql cpu占用过高的排查指南的详细内容,更多关于mysql cpu占用过高的资料请关注代码网其它相关文章!


发表评论