一、mysqld_exporter window下载及安装过程
1、下载路径地址:
https://prometheus.io/download/
选择“window”,页面向下滑动或者关键词搜索“mysqld_exporter”

找到需要下载的版本

2、解压之后,目录结构如下图

当前目录下新建my.cnf的文件,文件里面填写如下所示的内容,然后保存。
[client]
user=root 替换为数据库服务器用户名
password=xxx 替换为数据库服务器密码
host=xxxx 替换为数据库服务器ip
port=6446 替换为数据库服务器端口

文件新建完毕之后的目录结构

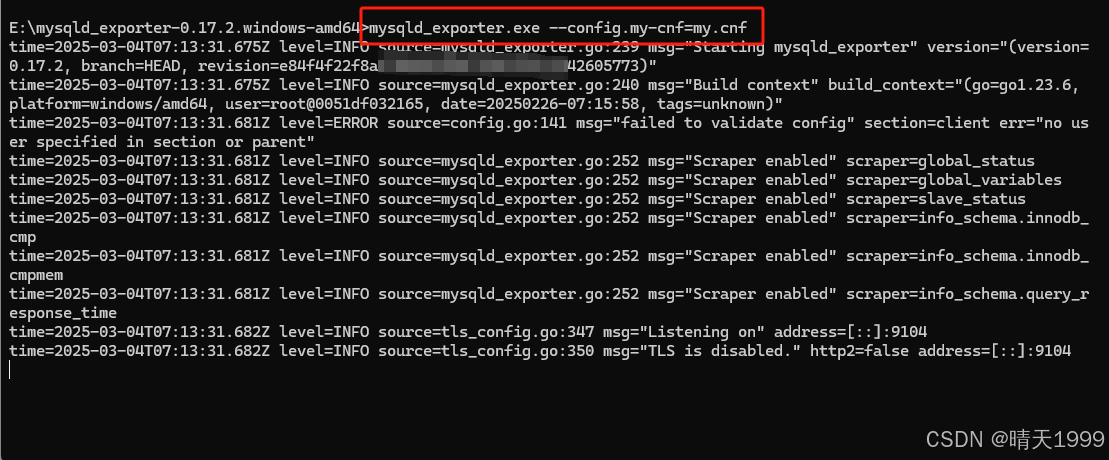
3、当前目录下输入cmd,打开命令行界面

命令行输入:
mysqld_exporter.exe --config.my-cnf=my.cnf
看到如下的打印文件
4、访问exporter
http://localhost:9104
看到如下的界面及表示安装成功。点击“metrics”既可以查看explorter采集到的数据库信息

二、prometheus配置exporter
1、打开该文件添加如下的数据

  - job_name: "mysql"
    static_configs:
      - targets: ["localhost:9104"]
2、启动prometheus
双加exe文件

3、访问prometheus地址
http://localhost:9090/

status--targets,是up状态即表示成功

三、grafana配置prometheus
grafana的window安装及配置过程参考如下文章:
grafana window下载安装及influxdb集成配置
1、启动grafana,新建prometheus源

url为prometheus的链接地址

点击save&test,如果提示成功,即表示链接ok。

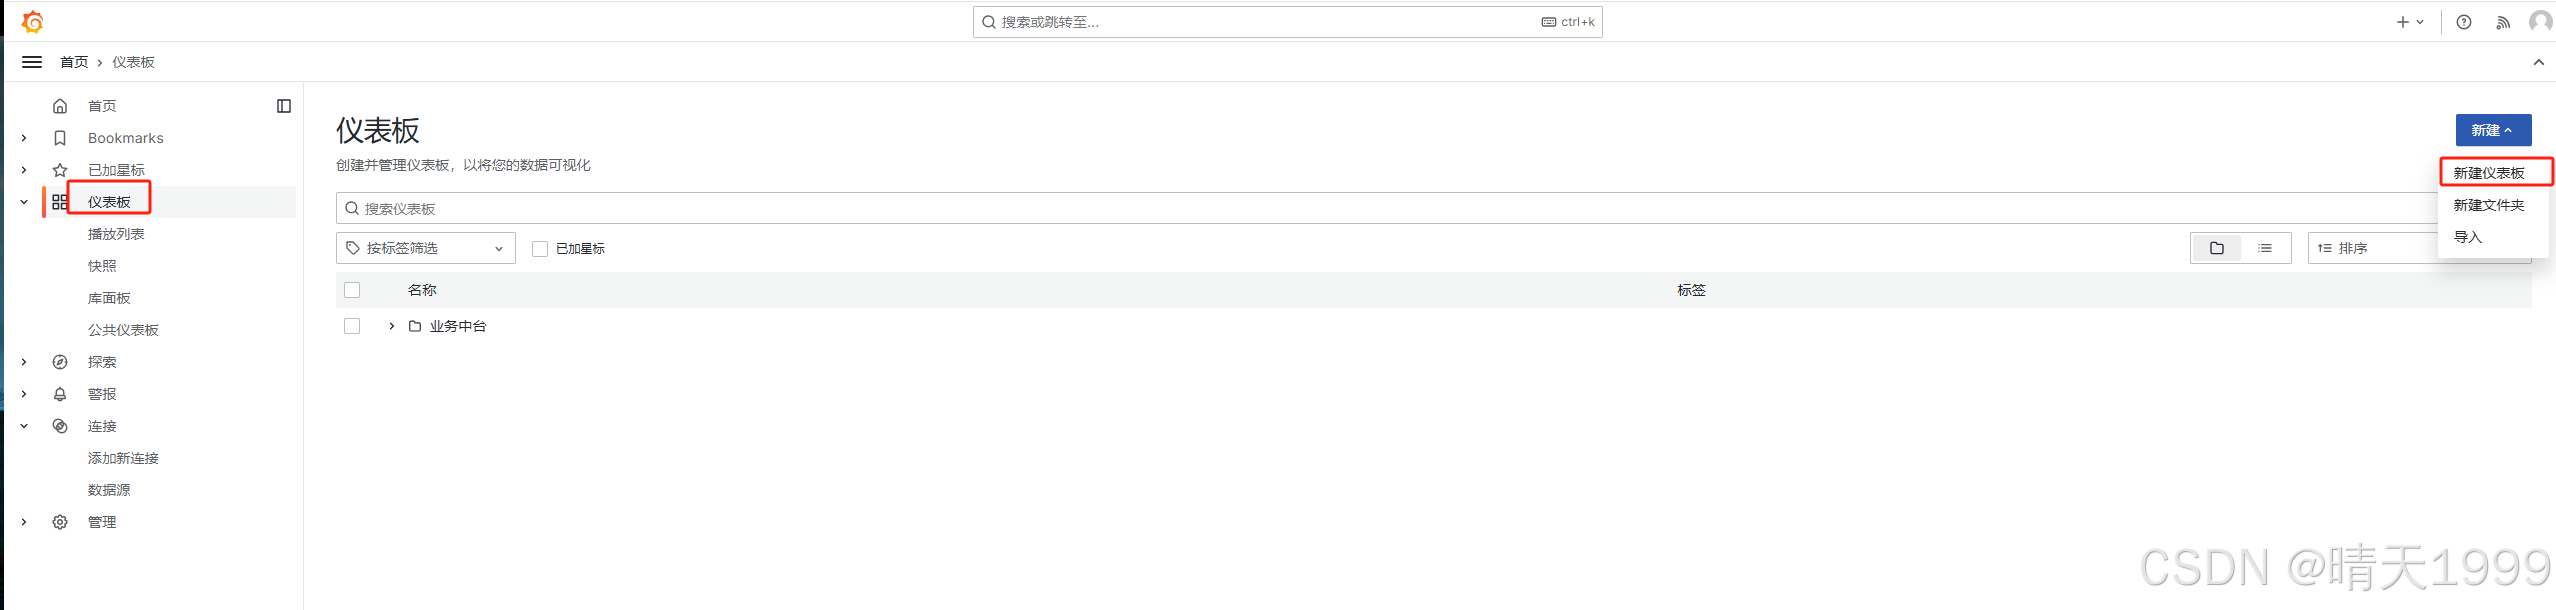
2、新建仪表板

通过grafan的模板选择,我选择的模板是14057
模板选择地址:grafana dashboards | grafana labs

点击保存和导入

打开grafana查看刚才配置的mysql服务器检测数据

到此这篇关于mysqld_exporter+prometheus+grafana 配置小结的文章就介绍到这了,更多相关mysqld_exporter+prometheus+grafana 配置内容请搜索代码网以前的文章或继续浏览下面的相关文章希望大家以后多多支持代码网!


发表评论