前言
在数据分析和科学计算领域,matplotlib和numpy是两个不可或缺的工具。matplotlib是一个强大的绘图库,而numpy则是用于科学计算的基础库。这两者结合使用,可以让我们高效地处理和可视化数据。接下来,我将通过通俗易懂的方式,结合代码和案例,讲解matplotlib与numpy的结合使用技术。
一、安装与基础准备
首先,确保你已经安装了matplotlib和numpy。你可以使用pip命令进行安装:
pip install matplotlib numpy
安装完成后,我们需要在代码中导入这两个库:
import matplotlib.pyplot as plt
import numpy as np
二、numpy基础操作
numpy提供了多维数组对象(ndarray)以及一系列用于操作这些数组的函数。这些数组对象可以让我们高效地存储和处理大量数据。
创建数组
# 创建一个一维数组
arr_1d = np.array([1, 2, 3, 4, 5])

# 创建一个二维数组
arr_2d = np.array([[1, 2, 3], [4, 5, 6]])

# 使用arange函数生成一个等差数列
arr_range = np.arange(0, 10, 2)  # 从0到10(不包括10),步长为2
数组的基本操作
# 数组的形状
print(arr_2d.shape)  # 输出: (2, 3)

# 数组的类型
print(arr_1d.dtype)  # 输出: int64

# 数组的索引和切片
print(arr_2d[0, 1])  # 输出: 2
print(arr_2d[0, :])  # 输出: [1 2 3]

# 数组的形状变换
arr_reshaped = arr_1d.reshape((5, 1))
print(arr_reshaped)
# 输出:
# [[1]
#  [2]
#  [3]
#  [4]
#  [5]]
数组的数学运算
# 数组间的加法
arr_add = arr_1d + 10
print(arr_add)  # 输出: [11 12 13 14 15]

# 数组间的乘法(元素级乘法)
arr_mul = arr_1d * 2
print(arr_mul)  # 输出: [ 2  4  6  8 10]

# 数组的平方根
arr_sqrt = np.sqrt(arr_1d)
print(arr_sqrt)  # 输出: [1.         1.41421356 1.73205081 2.         2.23606798]
三、matplotlib基础绘图
matplotlib提供了丰富的绘图功能,包括折线图、柱状图、散点图等。接下来,我们将通过几个简单的例子来展示如何使用matplotlib进行绘图。
绘制折线图
x = np.arange(0, 10, 1)
y = x ** 2

plt.plot(x, y)
plt.xlabel('x')
plt.ylabel('y')
plt.title('simple line plot')
plt.show()
绘制柱状图
categories = ['a', 'b', 'c', 'd']
values = [4, 7, 1, 8]

plt.bar(categories, values)
plt.xlabel('categories')
plt.ylabel('values')
plt.title('simple bar plot')
plt.show()
绘制散点图
x = np.random.rand(50)
y = np.random.rand(50)

plt.scatter(x, y)
plt.xlabel('x')
plt.ylabel('y')
plt.title('simple scatter plot')
plt.show()
四、matplotlib与numpy结合使用案例
接下来,我们将通过几个具体的案例,展示如何将matplotlib与numpy结合使用,来处理和可视化数据。
正弦和余弦函数绘图
x = np.linspace(0, 2 * np.pi, 100)  # 生成0到2π之间的100个点
y_sin = np.sin(x)
y_cos = np.cos(x)

plt.plot(x, y_sin, label='sin(x)')
plt.plot(x, y_cos, label='cos(x)')
plt.xlabel('x')
plt.ylabel('y')
plt.title('sine and cosine functions')
plt.legend()  # 显示图例
plt.show()
在这个例子中,我们使用np.linspace函数生成了一个等间距的数字数组,然后计算了这些点的正弦值和余弦值。最后,我们使用plt.plot函数绘制了正弦和余弦函数的曲线,并添加了图例。
绘制直方图
data = np.random.randn(1000)  # 生成1000个服从正态分布的随机数

plt.hist(data, bins=30, edgecolor='black')
plt.xlabel('value')
plt.ylabel('frequency')
plt.title('histogram of normal distribution')
plt.show()
在这个例子中,我们使用np.random.randn函数生成了1000个服从正态分布的随机数,然后使用plt.hist函数绘制了这些数据的直方图。通过设置bins参数,我们可以控制直方图的柱数。
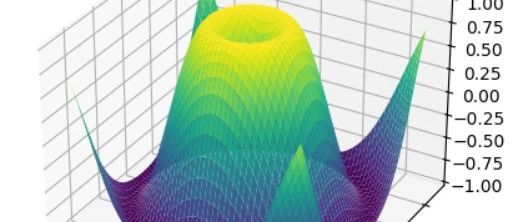
绘制三维图形
matplotlib的mplot3d工具包允许我们绘制三维图形。下面是一个绘制三维散点图的例子:
from mpl_toolkits.mplot3d import axes3d

fig = plt.figure()
ax = fig.add_subplot(111, projection='3d')

x = np.random.rand(50)
y = np.random.rand(50)
z = np.random.rand(50)

ax.scatter(x, y, z, c='r', marker='o')
ax.set_xlabel('x label')
ax.set_ylabel('y label')
ax.set_zlabel('z label')
ax.set_title('3d scatter plot')
plt.show()
在这个例子中,我们首先导入了axes3d工具包,然后创建了一个三维图形对象。接着,我们生成了三个随机数组作为三维散点图的x、y、z坐标。最后,我们使用ax.scatter函数绘制了三维散点图,并设置了坐标轴的标签和标题。
绘制子图
有时,我们需要在同一个窗口中绘制多个图形。matplotlib提供了plt.subplot函数来实现这一功能。
x = np.arange(0, 10, 1)
y1 = x ** 2
y2 = np.sqrt(x)

plt.subplot(2, 1, 1)  # 2行1列,当前是第1个子图
plt.plot(x, y1)
plt.xlabel('x')
plt.ylabel('y1')
plt.title('y1 = x^2')

plt.subplot(2, 1, 2)  # 2行1列,当前是第2个子图
plt.plot(x, y2)
plt.xlabel('x')
plt.ylabel('y2')
plt.title('y2 = sqrt(x)')

plt.tight_layout()  # 自动调整子图参数, 使之填充整个图像区域
plt.show()
在这个例子中,我们使用plt.subplot函数创建了两个子图。第一个子图绘制了y1=x^2的曲线,第二个子图绘制了y2=sqrt(x)的曲线。通过设置plt.tight_layout()函数,我们可以自动调整子图之间的间距,使它们看起来更加美观。
五、总结
通过本文的介绍,我们了解了matplotlib和numpy的基本使用方法,并通过一些具体的案例展示了如何将它们结合使用来处理和可视化数据。matplotlib提供了丰富的绘图功能,而numpy则提供了高效的数据处理能力。将它们结合使用,可以让我们更加高效地处理和分析数据。
在实际应用中,我们可能会遇到更加复杂的数据和绘图需求。此时,我们可以进一步学习matplotlib和numpy的高级功能,如自定义图形样式、处理大规模数据等。同时,我们也可以探索其他相关的python库,如pandas(用于数据处理和分析)、seaborn(基于matplotlib的高级绘图库)等,以丰富我们的数据分析和可视化工具集。
到此这篇关于matplotlib与numpy结合使用技术的文章就介绍到这了,更多相关matplotlib与numpy结合使用内容请搜索代码网以前的文章或继续浏览下面的相关文章希望大家以后多多支持代码网!


发表评论