如果没有安装 matplotlib 需要先安装:
pip install matplotlib
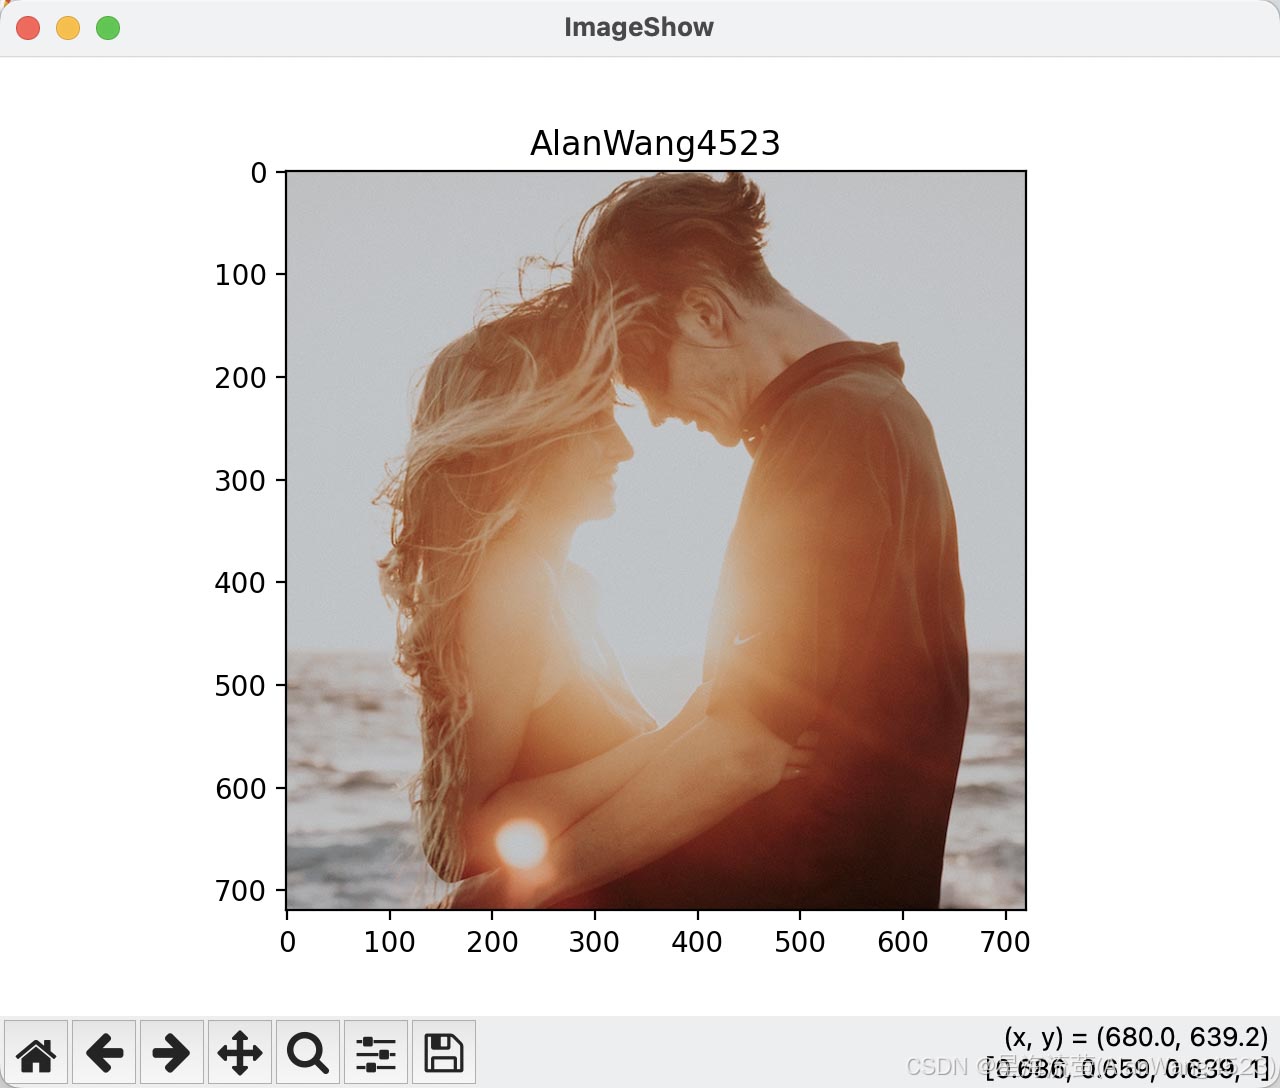
一、读取图片并显示
import matplotlib.pyplot as plt

image_path = "/users/alanwang4523/desktop/debug/files/image.png"
image_array = plt.imread(image_path)

plt.figure("imageshow")  # 图像窗口名称
plt.axis('on')  # 显示坐标轴,不显示设置为 off
plt.title("alanwang4523")  # 图像标题
plt.imshow(image_array)
plt.show()
显示图片:
二、显示灰度图
如果 image_array 是灰度图
plt.imshow(image_array)
改成 ==>
plt.imshow(image_array, cmap='greys')
读取 mnist 数据集手写数据并显示
import matplotlib.pyplot as plt

def test_show_mnist_num():
	data_path = "data/mnist_test_10.csv"
	data_file = open(data_path, 'r')
	line = data_file.readline()

	all_values = line.split(',')
	# mnist 数据格式: label,784img_data
	label = int(all_values[0])
	image_array = np.asfarray(all_values[1:]).reshape((28, 28))

	plt.figure("image")  # 图像窗口名称
	plt.imshow(image_array, cmap='greys', interpolation='none')
	plt.axis('on')  # 显示坐标轴,不显示设置为 off
	plt.title("the num is: {}".format(label))  # 图像标题
	plt.show()

	data_file.close()

test_show_mnist_num()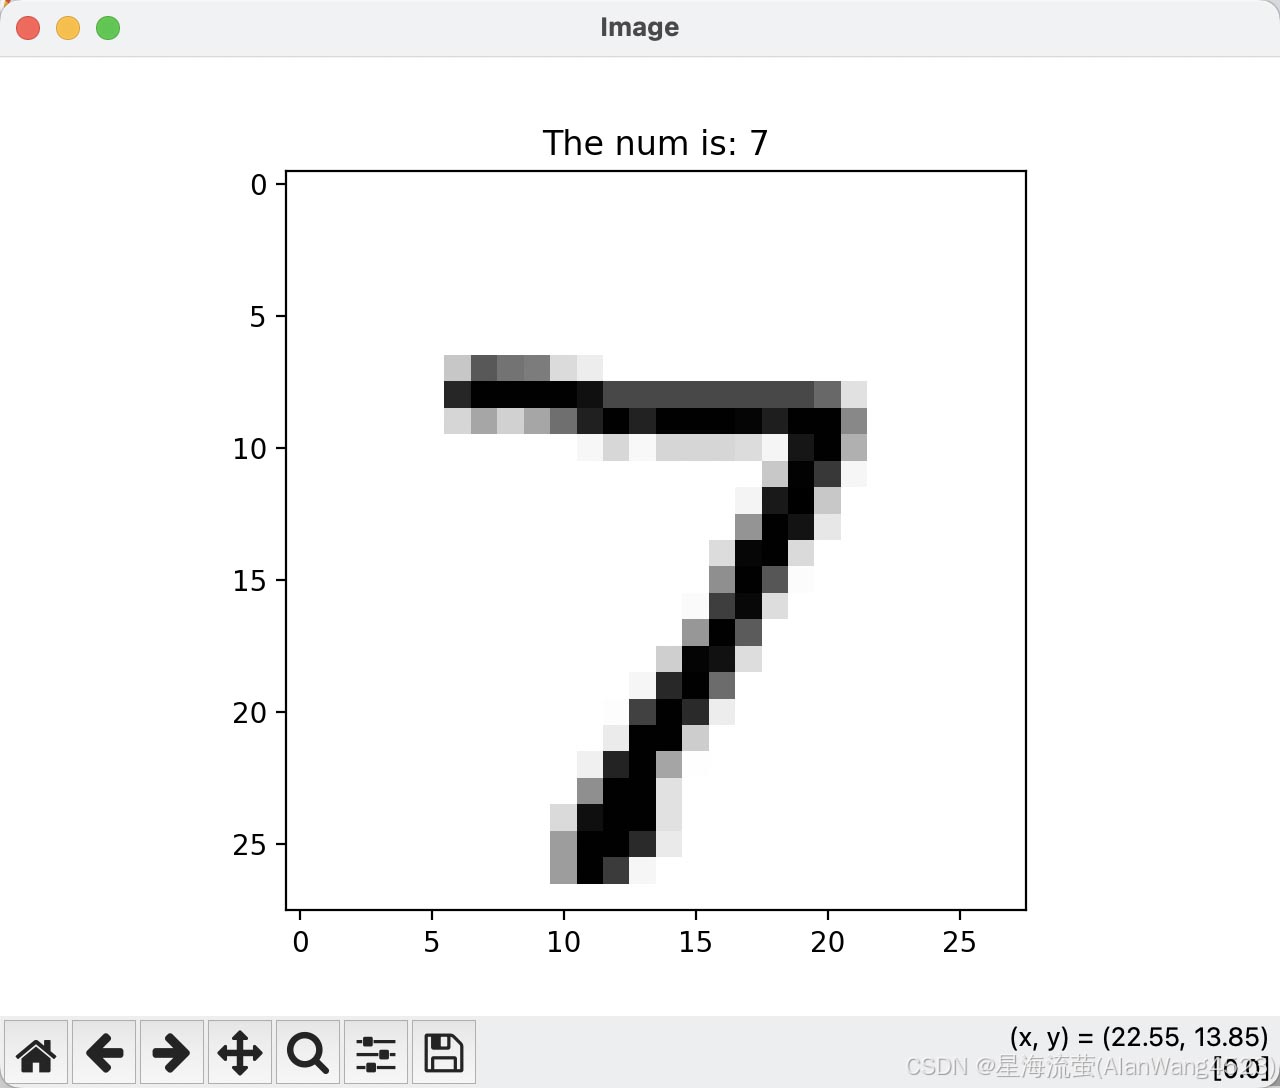
总结
以上为个人经验,希望能给大家一个参考,也希望大家多多支持代码网。


发表评论