一、chart曲线控件使用1
1.控件基本设置
  chart1.chartareas[0].axisy.isstartedfromzero = false; //设置y轴自适应
  chart1.series["瞬时值"].borderwidth = 2; // 设置曲线宽度为2个像素,注意[]中写入的series的name
  chart1.series["瞬时值"].color = color.red; // 设置曲线显示颜色
  chart1.chartareas[0].axisx.minimum = 0;  //设置x轴最小值
  chart1.chartareas[0].axisx.maximum = 100;//设置x轴最大值
  //chart1.chartareas[0].axisx.minimum = double.nan;//设置x轴最小值为自适应
  //chart1.chartareas[0].axisx.maximum = double.nan;//设置x轴最小值为自适应
  chart1.chartareas[0].axisx.majorgrid.enabled = false;//取消chart1x轴方向显示单元格
  chart1.chartareas[0].axisy.majorgrid.enabled = false;//取消chart1y轴方向显示单元格
  chart1.series[0].points.clear(); //清除控件上所有点位
  chart1.update(); //刷新控件显示
  chart1.series[0].points.removeat(0); //每次移除最早的点,需要配合显示的点数使用
2.曲线鼠标滚轮缩放
   // 添加鼠标滚轮事件  在窗体加载时进行绑定
  chart1.mousewheel += chart1_mousewheel;

  private void chart1_mousewheel(object sender, mouseeventargs e)
  {
      // 获取鼠标滚轮的滚动方向
      int delta = e.delta;

      // 根据滚动方向进行放大或缩小
      if (delta < 0)
      {
          // 放大图表
          chart1.chartareas[0].axisx.scaleview.zoomreset();
          chart1.chartareas[0].axisy.scaleview.zoomreset();
      }
      else if (delta > 0)
      {
          // 缩小图表
          double xmin = chart1.chartareas[0].axisx.scaleview.viewminimum;
          double xmax = chart1.chartareas[0].axisx.scaleview.viewmaximum;
          double ymin = chart1.chartareas[0].axisy.scaleview.viewminimum;
          double ymax = chart1.chartareas[0].axisy.scaleview.viewmaximum;

          double posxstart = chart1.chartareas[0].axisx.pixelpositiontovalue(e.location.x) - (xmax - xmin) / 3;
          double posxfinish = chart1.chartareas[0].axisx.pixelpositiontovalue(e.location.x) + (xmax - xmin) / 3;
          double posystart = chart1.chartareas[0].axisy.pixelpositiontovalue(e.location.y) - (ymax - ymin) / 3;
          double posyfinish = chart1.chartareas[0].axisy.pixelpositiontovalue(e.location.y) + (ymax - ymin) / 3;

          chart1.chartareas[0].axisx.scaleview.zoom(posxstart, posxfinish);
          chart1.chartareas[0].axisy.scaleview.zoom(posystart, posyfinish);
      }
  }
3.1 曲线添加数据(添加x轴和y轴点位)
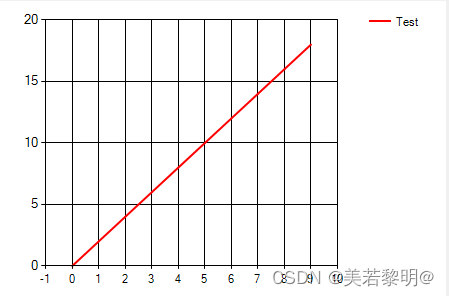
 chart1.series[0].charttype =
 system.windows.forms.datavisualization.charting.seriescharttype.fastline; //设置曲线样式为线条
 chart1.series[0].borderwidth = 2; // 设置曲线宽度为2个像素,注意[]中写入的series的name
 chart1.series[0].color = color.red; // 设置曲线显示颜色
 chart1.series[0].name = "test";    //设置曲线名称
 for (int i = 0; i < 10; i++)
 {
     chart1.series[0].points.addxy(i, i*2); //添加点位
 }
运行结果:
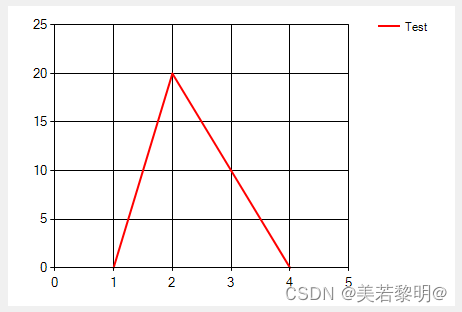
3.2曲线添加数据(添加y轴点位)
  chart1.series[0].charttype = system.windows.forms.datavisualization.charting.seriescharttype.fastline; //设置曲线样式为线条
  chart1.series[0].borderwidth = 2; // 设置曲线宽度为2个像素,注意[]中写入的series的name
  chart1.series[0].color = color.red; // 设置曲线显示颜色
  chart1.series[0].name = "test";    //设置曲线名称

  chart1.series[0].points.addy(0);//添加点位
  chart1.series[0].points.addy(20);//
  chart1.series[0].points.addy(10);//添加点位
  chart1.series[0].points.addy(0);//添加点位
运行结果:
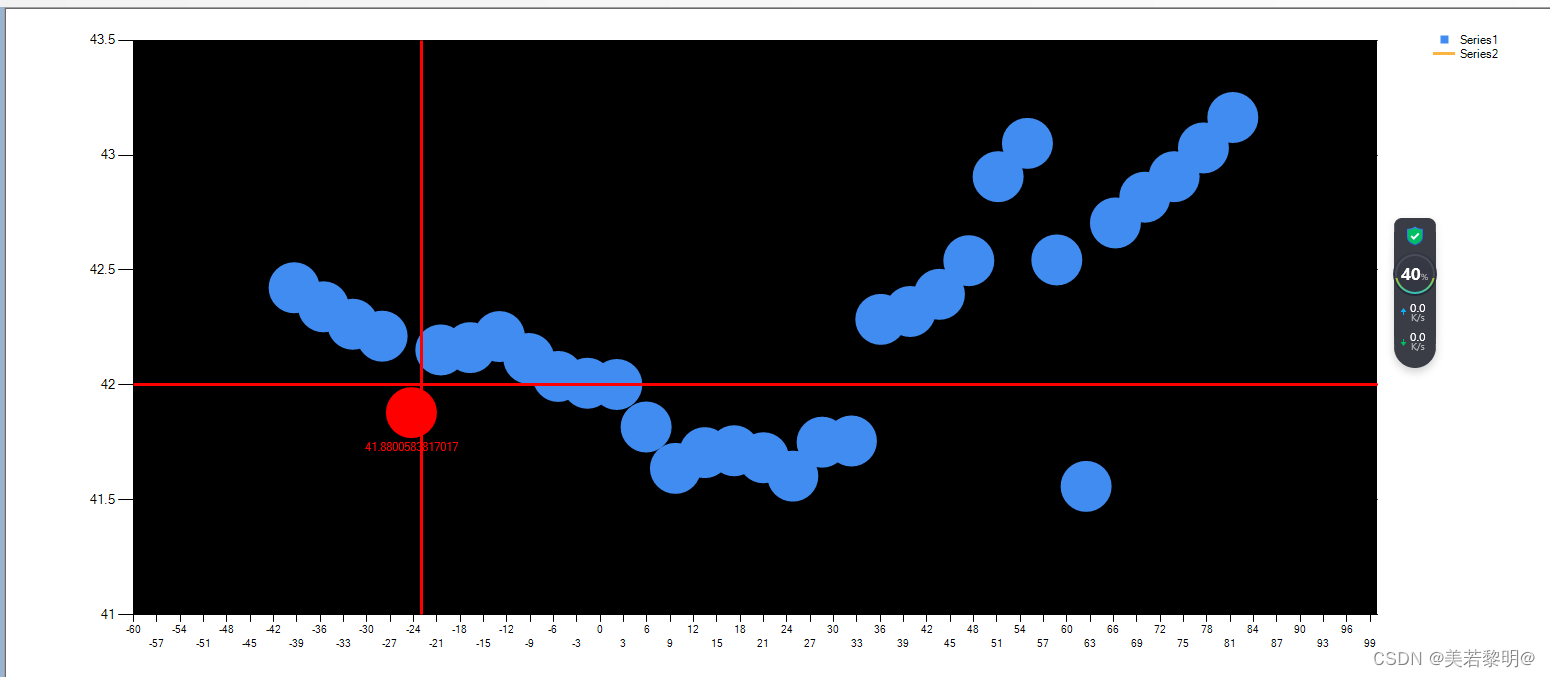
二、chart曲线控件使用2(2024年5月31日13:57:15)
通过鼠标左键调整数据点在y轴方向的大小
1、初始化设置
 chart1.chartareas[0].backcolor = color.black;  //设置chart控件的图标区域背景颜色为黑色
 chart1.chartareas[0].axisy.isstartedfromzero = false;//设置chart控件的图标区域y轴最小值是否为0 false表示从数据点的最小值获取,true表示从0开始(正数)
 chart1.chartareas[0].axisx.minimum = double.nan;  //设置chart控件的图标区域x轴范围最小值 为非数字类型
 chart1.chartareas[0].axisx.maximum = double.nan;  //设置chart控件的图标区域x轴范围最大值 为非数字类型
 chart1.chartareas[0].axisx.interval = 3;          //设置x轴间距(分辨率)
 chart1.series[0].markersize = 10;                 //设置曲线0的显示大小为10(曲线的粗细)

 chart1.chartareas[0].cursorx.isuserenabled = true; // 允许在x轴启用光标
 chart1.chartareas[0].cursorx.isuserselectionenabled = false; // 不允许选择数据点后在x轴上移动
 chart1.chartareas[0].cursorx.linewidth = 3; // 设置光标宽度

 chart1.chartareas[0].cursory.isuserenabled = true; // 允许在y轴启用光标
 chart1.chartareas[0].cursory.isuserselectionenabled = false; // 不允许选择数据点后在x轴上移动
 chart1.chartareas[0].cursory.linewidth = 3; // 设置光标宽度

// chart1.mousewheel += chart1_mousewheel;  //设置鼠标滚轮缩放曲线大小事件
2、设置chart控件 按下,移动 ,释放鼠标事件
 private void chart1_mousedown(object sender, mouseeventargs e) //鼠标按下事件
 {
     // 获取选中的数据点位
     hittestresult result = chart1.hittest(e.x, e.y);
     if (result.chartelementtype == chartelementtype.datapoint)
     {
         // 设置数据点位允许拖动
         chart1.cursor = cursors.default;
         result.series.points[result.pointindex].isvalueshownaslabel = true;
         result.series.points[result.pointindex].markercolor = color.red;
         result.series.points[result.pointindex].markerstyle = markerstyle.cross;

     }
 }
  private void chart1_mousemove_1(object sender, mouseeventargs e) //鼠标移动事件
  {
      // 拖动数据点位
      if (e.button == mousebuttons.left)
      {
          hittestresult result = chart1.hittest(e.x, e.y);

          if (result.chartelementtype == chartelementtype.datapoint)
          {
              double yvalue = chart1.chartareas[0].axisy.pixelpositiontovalue(e.y);
              result.series.points[result.pointindex].setvaluey(yvalue);
              result.series.points[result.pointindex].label = yvalue.tostring();
              result.series.points[result.pointindex].labelforecolor = color.red;
              #region 每次拖动完毕,将曲线控件上所有点位  重新赋值给listview控件
              // 获取series1曲线的所有数据点
              datapointcollection points = chart1.series[0].points;
              list<double> decimals = new list<double>();
              int count = 1;
              // 遍历数据点集合,获取每个数据点的坐标和其他信息
              foreach (datapoint point in points)
              {
                  double x = point.xvalue; // 获取数据点的x坐标值
                  double y = point.yvalues[0]; // 获取数据点的y坐标值
                  decimals.add(y);
                  listview1.items[1].subitems[count].text = y.tostring("f4"); //修改指定行列的数据为任意值
                  count++;
              }
              #endregion
          }
      }
      else
      {
          // 结束拖动
          chart1.cursor = cursors.default;
          foreach (datapoint point in chart1.series[0].points)
          {
              point.markerstyle = markerstyle.none;
          }
      }
  }
private void chart1_mouseup(object sender, mouseeventargs e) //鼠标释放事件
{
// 结束拖动
chart1.cursor = cursors.default;
foreach (datapoint point in chart1.series[0].points)
{
point.markerstyle = markerstyle.none;
}
}2、运行结果


发表评论