import numpy as np
import matplotlib.pyplot as plt
from sklearn.datasets import load_iris
from sklearn.model_selection import train_test_split
from sklearn.tree import decisiontreeclassifier, export_text
from sklearn import metrics
# load the iris dataset
iris = load_iris()
x = iris.data
y = iris.target
# split the dataset into training and testing sets
x_train, x_test, y_train, y_test = train_test_split(x, y, test_size=0.2, random_state=42)
# create a decision tree classifier
clf = decisiontreeclassifier(random_state=42)
# train the classifier on the training set
clf.fit(x_train, y_train)
# predictions on the training set
y_train_pred = clf.predict(x_train)
# predictions on the testing set
y_test_pred = clf.predict(x_test)
# calculate accuracy
accuracy_train = metrics.accuracy_score(y_train, y_train_pred)
accuracy_test = metrics.accuracy_score(y_test, y_test_pred)
# visualize the decision tree (text representation)
tree_rules = export_text(clf, feature_names=iris.feature_names)
print("decision tree rules:\n", tree_rules)
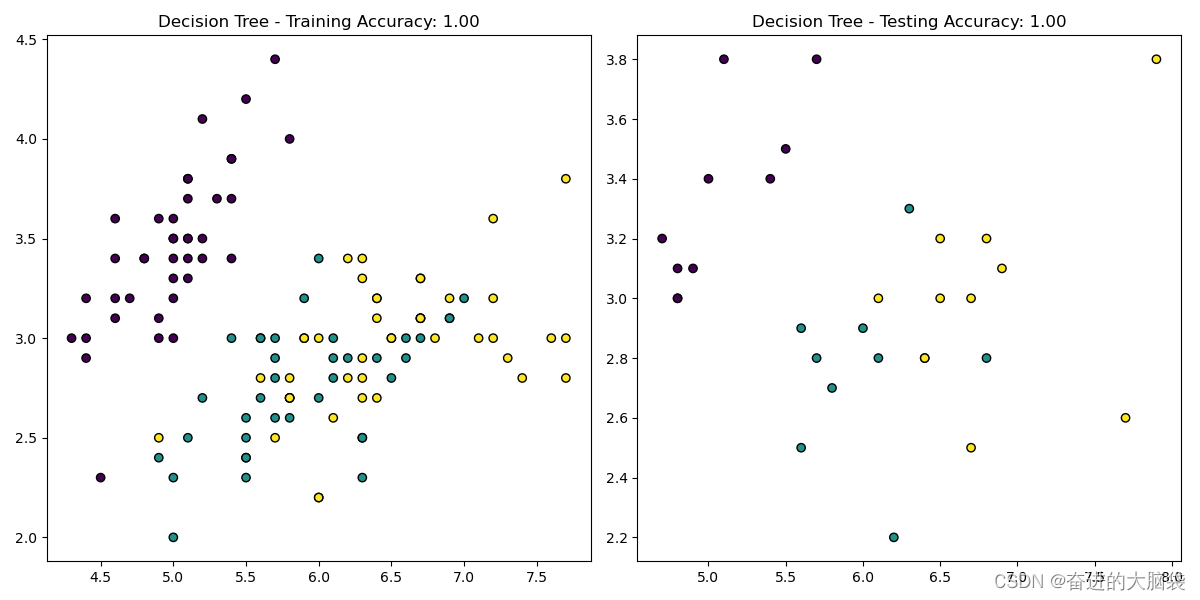
# plotting the training set
plt.figure(figsize=(12, 6))
plt.subplot(1, 2, 1)
plt.scatter(x_train[:, 0], x_train[:, 1], c=y_train_pred, cmap='viridis', edgecolors='k')
plt.title(f"decision tree - training accuracy: {accuracy_train:.2f}")
# plotting the testing set
plt.subplot(1, 2, 2)
plt.scatter(x_test[:, 0], x_test[:, 1], c=y_test_pred, cmap='viridis', edgecolors='k')
plt.title(f"decision tree - testing accuracy: {accuracy_test:.2f}")
plt.tight_layout()
plt.show()
这个输出是训练后决策树的文本表示。下面解释一下这个表示:
|--- petal length (cm) <= 2.45
|   |--- class: 0
|--- petal length (cm) >  2.45
|   |--- petal length (cm) <= 4.75
|   |   |--- petal width (cm) <= 1.65
|   |   |   |--- class: 1
|   |   |--- petal width (cm) >  1.65
|   |   |   |--- class: 2
|   |--- petal length (cm) >  4.75
|   |   |--- petal width (cm) <= 1.75
|   |   |   |--- petal length (cm) <= 4.95
|   |   |   |   |--- class: 1
|   |   |   |--- petal length (cm) >  4.95
|   |   |   |   |--- petal width (cm) <= 1.55
|   |   |   |   |   |--- class: 2
|   |   |   |   |--- petal width (cm) >  1.55
|   |   |   |   |   |--- petal length (cm) <= 5.45
|   |   |   |   |   |   |--- class: 1
|   |   |   |   |   |--- petal length (cm) >  5.45
|   |   |   |   |   |   |--- class: 2
|   |   |--- petal width (cm) >  1.75
|   |   |   |--- petal length (cm) <= 4.85
|   |   |   |   |--- sepal width (cm) <= 3.10
|   |   |   |   |   |--- class: 2
|   |   |   |   |--- sepal width (cm) >  3.10
|   |   |   |   |   |--- class: 1
|   |   |   |--- petal length (cm) >  4.85
|   |   |   |   |--- class: 2
这个表示是决策树的结构,每一行代表一个决策节点,缩进表示层次。例如,第一行表示如果花瓣长度小于等于2.45厘米,则预测类别为0。如果花瓣长度大于2.45厘米,则会根据下一个条件(petal length (cm) <= 4.75)继续分支,以此类推。
最后的类别预测(class: x)表示决策树的叶子节点,其中x是预测的类别。
这个决策树在训练时学习了如何根据输入特征来做出分类决策。


发表评论